

What is the CPI (Consumer Price Index) and How to Trade it?
Join our Telegram channel for more market analysis & trading tips: t.me/synapsetrading
Table of Contents
What Is the CPI (Consumer Price Index), and How Do Traders Use It?
Last updated: 3 July 2026 · By Spencer Li, CFTe
The Consumer Price Index (CPI) is a monthly measure of the average change in prices that consumers pay for a fixed basket of goods and services, and it is the number traders watch most closely to read inflation. It is published by a national statistics agency (in the US, the Bureau of Labor Statistics), and the year-over-year change in the CPI is what people mean when they say “the inflation rate.” For traders, the CPI matters for one reason above all others: it shapes what the central bank does with interest rates. A hotter-than-expected CPI tends to push rate expectations up, which usually pressures stocks and bonds. A cooler-than-expected CPI tends to do the opposite. The single most useful number in the report is not the headline figure itself but how it lands versus the forecast, and that is the part most beginners miss.
Here is what the CPI is, how it is built, the numbers inside the report, and how traders actually use it on release day.
What is the CPI, and where did it come from?
The Consumer Price Index measures the average change over time in the prices paid by consumers for a basket of everyday goods and services. Divide this period’s basket price by an earlier period’s, and you get a measure of how much the cost of living has moved. When the index rises, your money buys less. That loss of purchasing power is inflation.
The CPI has been around longer than most people assume. The US Bureau of Labor Statistics (BLS) started collecting price data in the late 19th century. It was formally tasked with calculating the CPI in 1918, and the first official US CPI was published in 1919. Today most countries run their own version, and it remains the standard yardstick for inflation, purchasing power, and the cost of living.
How is the CPI calculated?
The CPI comes from a statistical survey. The agency builds a basket of goods and services meant to represent what a typical household actually buys, then tracks the prices of those items over time. The basket is refreshed periodically as spending habits change, so it does not get stuck measuring things nobody buys anymore.
The calculation runs in five steps:
- Select the basket. Choose goods and services that represent typical consumer spending.
- Collect price data. Sample prices at regular intervals (usually monthly) from retail outlets, service providers, and rental markets.
- Weight the prices. Give each item importance based on how much of the household budget it eats up. Housing carries far more weight than apparel, because people spend far more on it.
- Calculate the average. Combine the weighted prices into a single basket price.
- Calculate the inflation rate. Compare that basket price across periods. The percentage change is the inflation rate.
Do note that the CPI is only one way to measure inflation. Two others you will see referenced are the Producer Price Index (PPI), which tracks prices at the wholesale/producer level rather than the consumer level, and the GDP Deflator, which covers the whole economy’s output. They tell slightly different stories, which is why a sharp reading often cross-checks them.
What are the key numbers in the CPI report?
The release is not one number. It is a stack of them, and knowing which line moved tells you where the inflation is coming from. Here are the main figures, what each one measures, and why a trader cares.
| Number | What it measures | Why a trader watches it |
|---|---|---|
| Headline CPI | Average price change across the full basket | The marquee figure; sets the first market reaction |
| Core CPI | CPI excluding food and energy | Strips out the volatile stuff; central banks lean on this for the underlying trend |
| Inflation rate | Percentage change in CPI over a period (usually year-over-year) | The “is inflation rising or cooling” read |
| Food and beverage index | Prices of food and drinks | Volatile component; can swing headline without changing the trend |
| Energy index | Gasoline, electricity, heating oil | The other volatile component; oil shocks show up here first |
| Housing index | Rent, owners’ equivalent rent, shelter | The heaviest-weighted component; slow-moving but dominant |
| Transportation index | Gasoline, motor vehicle insurance, public transit | Mixes energy and services |
| Medical care index | Hospital, physician, prescription drug prices | A persistent, sticky-services read |
| Apparel index | Clothing and footwear | Small weight; rarely the story |
The reason core CPI (the headline number minus food and energy) gets so much attention is that food and energy prices jump around for reasons that have nothing to do with broad inflation, like a cold snap or an oil supply shock. Strip them out and you see the underlying trend more clearly. That is why a central bank, and a sharp trader, will often watch core more closely than the headline.
How do traders and investors use CPI data?
The CPI matters to markets through one main channel: interest rates. Inflation erodes the value of money, so when it runs hot, central banks tend to raise rates to cool it down. Higher rates tend to slow spending and growth, which is generally a headwind for stocks and bonds. When inflation runs cold, central banks can cut rates to encourage spending, which is generally a tailwind.
So traders read the CPI as a clue about the central bank’s next move. Rising, hotter inflation points toward higher rates ahead. Cooling inflation points toward steady or lower rates. From there, traders adjust positioning, lean their bias for stocks and bonds, and decide on the timing and size of trades around the release.
Here is the part that trips up beginners. The market does not react to whether inflation is high or low in absolute terms. It reacts to the number versus what was already expected. A high CPI that everyone forecast is mostly priced in already. The move comes from the surprise, the gap between the actual print and the consensus forecast. This is the one rule to internalize before you ever trade a release.
News trading on CPI: what actually happens at the release
On release day, two figures do most of the work: the headline CPI and the core CPI (excluding food and energy). Traders compare both against the consensus forecast and gauge the surprise, then map that to a rate expectation. Here is the simplified cheat sheet.
| CPI versus forecast | What it signals | Typical first reaction |
|---|---|---|
| Hotter than expected | Inflation is a concern; central bank may hike | Risk-off: stocks and bonds tend to fall |
| In line with forecast | Story unchanged; surprise is small | Muted; the move is usually small |
| Cooler than expected | Inflation easing; central bank may hold or cut | Risk-on: stocks and bonds tend to rise |
Personally, I do not trade the first violent seconds of a CPI print, and I would gently steer a new trader away from it too. The spreads blow out, the initial spike often reverses, and you are competing with machines that read the number in milliseconds. The cleaner edge is in the hours and days after, once the market has digested the surprise and a real direction settles in. The release is the catalyst. Your job is to trade the move it sets up, not to outrace an algorithm to the headline.
This is where the human edge lives. A data feed will deliver the CPI number to a thousand traders at the exact same instant, and a bot will price the surprise before you have finished reading the second decimal. What the feed will not do is tell you to sit on your hands through the first whipsaw, size the trade for a volatile release, or skip the day entirely because the surprise was too small to bother with. The number is free. The judgment about whether to act on it is the part worth learning, and it is the first of the Five Edges no algorithm can trade for you.
Should you add the CPI to your trading toolbox?
For most traders, yes, but as context rather than a trigger. The CPI is one of the cleanest reads you have on inflation and, by extension, on what the central bank is likely to do next. Even if you never trade the release itself, knowing whether inflation is running hot or cooling helps you understand why the market is doing what it is doing. That context is worth far more than chasing one volatile number once a month.
FAQ
What is the CPI in simple terms?
The Consumer Price Index measures the average change in the prices of a basket of everyday goods and services that consumers buy. The year-over-year change in the CPI is what people call the inflation rate.
Why does the CPI move the stock market?
Because it shapes interest-rate expectations. A hotter-than-expected CPI raises the odds of rate hikes, which tends to pressure stocks and bonds. A cooler-than-expected CPI does the opposite. The reaction comes from the surprise versus forecast, not the absolute number.
What is the difference between headline CPI and core CPI?
Headline CPI covers the full basket. Core CPI excludes food and energy, which are volatile and can swing the headline for reasons unrelated to broad inflation. Central banks lean on core to read the underlying trend.
Is the CPI the same as the inflation rate?
Not quite. The CPI is the index (a price level). The inflation rate is the percentage change in that index over a period, usually a year. The inflation rate is derived from the CPI.
How is the CPI different from the PPI?
The CPI measures prices at the consumer level. The Producer Price Index (PPI) measures prices at the producer or wholesale level, earlier in the supply chain. PPI moves can sometimes hint at where CPI is heading.
So, is the CPI something you will add to your own trading toolbox, or do you prefer to stay out of the way on release day? Let me know in the comments.
And if you want the full framework for trading scheduled economic releases, read the pillar: The Trader’s Guide to News and Economic-Data Trading.
Want a system that does not depend on calling the next CPI? Grab the free 15-Minute Swing Trading Starter Kit. It is the exact routine I use to scan once a day and trade any market in 15 minutes, no economic-calendar gambling required.
About the author. Spencer Li is the founder of Synapse Trading and a Certified Financial Technician (CFTe) with 15 years of trading across stocks, forex, crypto, commodities, and bonds. His trade log is public, 404 trades, losses left in. He teaches low-risk swing trading in 15 minutes a day, one system for any market.
Education, not financial advice. Synapse Trading is not licensed by MAS to advise on investment products. Trading carries risk of loss; past performance is not indicative of future results.
Related
The Trader’s Guide to News and Economic-Data Trading (pillar) · How to trade the NFP (Non-Farm Payrolls) report · Understanding interest rates and central banks
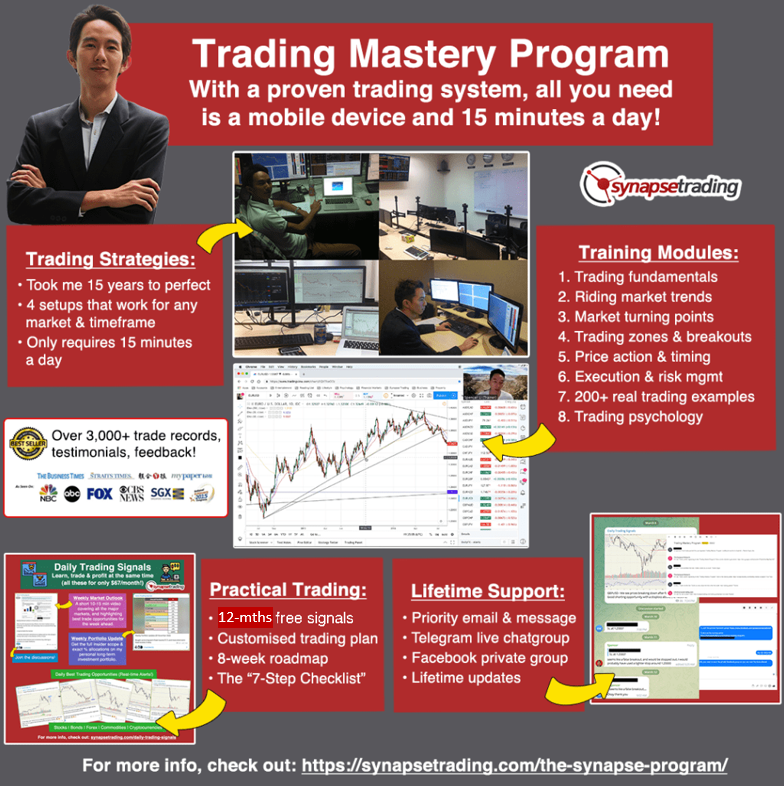 Our flagship mentoring program is suitable for both beginners and advanced traders, covering the 4 strategies which I used over the past 15 years to build up my 7-figure personal trading portfolio.
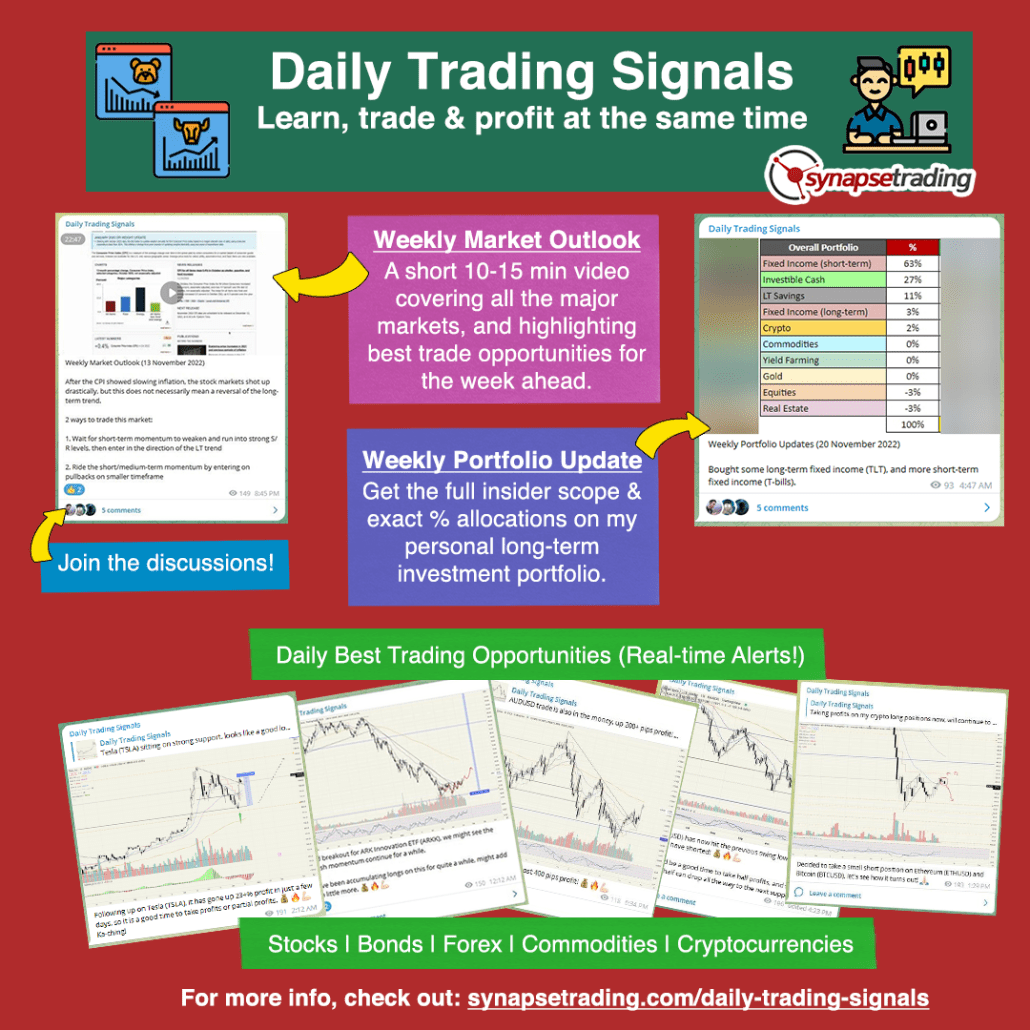 If you're looking for the best trading opportunities every day across various markets, and don't want to spend hours doing the research yourself, check out our private Telegram channel!


Leave a Reply
Want to join the discussion?Feel free to contribute!