• Link to Facebook
  • Link to X
  • Link to Instagram
  • Link to Youtube
  • Link to LinkedIn
  • Link to Mail
Free PDF: The 15-Minute Swing Trader's Checklist, the daily routine of a trader since 2007
Synapse Trading
  • Mentoring
    • Trading Mastery Program
    • All mentoring options
  • Signals
    • Daily trading signals
    • Signals trade log
  • Results
    • Student results and testimonials
    • Public trade log, losses left in
  • Free guides
    • Start here
    • Trading foundations
    • Technical analysis
    • Strategies and systems
    • Risk and money
    • Trading psychology
    • Markets and products
    • Free trading guides
    • Tools and resources
    • Blog
  • About
    • My background
    • My trading journey
    • Media and interviews
    • Travel log
  • Contact
    • Contact me
    • Partnerships
  • Start free
  • Click to open the search input field Click to open the search input field Search
  • Menu Menu

Forex, stocks, crypto, options and commodities – what you trade, as opposed to how.

Spencer Li

Are Deep ITM LEAPS Just Leveraged Stock?

Markets & Products
Deep ITM LEAPS vs stock - options

Deep in-the-money LEAPS vs stock, worked through on one position: what you save, what you pay, and the date that changes everything

Published: 16 October 2026 · Last updated: 2 October 2026 · By Spencer Li, CFTe


Is a deep in-the-money LEAP just leveraged stock? Mostly, with three catches. A reader on Reddit’s options forum asked it almost word for word this year, “Is deep ITM LEAPS just leveraged stocks?”, and it deserves a straight answer.

A deep in-the-money LEAP is a call option with a strike well below today’s price and an expiry one to three years away. It moves almost dollar for dollar with the shares, for a fraction of the cash, so for most of its life it does behave like leveraged stock. The catches are that you pay for it in time value, you collect no dividends, and it has an end date. If the stock falls far enough, the whole premium can go to zero, which is a 100% loss on the cash you put in, from a fall that would have cost a shareholder 30%.
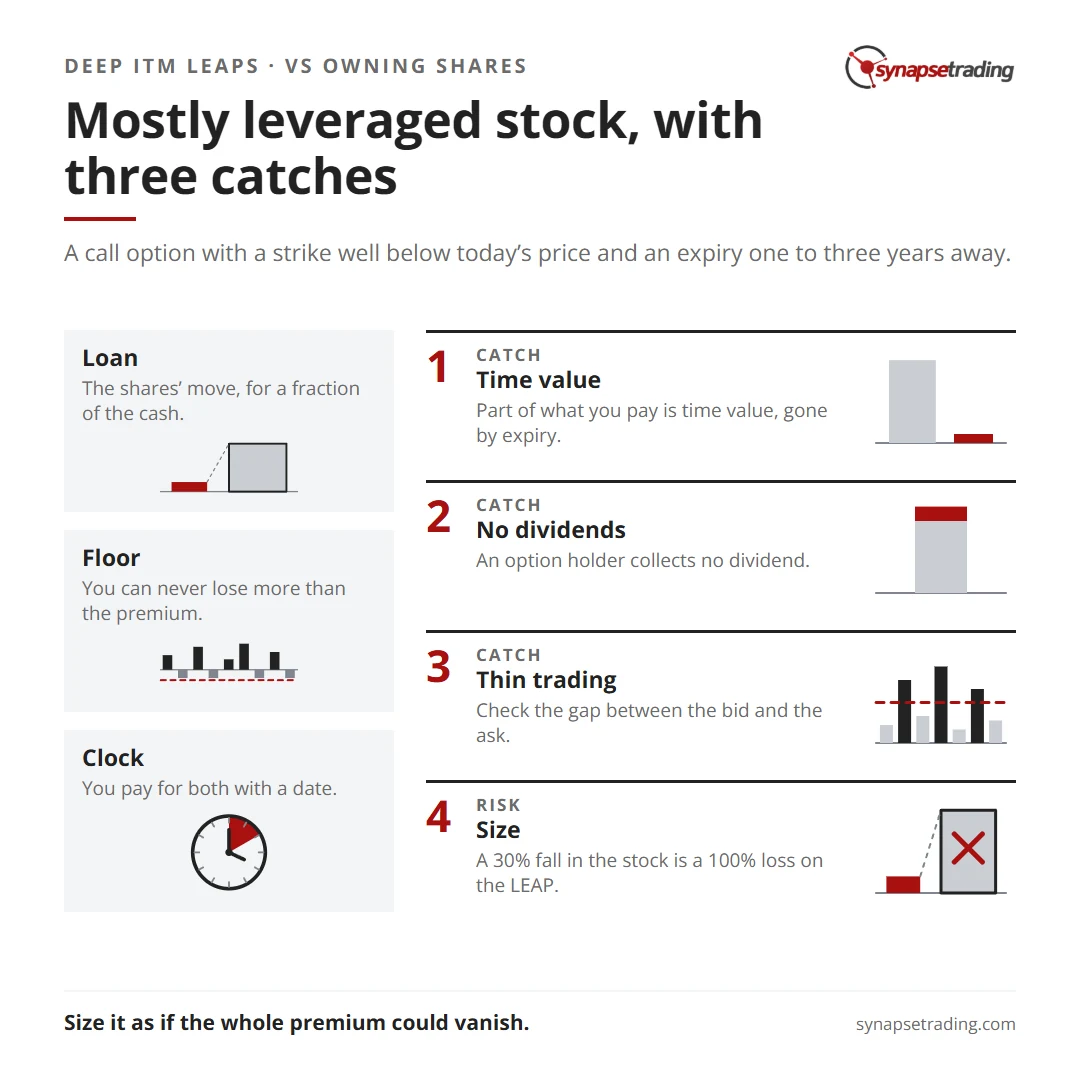
Mostly leveraged stock, with three catches. Summary card for the post: Are Deep ITM LEAPS Just Leveraged Stock?.

What is a deep in-the-money LEAP?

LEAPS stands for long-term equity anticipation securities, which is a long way of saying long-dated options. Cboe, the exchange that lists them, describes equity LEAPS as options that “expire in approximately two to three years from the date of initial listing,” with expiry months “up to 39 months from the date of initial listing, January expiration only.”

“Deep in the money” means the strike sits well below the share price. Most of what you pay is the value the option already has today, and only a small part is the bet on time.

Take a hypothetical stock at USD 100, with round numbers. A call with a strike of 70, expiring in two years, costs about USD 38 a share. Of that 38, 30 is the gap between the share price and the strike. The other 8 is time value, which is what you pay for everything else.

At that strike, the option moves roughly 89 cents for every dollar the stock moves. That is why it feels like owning the shares.

How does a LEAP compare with owning the shares?

One contract covers 100 shares. So the choice in the example is between USD 10,000 for 100 shares, or USD 3,800 for one LEAP that tracks most of their move.

Here is how the two compare two years later, at expiry, before any dividends.

Stock price in two years100 shares, USD 10,000One LEAP, USD 3,800
USD 130+30%+57.9%
USD 110+10%+5.3%
USD 100, unchanged0%−21.1%
USD 70 or below−30% or worse−100%

Read the rows in pairs.

When the stock rises a lot, the LEAP roughly doubles the shareholder’s percentage gain. When it rises a little, the LEAP barely beats breakeven, because the 8 of time value has to be earned back first. When the stock goes nowhere for two years, the shareholder is flat and the LEAP holder is down a fifth.

And at 70, the shareholder has lost 30% and still owns a company. The LEAP holder has lost everything.

A 30% fall in the stock is a 100% loss on the LEAP.
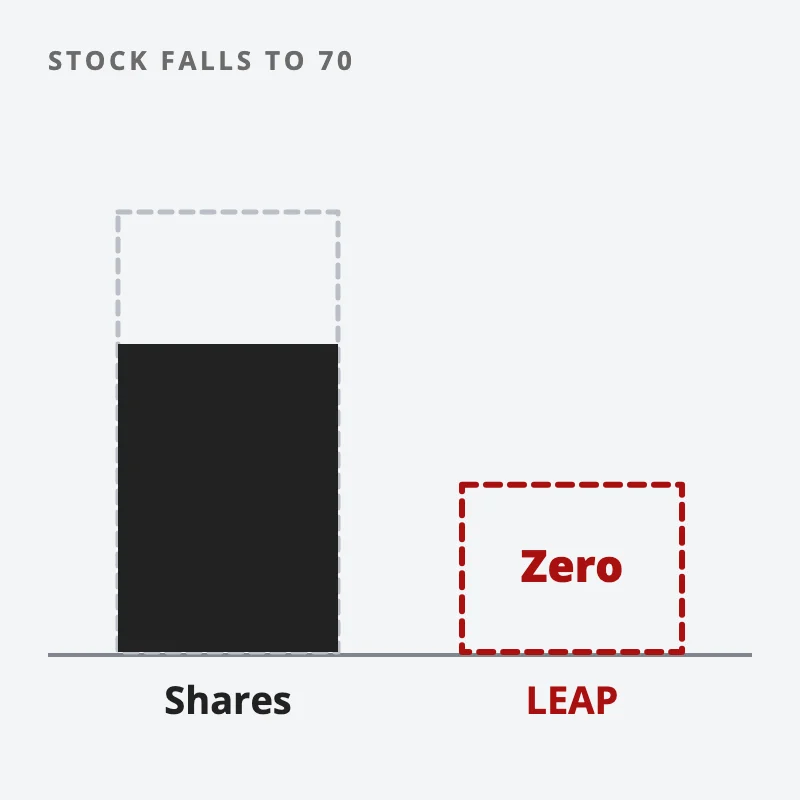
If the stock falls to 70, the bar for 100 shares stays mostly filled, while the smaller bar for the LEAP is empty and marked zero
A 30% fall in the stock wipes out the LEAP; the shareholder still owns the company.

Loan, Floor, Clock: what the time value really buys

So where does that USD 8 of time value go? I find it easiest to think of it as buying two things and costing a third.

  1. Loan. You get the move on USD 100 of stock while paying 38. In effect, you are deferring payment of the 70 strike for two years. Paying 8 to defer 70 for two years works out to roughly 5.7% a year, simple, on money you never see.
  2. Floor. Below 70, the shareholder keeps losing, and the LEAP holder has already lost all of the 38. So part of the 8 buys a floor under your losses. On the same exposure, you can never lose more than the premium.
  3. Clock. You pay for both with a date. If the move you expected arrives a month after expiry, it arrives for someone else.

Seen this way, the question becomes whether you would rather borrow to buy shares, or pay for a loan with a built-in floor and a deadline. That is a different choice from “cheap stock”.

What are the catches people miss?

The first catch is dividends. An option holder collects no dividend. The Options Industry Council says “A call holder is entitled to the dividend if the holder exercises the call prior to the ex-dividend date,” which means you have to give up the option to get the payment. On a stock that pays a few percent a year, that is a cost the table above leaves out.

The second catch is the roll. A LEAP has an end date, so holding the position for longer means selling it and buying a new one further out, and paying a fresh slice of time value each time. How a roll really works is in what happens when an option is assigned, rolled or expires.

The third catch is liquidity. A deep in-the-money strike far out in time can trade thinly, so check the gap between the bid and the ask on the strike you are looking at. The guide to options trading uses a simple screen: skip any strike with fewer than 1,000 contracts of open interest or under 300 traded a day.

The fourth catch is the one that blows up accounts, and it is size. Because one LEAP costs about 38% of the shares, it is tempting to put the full USD 10,000 into LEAPS instead. That buys roughly 2.6 contracts, the exposure of about 260 shares, and the 30% fall in the bottom row of the table wipes out all of it. The leverage was the attraction. It is also how a normal correction becomes a total loss.

Sizing a position as if it could go to zero is the same habit we teach for shares, forex and ETFs. Our free 15-Minute Swing Trader’s Checklist has the daily routine and the questions to ask before any trade. Get the free checklist →

How does a LEAP fit the 2-month rule in the options guide?

It does not, and the rule still stands.

In the options guide, one of the three rules is never to hold a bought option past 2 months, because time value bleeds. A LEAP is a bought option held for years, so the rule applies to it like any other bought option.

What the example does show is where the cost sits. In the deep in-the-money LEAP, 30 of the 38 is value the option already has, and 8 is time value that will be gone by expiry. So you can see the trade-off in plain numbers. You put up less cash than the shares and get a floor under the loss. In exchange you pay time value, give up the dividends, accept a date, and often a wide spread. The bleed on a LEAP is slower than on a short-dated option, and it is still a bleed.

So are deep ITM LEAPS just leveraged stock?

While they stay deep in the money, mostly yes. They track the shares closely, they need less cash, and you pay for the loan in time value instead of interest.

The difference shows up at the edges. A shareholder who is wrong can wait. A LEAP holder who is wrong has a date, and a 30% fall that a shareholder would sit through takes the LEAP to zero.

Whichever way you lean, the sizing habit is the same as for any bought option. Size it as if the whole premium could vanish, because in a bad two years it can. If the position only looks interesting when it is large, it is the leverage you want, rather than the company.

How much of the premium could you watch go to zero without changing your plans? And if the stock drifted sideways for two years, how would you feel about being down a fifth while the shareholder is flat? Those two answers will tell you more than the delta will.

FAQ

Are deep in-the-money LEAPS the same as owning stock?

Mostly, while they stay deep in the money, because they move nearly dollar for dollar with the shares. They differ in three ways: you pay time value, you collect no dividends, and the position ends at expiry.

What is the most you can lose on a LEAP?

You can lose the whole premium you paid. In the example, a fall from 100 to 70 or lower takes a USD 38 LEAP to zero, a 100% loss, while the shares are down 30%.

Do LEAPS holders receive dividends?

No. Only shareholders receive dividends, so a call holder has to exercise the option before the ex-dividend date to collect one, and that means giving up the option’s remaining time value.

How long do LEAPS last?

Equity LEAPS are listed with expiries of up to 39 months, according to Cboe, and expire in approximately two to three years from the date they are first listed.

Does Synapse Trading teach LEAPS?

No, we do not teach options at the moment. We teach end-of-day swing trading in shares, forex and ETFs, and the rule of sizing every position as if it could go to zero carries straight across.

Go deeper

This post covers one corner of options. If you would rather start with what we do teach, the free 15-Minute Swing Trader’s Checklist has the daily routine, the questions to ask before every trade, and the five rules that keep you in the game.


About the author. Spencer Li is The 15-Minute Trader and the founder of Synapse Trading. He is a Certified Financial Technician (CFTe) with 15+ years of trading, run from 70+ countries. He holds a B.Acc and B.BM from SMU. Every trade he takes is public, dated, losses left in. He teaches low-risk swing trading in 15 minutes a day, one system for any market.

Educational content only, not personalised financial advice. Trading carries risk, including loss of capital. Past performance is not indicative of future results. Synapse Trading is not licensed or regulated by MAS.
by Spencer Li
https://synapsetrading.com/wp-content/uploads/2026/10/deep-itm-leaps-vs-stock-card.webp 630 1200 Spencer Li https://synapsetrading.com/wp-content/uploads/2026/10/synapse-logo-horizontal-light.png Spencer Li2026-06-17 10:19:152026-10-02 18:51:15Are Deep ITM LEAPS Just Leveraged Stock?
Spencer Li

The Best Options Strategy for Beginners, and How to Test the One You Found

Markets & Products
Best beginner options strategy - options

Last updated: 26 August 2026 · By Spencer Li, CFTe


There is no single best options strategy. There is a best first one, though. For most beginners it is the plainest trade on the menu: buying one call or one put on a liquid stock, sized so that losing the whole premium is a loss you can shrug off.

The reason is simple. Its worst case is known before you click, and it teaches the 2 lessons that matter most in options, which are that a small move is not enough and that time costs money every day. The popular alternatives, covered calls, cash-secured puts and credit spreads, win more often. That is the trap. They collect many small premiums and carry a loss that can be several times bigger than anything they collected.

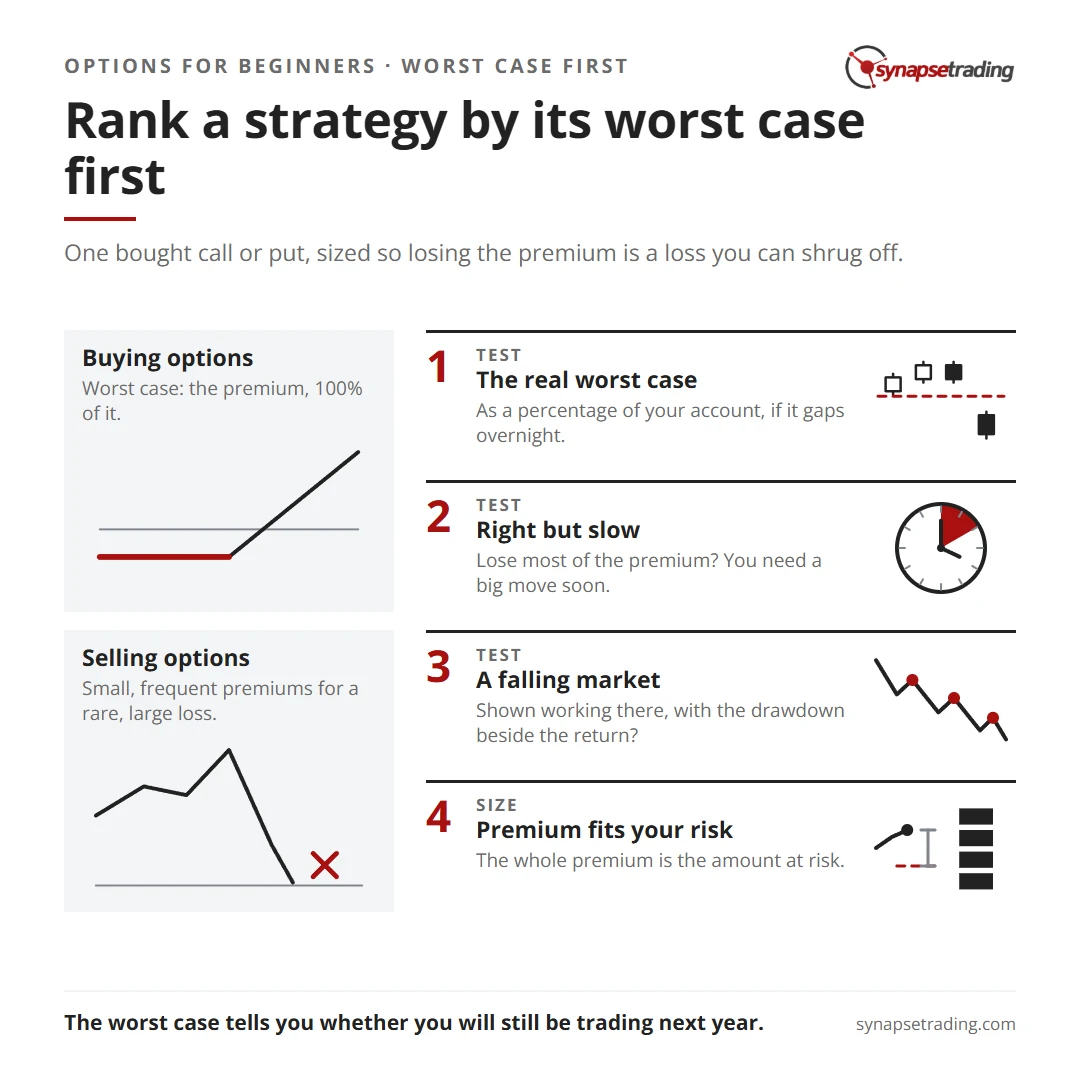
So a more useful ranking is by what each strategy can do to you. There is a simple filter for that, which I will call the Worst-Case-First Test, and it works on any strategy you found on YouTube, Reddit or a course page.

Rank a strategy by its worst case first. Summary card for the post: The Best Options Strategy for Beginners, and How to Test the One You Found.

Why does the first strategy matter more than the best one?

Think about how you learned to drive. Nobody starts on the expressway at night in the rain. You start in an empty car park, where a mistake costs a scraped bumper, because the point of the first few hours is to learn what the car does when you get it wrong.

The first options strategy does the same job. It is tuition. You will get trades wrong, so what matters is the price of each wrong trade while you learn.

With a bought call or put, a wrong trade costs the premium, and you decided the size of that premium in advance, sitting calmly at your desk, before the market had any say in it. With a sold put or a spread, a wrong trade costs whatever the market decides that week. Those are very different car parks.

How do the 4 beginner strategies compare when you rank them by worst case?

These are the 4 structures most beginners meet first. The ultimate guide to options trading goes through each one in more depth, so here they are ranked by the column most people read last.

StrategyHow often it tends to winWorst caseWhat it teachesWhat it hides
Buy a call or putless often than notthe premium, 100% of itdistance and deadline, cheaplynothing, the loss is visible every day
Covered calloftenthe full fall in the shares, less the premiumhow premium is pricedthe big up-move you sold away
Cash-secured putoftenthe full fall below the strike, less the premiumassignment, and what you really promisedhow fast “a stock I’d like to own” stops feeling that way
Credit spreadoftenthe gap between strikes, less the premiumdefined riska single loss can be several times the premium collected

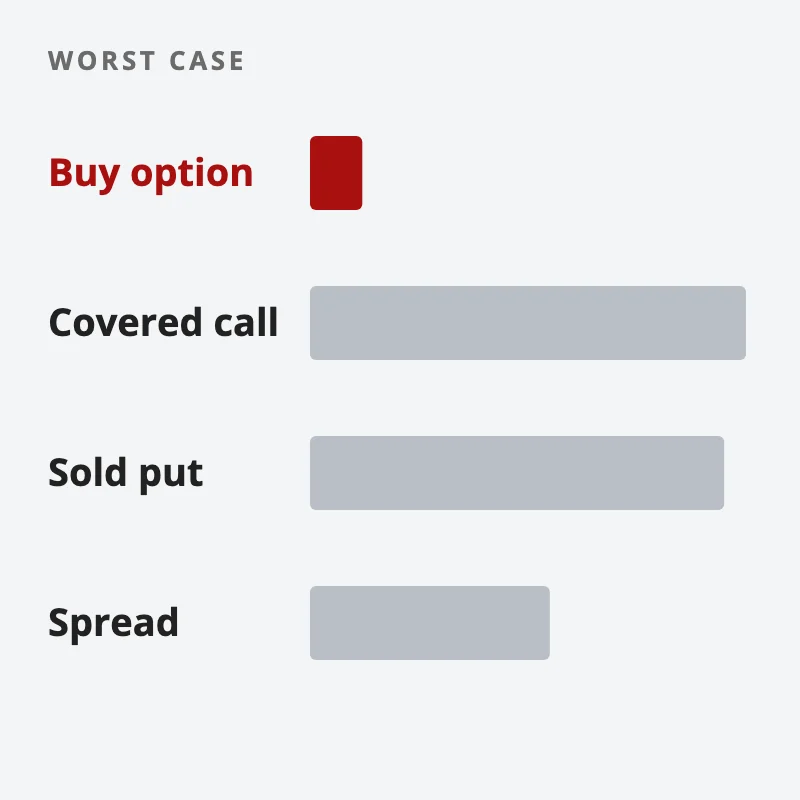
Do note the second column. The 3 strategies that win often are the 3 where the worst case is large, and that is no coincidence. You are paid a small, frequent premium to carry a rare, large loss.

Worst case of four beginner strategies as bars: buying an option has a short red bar; covered calls, sold puts and spreads have far longer ones
Rank an options strategy by its worst case first, not by how often it wins.

A retail backtest posted on r/options in September 2026 shows the pattern. The poster ran 42 option strategies on 3 big US index ETFs from 2020 to 2025, each held for 10 trading days. Selling cash-secured puts won 74.1% of the time, and its worst single trade lost about 20% of the ETF’s value. Bull put spreads, one type of credit spread, won 70.4% of the time and averaged slightly below zero after costs. (It is one person’s self-reported test, unchecked, so treat it as a picture of the shape and nothing more.)

Why do so many beginners start by selling options?

Because it feels good. Selling options gives you a stream of small wins, and small wins bring relief, which is a powerful thing for anyone who has just lost money buying cheap calls.

The trouble is that the feeling arrives months before the bill. A run of small wins says nothing yet about the one large loss the trade is carrying. In the backtest above, the bull put spread won 7 times in 10 and still averaged a small loss after costs.

The daily routine for the trades we do teach is in the free 15-Minute Swing Trader’s Checklist, at the end of this post.

How do you test the options strategy you found?

Here is the Worst-Case-First Test. It is 3 questions, asked in this order, and a strategy that cannot answer all 3 is not ready for real money.

  1. What is the worst case, as a percentage of my account, if the stock gaps through overnight? Not the stop you plan to use, because a gap skips the stop. The real number.
  2. What happens if I am right about the direction but slow? If the answer is “I lose most of the premium”, the strategy needs a big move soon, and you now know the bet you are making.
  3. Has anyone shown it working through a falling market, with the drawdown printed beside the return? A strategy that has only been shown in a rising market has only been shown in the easy part of the cycle.

So why put the worst case ahead of the win rate? Well, a win rate tells you how often you will feel good. The worst case tells you whether you will still be trading next year. Those are 2 different things, and the second one is the one you can actually plan for.

What does a sensible first options trade look like?

If the test points you to a single bought call or put, a few rails make it a much better lesson.

  • Only a liquid strike. The guide’s rule of thumb is to skip any strike with under 1,000 contracts of open interest or under 300 traded a day. A thin option is one you can buy and struggle to sell.
  • Not through earnings. The premium inflates before the news and deflates the moment it lands, so you can be right about the move and still lose on the price you paid.
  • Not too far out. The guide’s rails cap a bought option at about 2 months, because more time costs more premium and the extra weeks mostly add a slow bleed.
  • The premium fits the risk you already take per trade. The 2% money management rule for position sizing applies here, with the whole premium as the amount at risk. There is no level at which a stop gets you out cheaply.

Do note one thing I am not suggesting, which is a long stretch of paper trading. There is a separate post on why paper trading is a waste of time and what works better, and the same reasoning applies here. A small real position teaches you what fear and regret feel like. A simulator cannot.

And if the 3 Ds of a bought option, direction, distance and deadline, are still new to you, how call and put options make or lose money walks through them with a worked example.

So, back to the question people actually ask: which strategy should a beginner start with, and does the one I found actually work? The first answer is the boring one, a single bought option you can afford to lose. The second answer is whatever the Worst-Case-First Test says, and the third question is usually where the strategy you found goes quiet.

FAQ

What is the best options strategy for beginners?
For most beginners, a single bought call or put on a liquid stock, sized so the whole premium is an affordable loss. It has a known worst case and teaches distance and deadline before any uncapped risk comes in.

Is selling covered calls a good strategy for beginners?
It wins often, which makes it feel safe, but you keep the full downside of the shares and give away the big up-moves. It is better learned after you understand how options are priced.

Are cash-secured puts safe for beginners?
They are safer than selling puts without the cash, because you cannot be forced to borrow. The worst case is still owning 100 shares at the strike price after a large fall.

How much money do I need to start trading options?
Enough that the whole premium of one contract fits inside the amount you already risk per trade. For selling puts with cash set aside, you need 100 times the strike price for each contract.

How do I know if an options strategy actually works?
Ask for the worst case, what happens when you are right but slow, and a record through a falling market with the drawdown beside the return. A strategy shown without those 3 has only shown its good side.

Does Synapse Trading teach options?
No, not at the moment. We teach end-of-day swing trading in shares, forex and ETFs, and the sizing and chart-reading carry across to options unchanged.

Go deeper

The Worst-Case-First Test is the same habit that keeps a swing trader in the game, and the swing-trading side is the part we do teach. The free 15-Minute Swing Trader’s Checklist has the daily routine, the questions to ask before every trade, and the five rules that keep you in the game.


About the author. Spencer Li is The 15-Minute Trader and the founder of Synapse Trading. He is a Certified Financial Technician (CFTe) with 15+ years of trading, run from 70+ countries. He holds a B.Acc and B.BM from SMU. Every trade he takes is public, dated, losses left in. He teaches low-risk swing trading in 15 minutes a day, one system for any market.

Educational content only, not personalised financial advice. Trading carries risk, including loss of capital, and isn’t suitable for everyone. Past performance is not indicative of future results. Synapse Trading is not licensed or regulated by MAS.
by Spencer Li
https://synapsetrading.com/wp-content/uploads/2026/10/best-options-strategy-for-beginners-card.webp 630 1200 Spencer Li https://synapsetrading.com/wp-content/uploads/2026/10/synapse-logo-horizontal-light.png Spencer Li2026-05-21 14:39:542026-08-26 19:24:25The Best Options Strategy for Beginners, and How to Test the One You Found
Spencer Li

Singapore Stocks vs US Stocks: Which Should You Trade or Invest In?

Markets & Products
Singapore vs US stocks - investing

SGX or the US market, compared on what actually changes your result: liquidity, tax, currency and the clock

Published: 17 October 2026 · Last updated: 13 September 2026 · By Spencer Li, CFTe


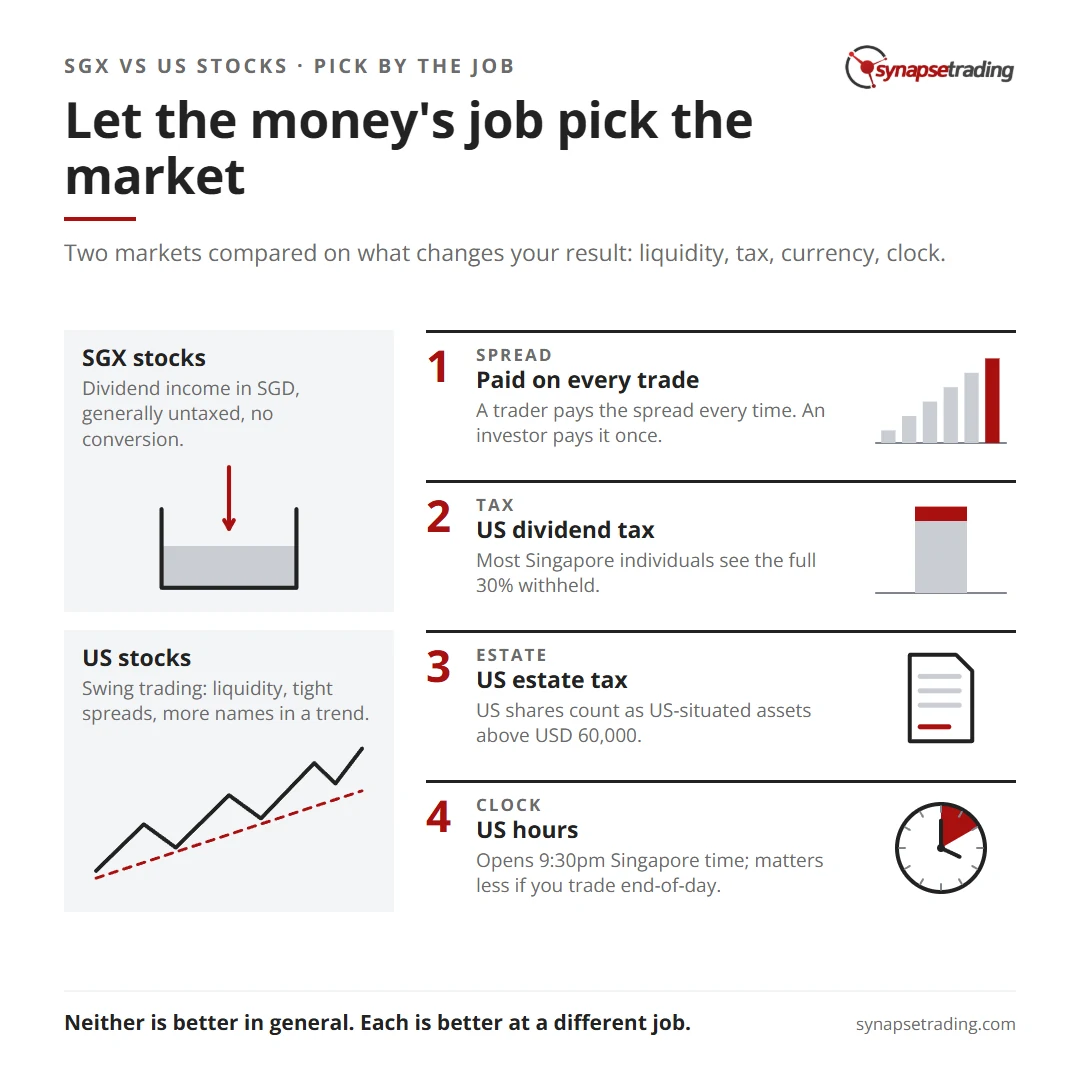
Should a Singapore investor buy Singapore stocks or US stocks? It depends on what the money is for. For swing trading, the US market usually wins, because it has far more liquid stocks, tighter spreads and more names in a clean trend on any given week. For income paid in Singapore dollars, SGX often wins, because one-tier dividends are generally not taxed, there is no currency to convert, and there is no US estate tax to think about.

Plenty of people hold both, and that is a sensible answer.

Each market wins somewhere. The sections below show where.

Let the money's job pick the market. Summary card for the post: Singapore Stocks vs US Stocks: Which Should You Trade or Invest In?.

Why did I plan to sell my Singapore stocks in 2017?

In May 2017 I wrote a post on this blog saying I was planning to cash out most of my Singapore portfolio. The STI had just pushed past 3,000, and the weekly chart told a different story. The index had spent about 7 years going sideways, which I called “somewhat unprecedented” at the time, while the US market kept creeping up.

I also wrote that trading volumes were waning, and that “it does seem like a dying market.”

Now, in fairness to SGX, a market I called dying has had a very good year. SGX reported that retail securities daily average value “surged 52% y-o-y in FY2026 to its highest level in 12 years.” So the picture in 2026 is livelier than it was in 2017. What has not changed is the gap in size and depth, and for a swing trader that gap is the whole story.

What is the real difference between SGX and US stocks?

Here are the two side by side, for someone based in Singapore.

SGX stocksUS stocks
CurrencySGD, no conversionUSD, converted both ways
Dividends to a Singapore individualOne-tier dividends generally not taxable (IRAS)30% withheld at source (IRS)
Gains on sellingGenerally not taxable in Singapore (IRAS)Not usually taxed by the US for a nonresident (IRS)
US estate taxNot a US assetUS shares count as US-situated assets above USD 60,000
Trading hoursSingapore daytime9:30pm to 4am Singapore time, or 10:30pm to 5am outside US daylight time
Smallest purchaseA board lot, now 10 shares or 1 share for higher-priced counters SGX has moved1 share
Where the shares sitYour own CDP account, or a broker’s custody accountA broker’s custody account

New to CDP and custody? How SGX trading works shows where your shares sit.

Why does liquidity matter more to a trader than to an investor?

So why does it matter so much how actively a stock trades? Because a trader pays the spread every time, and a long-term investor pays it once.

A typical liquidity floor for a daily swing scan is a stock that trades at least 1 million shares a day or USD 50 million in value, with a bid-ask spread of 0.1% of the price or less. A floor like that suits the US market. Apply it to SGX and the list gets much shorter.

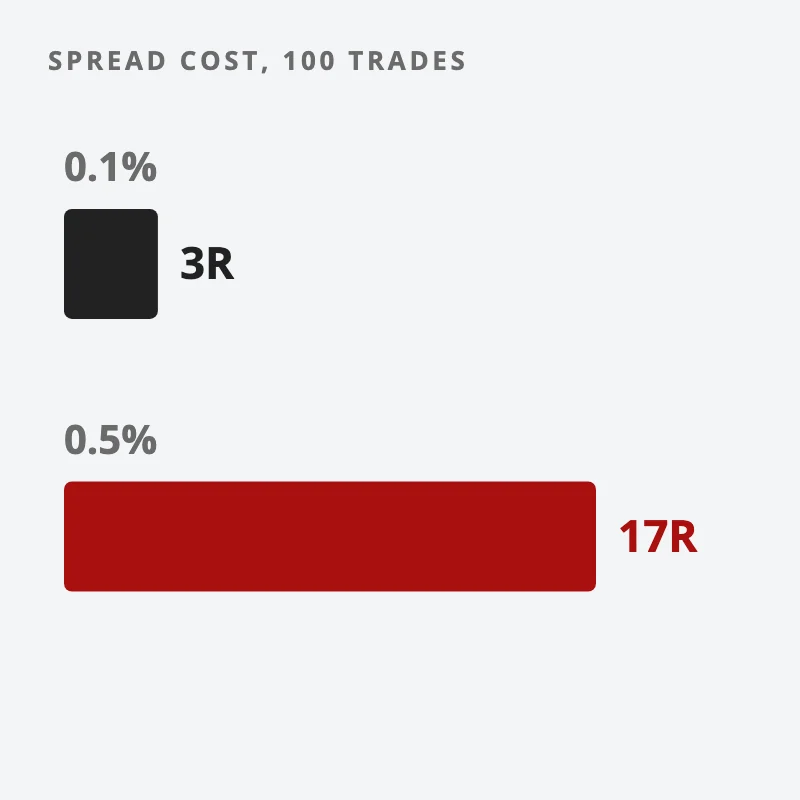
Here is what a wider spread does in practice. Say your stop sits 3% below your entry, which is a normal swing trade. You buy at the ask and sell at the bid, so a round trip costs you roughly one full spread.

  • With a 0.1% spread, that is about 0.03R a trade.
  • With a 0.5% spread, it is about 0.17R a trade.

Over 100 trades, that is roughly 3R against 17R. You pay it before the strategy has done a single thing for you. On a thin counter it gets worse, because when your stop triggers there are fewer buyers waiting and the fill can land well below your price. That hurts.

Two bars: over 100 trades a 0.1% spread costs about 3R, while a 0.5% spread costs about 17R
A trader pays the spread on every trade, so a wide one adds up fast.

Then there is choice. A trend follower needs stocks that are trending, and thousands of liquid names will throw up more of them in any week. Do note that this is a numbers game, and says nothing about any single SGX stock.

For an investor who buys a bank or a REIT and holds it for years, none of this matters much. A 0.5% spread paid once in ten years is a rounding error.

What do US stocks cost a Singapore investor that SGX stocks do not?

This is where SGX earns its place. The extra costs of owning US stocks from Singapore come in four kinds.

  1. Currency. Every Singapore dollar becomes a US dollar on the way in, and back again on the way out. The conversion spread does not appear on your commission line, but you pay it both ways.
  2. Dividend tax. The IRS tells US payers to “Withhold at 30% or lesser tax treaty rate” on dividends paid to nonresidents. Singapore has no income tax treaty with the US, so most Singapore individuals see the full 30%. On a hypothetical stock yielding 4%, that is 1.2% of your capital a year, gone at source. Compare that with IRAS, which lists “Dividends paid to shareholders by a Singapore resident company under the one-tier corporate tax system” as generally not taxable.
  3. Estate tax. This one is easy to miss. For nonresidents, the IRS counts “Stock of corporations organized in or under U.S. law” as a US-situated asset. An estate must file a US return “if the fair market value at death of the decedent’s U.S.-situated assets exceeds $60,000.” Check with a tax adviser for your own case, because the rules on what counts are detailed.
  4. The clock. US markets open at 9:30pm Singapore time while the US is on daylight time, and close at 4am. If you want to watch the open, that is your evening gone.

On gains, the two markets come out about even for most people. The IRS says “capital gain income is not usually taxable to a nonresident alien,” and IRAS says “Gains from the sale of a property, shares and financial instruments in Singapore are generally not taxable.” That word “generally” matters if you trade very actively, and Is trading income taxable in Singapore? goes through what IRAS actually looks at.

Two of the four frictions have a common workaround for long-term investors. A US index fund that is domiciled in Ireland, listed in London, generally gets a lower withholding rate on its US dividends and generally sits outside the US estate rules. How to choose an index ETF from Singapore explains the domicile question in full.

The clock matters far less if you trade end-of-day. You read the US close over breakfast in Singapore, place your orders, and get on with the day. About 15 minutes, none of it at 3am.

If you want that daily routine in one page, our free 15-Minute Swing Trader’s Checklist has it, along with the questions to ask before every trade. Get the free checklist →

So which one should you choose?

Start from the job the money has to do, and let that pick the market.

What the money is forThe usual fitWhy
Swing tradingUS stocks and US ETFsLiquidity, tight spreads, more names in a trend
Dividend income in SGDSGXOne-tier dividends generally untaxed, no currency risk, no US estate exposure
Long-term index investingOften Ireland-domiciled fundsLower dividend withholding, generally outside US estate rules
A small accountEitherSGX cut board lots from 5 October 2026, and US brokers sell single shares

That last row changed this year. SGX moved its board lot “From 100 units to 10 units for instruments priced above $10 and up to $100”, and to 1 unit above SGD 100, for the counters it has moved so far. A SGD 40 stock that used to need SGD 4,000 for one lot now needs SGD 400. So the old argument that SGX is too expensive for small accounts is much weaker than it was.

In May 2026 a trader asked on a Singapore investing forum whether anyone was slowly moving from their broker to CDP and Singapore assets, for estate planning reasons. It is a fair worry. The estate rule above is exactly why people ask it, and for a large US portfolio held for decades, moving some of it home is a reasonable answer.

If you do trade US stocks, the next question is which ones. How to find stocks to swing trade shows screener settings for the first cut.

Is one market better than the other?

Neither is better in general. Each is better at a different job.

SGX is a fine home for dividend income in your own currency. The US is where a swing trader finds the liquidity and the trends. The 2017 post was a trader’s view, and the 2026 numbers show it was too gloomy about SGX as a whole.

Two questions settle it for most people. Is this money for income you will spend in Singapore, or for a trading account that needs things to move? And how much of that 30% withholding are you paying today without noticing? Answer those, and the market picks itself. For the wider picture on trading shares, see the guide to stocks and CFDs trading.

FAQ

Is it better to invest in Singapore or US stocks?

It depends on the job. SGX suits dividend income in Singapore dollars, with one-tier dividends generally untaxed. US stocks suit swing trading and growth, with more liquidity, but they carry 30% dividend withholding, currency conversion and US estate tax exposure.

Do Singaporeans pay tax on US stock dividends?

Yes, at source. The IRS rule is to withhold 30% or a lower treaty rate on dividends paid to nonresidents, and Singapore individuals usually see the full 30%.

Do Singaporeans pay US estate tax on US shares?

They can. The IRS counts stock of US corporations as a US-situated asset, and an estate must file a US return if those assets exceed USD 60,000 at death. Check with a tax adviser for your own case.

What time does the US stock market open in Singapore?

At 9:30pm Singapore time during US daylight time, roughly March to November, and 10:30pm otherwise.

Are capital gains on SGX or US stocks taxed in Singapore?

Generally not, on either side. Very active trading can change the Singapore answer, so read the IRAS rules if you trade often.

Go deeper

Whichever market you pick, the habits are the same. The free 15-Minute Swing Trader’s Checklist has the daily routine, the questions to ask before every trade, and the five rules that protect your account.


About the author. Spencer Li is The 15-Minute Trader and the founder of Synapse Trading. He is a Certified Financial Technician (CFTe) with 15+ years of trading, run from 70+ countries. He holds a B.Acc and B.BM from SMU. Every trade he takes is public, dated, losses left in. He teaches low-risk swing trading in 15 minutes a day, one system for any market.

Educational content only, not personalised financial advice. Trading carries risk, including loss of capital. Past performance is not indicative of future results. Synapse Trading is not licensed or regulated by MAS.
by Spencer Li
https://synapsetrading.com/wp-content/uploads/2026/10/singapore-stocks-vs-us-stocks-card.webp 630 1200 Spencer Li https://synapsetrading.com/wp-content/uploads/2026/10/synapse-logo-horizontal-light.png Spencer Li2026-05-11 08:59:442026-09-13 12:20:24Singapore Stocks vs US Stocks: Which Should You Trade or Invest In?
Spencer Li

Penny Stocks vs Blue Chips: What the Low Price Really Costs You

Markets & Products
Penny stocks vs blue chips - stocks

Why a 1-cent share is not a cheap company, and the three hidden costs that make penny stocks harder to trade than they look

Published: 17 October 2026 · Last updated: 12 September 2026 · By Spencer Li, CFTe


What is the difference between penny stocks and blue chips? A penny stock is a share in a very small company that trades at a low price, often below 20 cents on SGX. A blue chip is a share in a large, established company that leads its industry and has a record of steady dividends. The low price is what draws people to penny stocks. It is also the least useful thing about them.

So which should you trade? For most people starting out, blue chips, or at least large and liquid stocks. A penny stock costs more to trade per dollar, moves on thin volume, and comes with far less information. Those three costs (the price step, thin trading and missing information) are invisible when you look at the share price. They show up in your results.

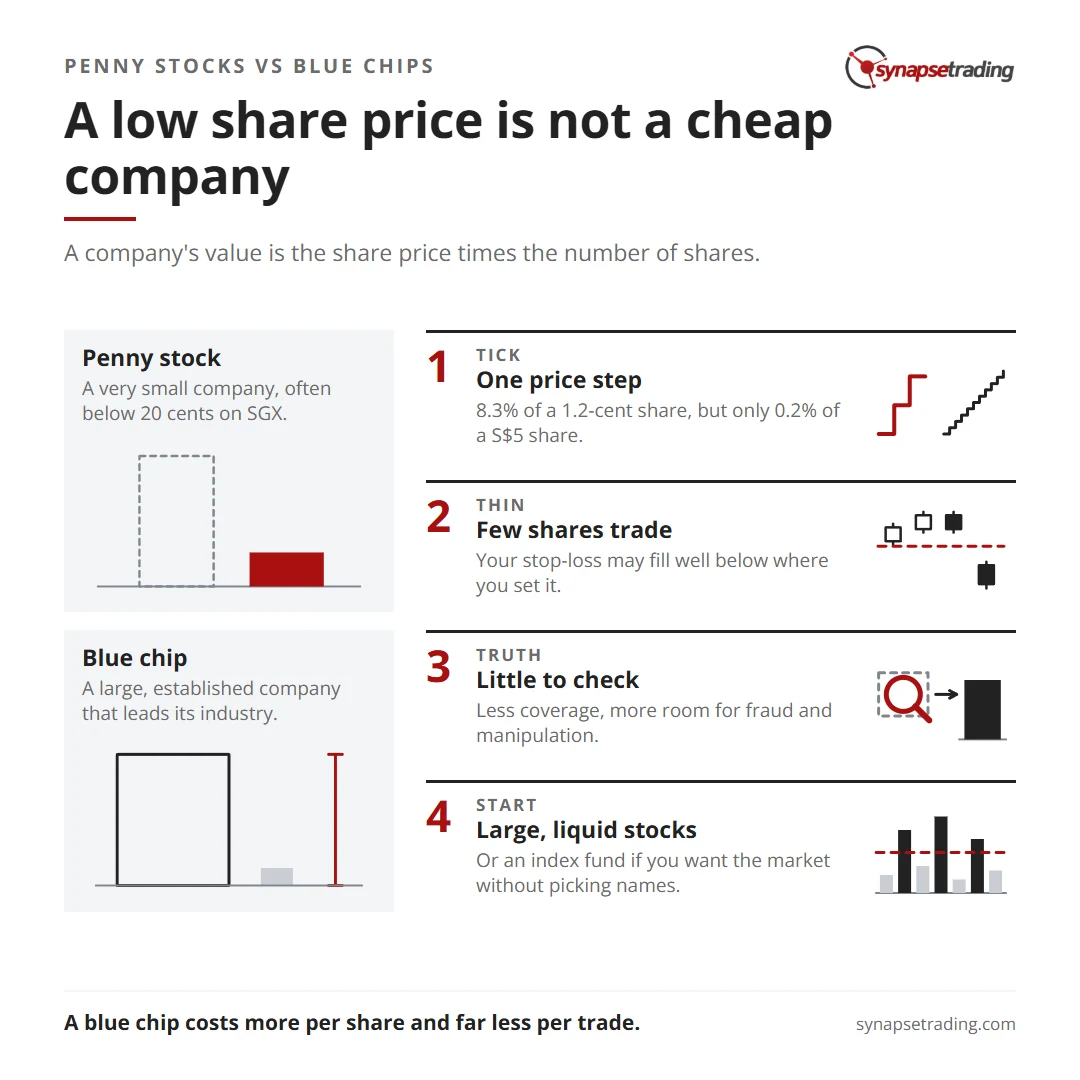
A low share price is not a cheap company. Summary card for the post: Penny Stocks vs Blue Chips: What the Low Price Really Costs You.

Is a low share price the same as a cheap stock?

No, and this is the mistake that starts most penny-stock stories.

The share price tells you what one share costs. It tells you nothing about what the company is worth. For that, you multiply the price by the number of shares.

Take two hypothetical companies. Company A has 1 billion shares at S$0.012, so the whole company is valued at S$12 million. Company B has 100 million shares at S$5, so it is valued at S$500 million. A is the “cheaper” share. B is the bigger, and often the sturdier, business.

The US Securities and Exchange Commission (SEC) uses size, not price, for its definition. It says the term ‘microcap stock’ (sometimes referred to as ‘penny stock’) “applies to companies with low or micro market capitalizations”, which it puts at less than about US$250 to US$300 million. A trader on Reddit made the same point about a US share: “Yes, it’s under $5, but with a $2B cap on Nasdaq.” A low price on a big company is just a low price.

What are the hidden costs of a penny stock?

There are three. Each is a cost you pay without seeing a fee for it.

Tick: how much does one price step cost?

Every exchange sets a minimum step a price can move. On SGX, Rule 8.3.3 says a share below 20 cents moves in steps of S$0.001, and a share at S$1 or more moves in steps of S$0.01.

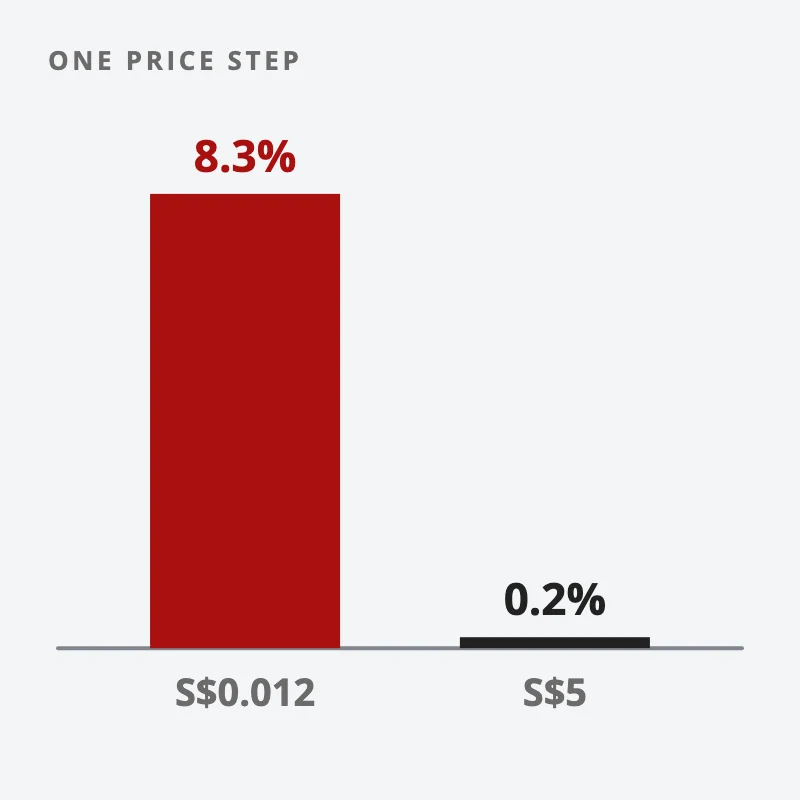
Now do the sum. On a S$0.012 share, one step is 0.001 ÷ 0.012, which is 8.3% of the price. On a S$5 share, one step is 0.01 ÷ 5, which is 0.2%.

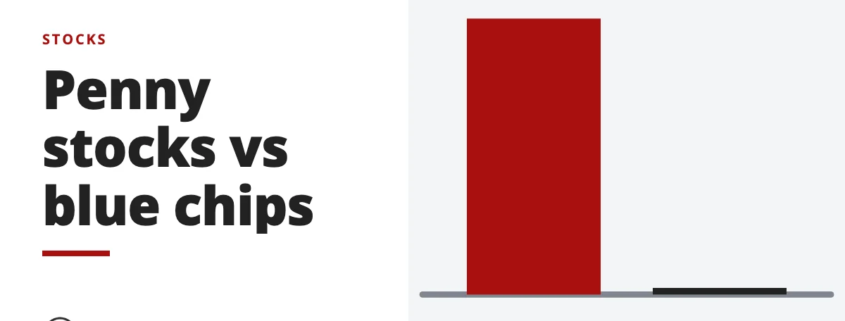
So if the gap between the best buyer and the best seller is a single step, buying a 1.2-cent share and selling it straight back costs you 8.3% before the price has moved at all. On the S$5 blue chip, the same round trip costs 0.2%. That is a forty-fold difference in friction, on the same idea.

Two bars to scale: one SGX price step is 8.3% of a S$0.012 share but only 0.2% of a S$5 share
One price step costs 8.3% of a 1.2-cent share but only 0.2% of a S$5 share.

Thin: what happens when few shares trade?

Thin means little volume. The SEC warns that with low volumes in microcaps, “any size trade can have a large percentage impact on the price.”

That cuts both ways. A small buy order can lift the price, which is why penny charts look so exciting. A small sell order can drop it, which is why your stop-loss may fill well below where you set it. When you want to get out, there may simply be no one on the other side at your price.

This is why a sensible product checklist has a line called “Not too wild”: if you swing trade, avoid a penny stock that swings 10 to 20 percent in a day. A move like that is not a signal you can plan around. It is noise with a big range. More on how volatility differs from real risk is in risk vs volatility.

Truth: how much do you actually know?

Large companies have analysts, news coverage and investors reading every filing. Small ones often have none of that. The SEC lists the lack of public information as the first risk of microcaps, and calls them “susceptible to fraud and manipulation.”

So a penny stock gives you less to check and more room for someone to tell you a story. That is where pump-and-dump schemes live.

How do penny stocks and blue chips compare side by side?

Penny stockBlue chip
Typical price on SGXBelow S$0.20S$1 and above
Company sizeSmall, often under a few hundred millionLarge, industry-leading
One price step, as % of priceSeveral percentA fraction of a percent
Daily volumeOften thin, can vanishUsually deep
Information availableLittle coverage, fewer filings readAnalysts, news, long record
DividendsRareOften steady, by definition
Main riskGaps, slippage, manipulationLong, slow falls you sit through

Read the last row carefully. Blue chips carry risk too. It is a different kind.

But aren’t penny stocks where the big winners come from?

A trader asked it honestly in 2021: “I would have more fun playing penny stocks. Is this dangerous?”

Here is the fair answer. Some of the best stocks in history did start small. Peter Lynch made his name partly by finding small, fast-growing companies before the crowd did. And yet William O’Neil, who studied the biggest winners in the US market, wrote: “I prefer not to buy any common stock that sells for below $15 per share.” His reason was that most of the big winners he studied broke out from prices well above that, between $30 and $50.

So both are true. Small companies can grow into large ones. But by the time a small company is proving itself, it is usually no longer a penny stock, and the move is easier to trade on a liquid chart. Hunting for the next winner at one cent mostly means paying the tick, volume and information costs on hundreds of companies that never grow.

And blue chips are not safe just because they are big. A large company can fall for months while holders tell themselves it will come back. The difference is that you can get out of a liquid blue chip at a price close to your stop. On a penny stock, you may not get out at all.

If you want the routine we use to pick liquid stocks and size them so one bad trade stays small, our free 15-Minute Swing Trader’s Checklist lays it out. Get the free checklist →

What should a beginner trade instead?

Start with large, liquid stocks, or an index fund if you want the market without picking names. The guide to which products and markets to start with runs through a checklist for any product: good liquidity, decent movement, low costs and free data.

Then build the habit of filtering. Our post on how to find stocks to swing trade shows how to screen for volume and trend before you look at a single chart. And whatever you pick, cap the size. The guide to how much of your portfolio to put in one stock shows why no single position should be able to sink the account.

The wider picture, from share basics to CFDs, is in the ultimate guide to stocks and CFDs trading.

So are penny stocks worth it?

For most traders, they are a poor place to start. The low price feels like an opportunity, but you pay for it in friction, gaps and missing facts. A blue chip costs more per share and far less per trade.

Next time a 1-cent share catches your eye, try the three questions. What does one tick cost me? Who will buy it from me when I want out? And what do I actually know about this company that I could check today?

FAQ

What is a penny stock in Singapore?

There is no single official cut-off, but traders usually mean a share trading below 20 cents on SGX, in a small company. Below 20 cents, SGX Rule 8.3.3 sets the minimum price step at S$0.001.

What is a blue chip stock?

A blue chip is a share in a large, established company that leads its industry and has a record of stable dividends.

Are penny stocks riskier than blue chips?

Usually, yes. They have bigger price steps relative to their price, thinner trading and less public information, which makes them easier to manipulate and harder to exit.

Can a blue chip stock lose money?

Yes. Large companies can fall a long way and stay down for years. The difference is that a liquid blue chip lets you exit close to your planned price, which a thin penny stock often does not.

Is a cheap share a good deal?

Only if the company is cheap too. The company’s value is the share price times the number of shares, so a 1-cent share can belong to a company worth less than one at S$5.

Go deeper

Choosing what to trade is the first filter. The free 15-Minute Swing Trader’s Checklist covers the rest: the daily scan, the questions to ask before every trade, and the five rules that keep you in the game.


About the author. Spencer Li is The 15-Minute Trader and the founder of Synapse Trading. He is a Certified Financial Technician (CFTe) with 15+ years of trading, run from 70+ countries. He holds a B.Acc and B.BM from SMU. Every trade he takes is public, dated, losses left in. He teaches low-risk swing trading in 15 minutes a day, one system for any market.

Educational content only, not personalised financial advice. Trading carries risk, including loss of capital. Past performance is not indicative of future results. Synapse Trading is not licensed or regulated by MAS.
by Spencer Li
https://synapsetrading.com/wp-content/uploads/2026/10/penny-stocks-vs-blue-chips-card.webp 630 1200 Spencer Li https://synapsetrading.com/wp-content/uploads/2026/10/synapse-logo-horizontal-light.png Spencer Li2026-05-05 20:53:522026-10-22 12:59:07Penny Stocks vs Blue Chips: What the Low Price Really Costs You
Spencer Li

Options Greeks Explained: What Each Number Actually Tells You

Markets & Products
The options Greeks - options

Delta, theta, vega and gamma in plain English, plus what open interest and gamma exposure can and cannot tell you.

Last updated: 3 July 2026 · By Spencer Li, CFTe


Someone on r/options asked a question recently that sounds almost too simple: does theta decay while the market is closed? It is a good question, because it shows where most people get stuck with the Greeks: we learn the definitions and still cannot say what the number on the screen means for the trade in front of us.

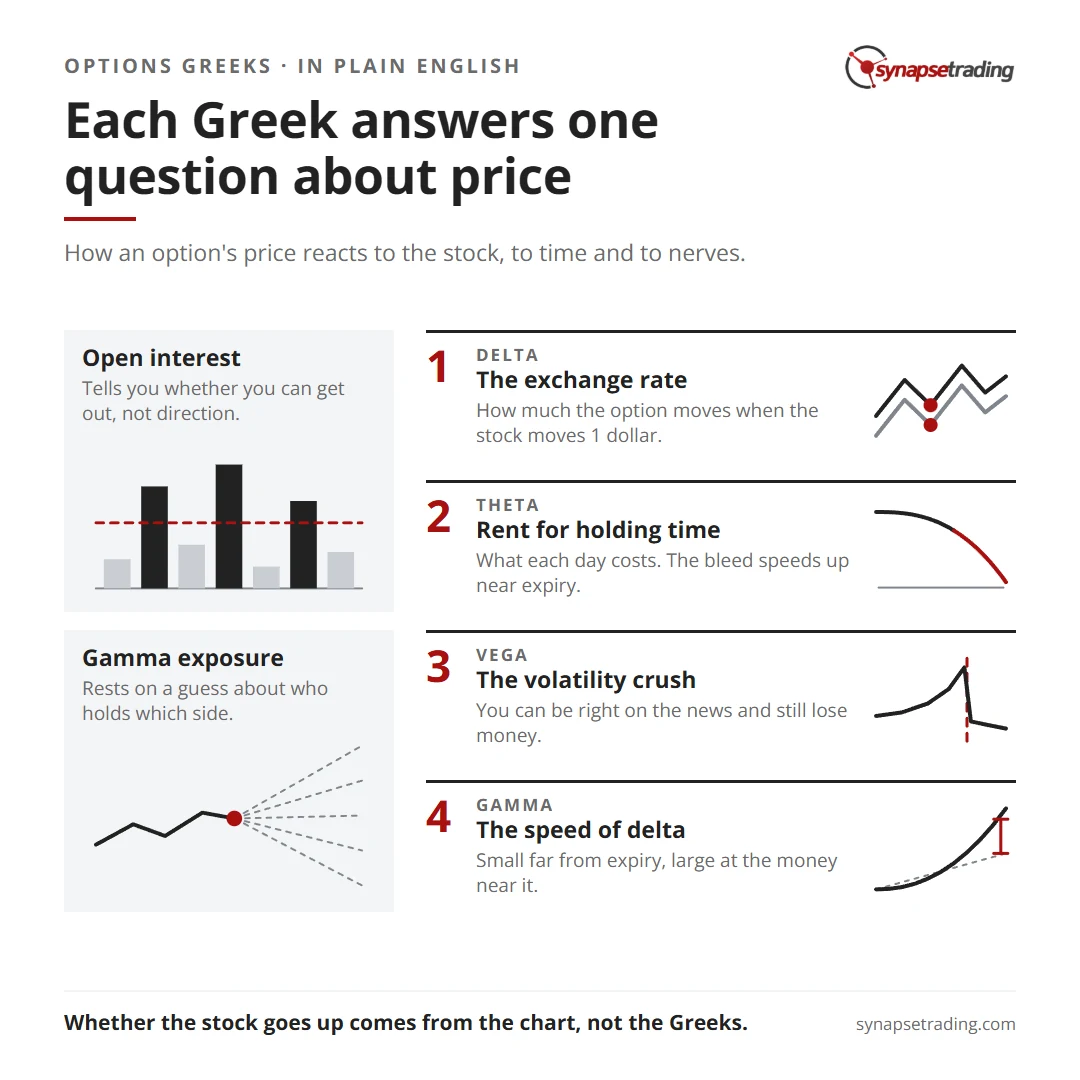
So here is the short answer first. The 4 Greeks each answer one plain question about an option’s price. Delta asks how much the option moves when the stock moves 1 dollar. Theta asks how much it loses each day if nothing happens. Vega asks how much it changes when the market gets more or less nervous. Gamma asks how fast delta itself changes. Open interest is a different animal. It counts how many contracts are still open at a strike, which tells you whether you can get out, and almost nothing about which way anyone is betting. Gamma exposure, or GEX, is an estimate built on top of open interest, and it rests on a guess about who holds which side.

Do note that we do not teach options at Synapse Trading, and my own trading is end-of-day swing trading in shares, forex and ETFs. This post hangs off our ultimate guide to options trading, because the same 4 letters keep turning up in the questions people send me.

Each Greek answers one question about price. Summary card for the post: Options Greeks Explained: What Each Number Actually Tells You.

What does delta tell me about my option?

Delta is the exchange rate between the stock and the option.

Take a hypothetical stock at 100, with round numbers. An at-the-money 100 call costs 3.00 a share and has a delta of about 0.50. If the stock rises to 101, the option rises by roughly half that, to about 3.50. One contract covers 100 shares, so for now it behaves a bit like owning 50 shares.

Delta does a second job too, as a rough read of the market’s odds that the option finishes in the money, so a call with a delta of 0.10 is priced as something like a 1-in-10 shot. That is worth sitting with for a moment. The cheap option that looks like a bargain is usually cheap for a reason.

At the extremes, a deep in-the-money call moves almost dollar for dollar with the shares, and a far out-of-the-money call sits so close to 0 that the stock can rally and the option barely notices.

Why does my option lose money when the stock does nothing?

That is theta, the rent you pay for holding time.

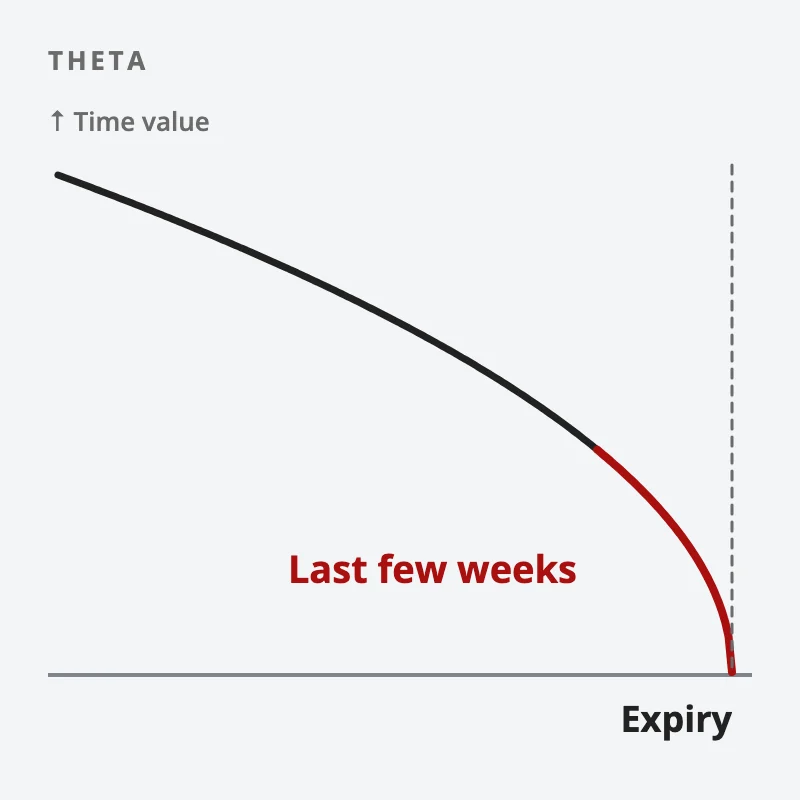
A bought option carries time value, which is the market’s price for the chance that something big happens before expiry. Every day that passes without the big thing, a slice of that time value disappears. A theta of minus 0.05 means the option loses about 5 cents a share per day, all else equal. It sounds small. Over a month of sideways drift it is the whole trade.

And the bleed is not even. It speeds up in the last few weeks, which is why short-dated options feel fine on Monday and hopeless by Thursday. This is the slow-motion version of the regret most option buyers know well: right about the stock, wrong about the calendar.

An option's time value falling along a curve that is gentle at first and drops steeply in red in the last few weeks before expiry
Theta drains time value slowly at first, then fast in the last few weeks.

So, back to the r/options question about the weekend. Time does pass while the market is shut, and a model that counts calendar days keeps charging theta for Saturday and Sunday. But option prices usually fall by less over a weekend than that theta number suggests. Kris Abdelmessih, who writes the Moontower newsletter on options, puts it this way: “The market’s pricing behavior strongly suggests that it believes time passes more slowly over a weekend.” So the weekend does cost you something, and usually less than Friday’s theta implies.

Why can I be right on the news and still lose money?

That is vega, and it catches more beginners than any other letter.

Option prices carry the market’s nervousness inside them, called implied volatility. Before earnings, or in a panic, nervousness rises and every option gets more expensive. The moment the news lands, the nervousness drains out and prices drop, even if the stock moved the way you expected. Traders call it the volatility crush.

Say you bought a call the day before earnings, the company beats, the stock rises 3%, and the next morning the call is worth less than you paid. Nothing went wrong with your read. You paid for a storm, and the storm turned out smaller than the price assumed.

A rough rule of thumb for the size of that storm: the VIX divided by 16 is about the S&P 500’s expected daily range in percent. With the VIX at 32, the market is pricing about 2% a day. Buy options after the VIX has already spiked and you are paying peak prices for a panic that may be ending.

What does gamma do, and why does it matter near expiry?

Gamma is the speed of delta. It tells you how much delta changes when the stock moves 1 dollar.

Far from expiry, gamma is low and the option’s behaviour changes slowly, but close to expiry, gamma at the money gets very large. A cheap option can flip from a delta of 0.10 to 0.60 on one decent move, and back to 0.10 on the next. That is what makes a near-expiry option behave like a lottery ticket, in both directions, and it is the reason same-day options feel so wild.

The 4 Greeks in one table

GreekThe question it answersA typical readingWhen it bites hardest
DeltaHow much does the option move per 1 dollar in the stock?0.50 at the money, near 1 deep in the moneyAlways, it is your direction exposure
ThetaWhat does one more day cost me?Minus 0.05 means about 5 cents a share a dayThe last few weeks before expiry
VegaWhat happens if the market gets calmer or more nervous?Prices inflate before news and deflate afterAround earnings, central-bank days and panics
GammaHow fast does delta itself change?Small far from expiry, large at the money near itThe final days, and the final hours

If you would rather start with the chart side of trading, which is the part we do teach, the free 15-Minute Swing Trader’s Checklist has the questions to ask before every trade.

What does open interest tell me, and what does it not?

Open interest is the number of contracts at a strike that are still open. Volume is the number traded today. They answer different questions.

Many people read a big open interest number as a bet: “there are 40,000 calls open at the 110 strike, so the smart money expects 110.” But every contract has a buyer and a seller. Those 40,000 calls are 40,000 long positions and 40,000 short positions at the same time, and the number on the screen does not say which side is the informed one, or whether either is.

What open interest does tell you, reliably, is whether you can get out. A strike with a few dozen contracts open can look fine on the screen and then fill you badly when you try to close. The rule of thumb in our options guide is to skip any strike with fewer than 1,000 contracts of open interest or under 300 traded a day. A thin option is one you can get into and not out of.

What is gamma exposure (GEX), and how far can I trust it?

Gamma exposure is an estimate of how much gamma the market makers are carrying across all strikes.

The idea goes like this. Market makers hedge the options they hold by buying and selling the stock or the index. When they are net long gamma, their hedging leans against the move: they sell into rallies and buy into dips, so the market tends to be calmer and can get “pinned” near big strikes. When they are net short gamma, their hedging adds to the move, so swings get bigger.

The weak link is the input. Open interest does not say which side the market makers are on, so every GEX model has to assume it. Change the assumption and the chart changes. The people measuring the effect are not neutral either. Cboe, which lists the products, studied same-day S&P 500 options in 2023 and found the market makers’ “actual net exposure” was “fairly minimal”, a hedging flow of 0.04% to 0.17% of a day’s S&P futures trading. Cboe earns from those options, and the firms selling gamma dashboards earn from the opposite story. We could not find an independent study that settles it.

Personally, I would read GEX the way I read a weather report. It can hint at how choppy a session might be, but it says nothing about which way to trade.

How do the numbers fit together when I look at a real options chain?

Put the pieces in order and the chain stops being a wall of numbers. I call it the 4-question chain read.

  1. Can I get out? Open interest and daily volume. Below the liquidity floor, stop here.
  2. What am I paying for? Vega and implied volatility, and whether a big event is already in the price.
  3. What does the clock cost me? Theta, and how many days of nothing the trade can survive.
  4. How big a move do I need? Delta and gamma, and whether the move you expect is large and fast enough to beat the price.

None of the 4 questions asks whether the stock will go up. That one comes from the chart, and it is the same question whether you trade shares or options. The Greeks only tell you what the option will charge you for being right slowly, or right about the wrong thing.

So the next time a chain looks like noise, it helps to ask which of the 4 you are actually stuck on.

FAQ

Which option Greek matters most for a beginner?
Delta and theta matter most on your first day. Delta tells you how much the option moves with the stock, and theta tells you what each day of waiting costs. Vega and gamma matter more around news and near expiry.

Does theta decay over the weekend?
Yes, time keeps passing when the market is closed, so time value keeps shrinking. In practice, option prices usually fall by less over a weekend than a calendar-day theta number suggests.

Is high open interest bullish?
No, open interest alone says nothing about direction. Every open contract has a buyer and a seller, so a large number shows activity and liquidity at a strike and leaves open which side will be right.

What is gamma exposure in simple terms?
Gamma exposure is an estimate of how much the market makers’ hedging could calm or speed up price moves. It depends on an assumption about which side of each contract the market makers hold, which open interest does not show.

Go deeper

This post covers the numbers. If you would rather start with what we do teach, the free 15-Minute Swing Trader’s Checklist has the daily routine, the questions to ask before every trade, and the five rules that keep you in the game.


About the author. Spencer Li is The 15-Minute Trader and the founder of Synapse Trading. He is a Certified Financial Technician (CFTe) with 15+ years of trading, run from 70+ countries. He holds a B.Acc and B.BM from SMU. Every trade he takes is public, dated, losses left in. He teaches low-risk swing trading in 15 minutes a day, one system for any market.

Educational content only, not personalised financial advice. Trading carries risk, including loss of capital, and isn’t suitable for everyone. Past performance is not indicative of future results. Synapse Trading is not licensed or regulated by MAS.
by Spencer Li
https://synapsetrading.com/wp-content/uploads/2026/10/options-greeks-explained-card.webp 630 1200 Spencer Li https://synapsetrading.com/wp-content/uploads/2026/10/synapse-logo-horizontal-light.png Spencer Li2026-04-29 21:40:362026-07-03 21:39:23Options Greeks Explained: What Each Number Actually Tells You
Page 3 of 14‹12345›»

Free checklist

The 15-Minute Swing Trader’s Checklist

The daily and weekly routine I use to find, manage and review trades in about 15 minutes a day, trading since 2007.

Get the free checklist

Topics

  • Trading foundations
  • Technical analysis
  • Strategies and systems
  • Risk and money
  • Trading psychology
  • Markets and products

Synapse Trading

Swing trading for busy professionals, in 15 minutes a day.

Start free

Learn

  • Start here
  • Free trading guides
  • Blog
  • Tools and resources

Programs

  • Trading Mastery Program
  • Daily trading signals
  • Student results
  • Public trade log

Company

  • About
  • Contact me
  • Partnerships
  • Disclaimer
  • Privacy policy
  • Terms & Conditions

Synapse Trading Pte Ltd
Registration No. 201316168H
WhatsApp +65-8897-1204
info@synapsetrading.com

Contact Us

Synapse Trading Pte Ltd
Registration No. 201316168H

Whatsapp: +65-8897-1204
Telegram: @iamrecneps
Email: info@synapsetrading.com

Links

Disclaimer
Privacy policy
Terms & Conditions
Contact us
Partnerships

© 2012-2026 Synapse Trading | All rights reserved. Educational content only, not personalised financial advice. Trading carries risk, including loss of capital. Past performance is not indicative of future results. Synapse Trading is not licensed or regulated by MAS.
  • Link to Facebook
  • Link to X
  • Link to Instagram
  • Link to Youtube
  • Link to LinkedIn
  • Link to Mail
Scroll to top Scroll to top Scroll to top