• Link to Facebook
  • Link to X
  • Link to Instagram
  • Link to Youtube
  • Link to LinkedIn
  • Link to Mail
Free PDF: The 15-Minute Swing Trader's Checklist, the daily routine of a trader since 2007
Synapse Trading
  • Mentoring
    • Trading Mastery Program
    • All mentoring options
  • Signals
    • Daily trading signals
    • Signals trade log
  • Results
    • Student results and testimonials
    • Public trade log, losses left in
  • Free guides
    • Start here
    • Trading foundations
    • Technical analysis
    • Strategies and systems
    • Risk and money
    • Trading psychology
    • Markets and products
    • Free trading guides
    • Tools and resources
    • Blog
  • About
    • My background
    • My trading journey
    • Media and interviews
    • Travel log
  • Contact
    • Contact me
    • Partnerships
  • Start free
  • Click to open the search input field Click to open the search input field Search
  • Menu Menu

Forex, stocks, crypto, options and commodities – what you trade, as opposed to how.

Spencer Li

How to Spot a Pump-and-Dump Before You Buy

Markets & Products
Spot a pump-and-dump - stocks

The four checks to run on any stock tip from a chat group, and two real Singapore cases that show how the trap is built

Published: 17 October 2026 · Last updated: 29 September 2026 · By Spencer Li, CFTe


A pump-and-dump is a scheme where someone buys a cheap, thinly traded stock, talks it up to a crowd, and sells into the buying they created. The price jumps, the promoters cash out, and the crowd is left holding shares that fall back to where they started.

So how do you spot one? You check four things before you buy: who is giving you the tip, what the story rests on, how small and thin the stock is, and who would be selling to you. If the tip comes from a stranger online, rests on a story you cannot check, sits on a tiny stock, and comes from someone who already owns it, walk away. That is the whole method. The rest of this post shows why each check matters, using two cases Singapore’s regulator has published.
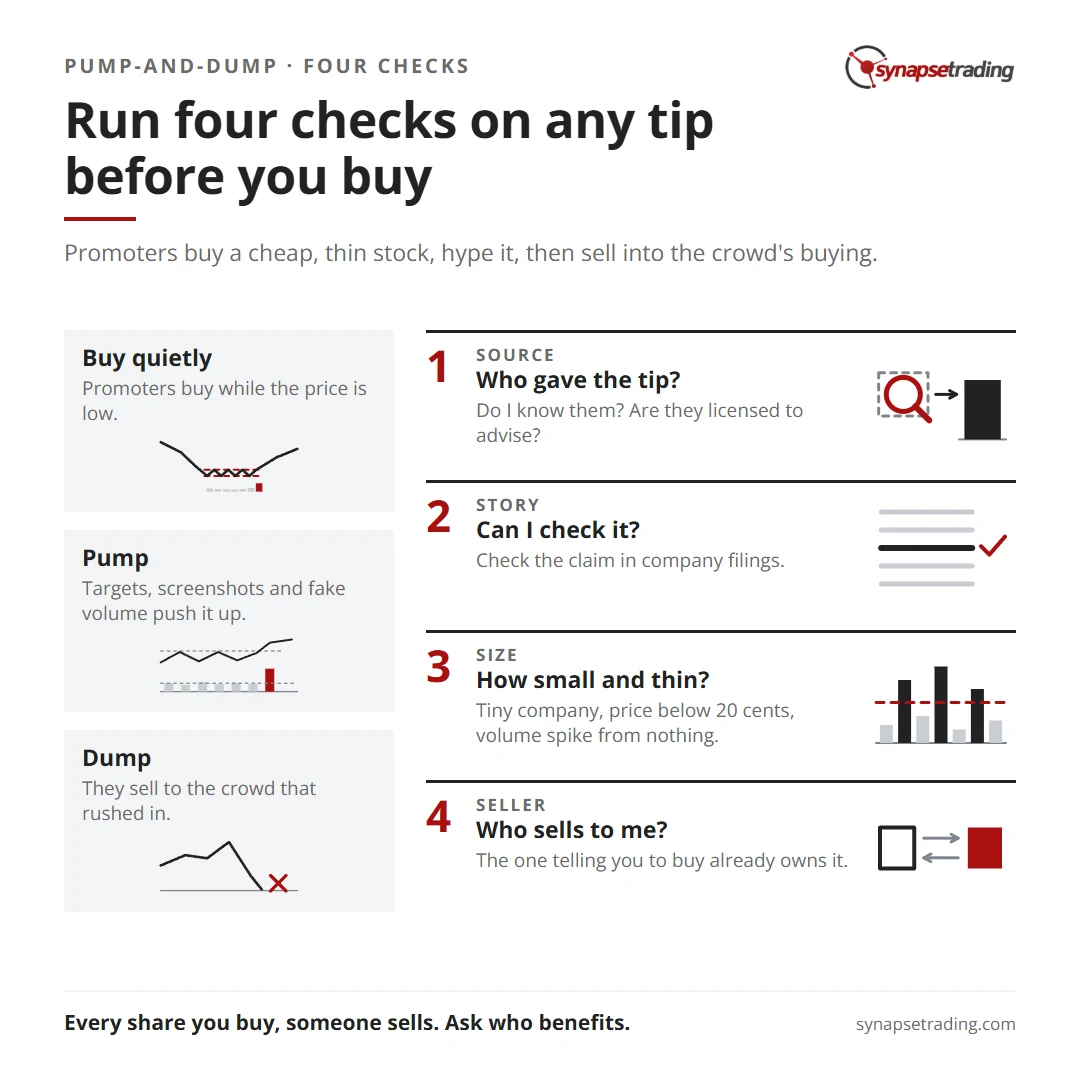
Run four checks on any tip before you buy. Summary card for the post: How to Spot a Pump-and-Dump Before You Buy.

How does a pump-and-dump actually work?

It runs in three moves. First, the promoters buy quietly while the price is low. Then they pump: they post targets, screenshots and “I just bought more” messages to a group. Finally, they dump, selling their shares to the people who rushed in.

The Singapore Police Force describes the pump as “spreading false positive news about the company, or creating an appearance of trading activity”. Both halves matter. One is a story, and the other is fake volume that makes the story look real.

And the scheme works because the crowd does the heavy lifting. The promoters only need enough buyers to push a thin stock up for a few days. After that, every new buyer is their exit.
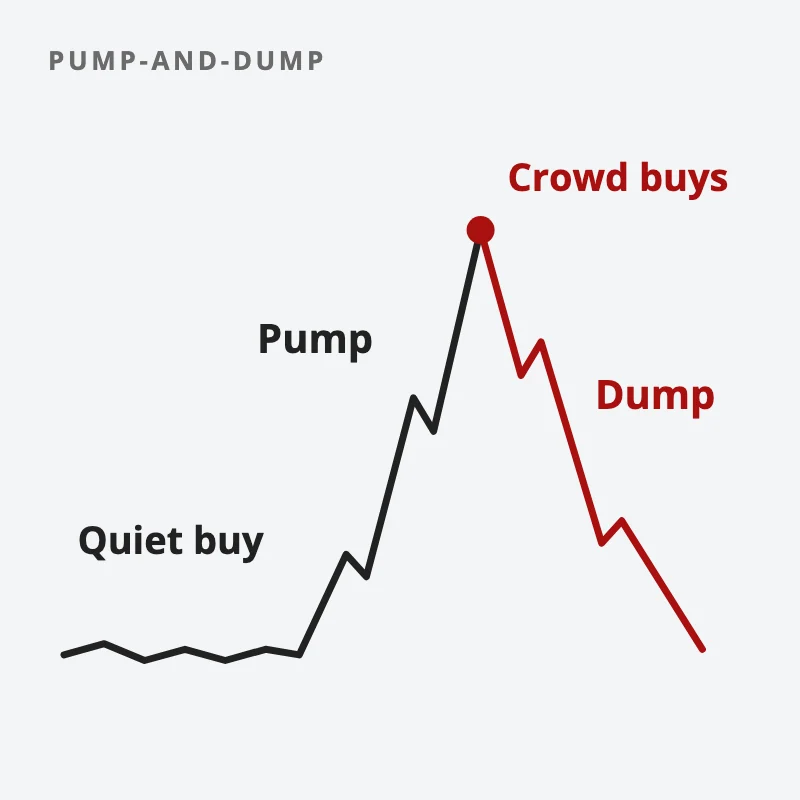
A price line that stays flat while promoters buy quietly, jumps during the pump, peaks as the crowd buys, then falls back to where it began
Promoters buy quietly, pump the price, then sell to the crowd that rushes in.

What did the Singapore cases look like?

The Monetary Authority of Singapore (MAS) featured two in its enforcement report for July 2023 to December 2024.

In the first, a member of two Telegram stock groups with about 2,955 members made false statements on 10 occasions between April and November 2020. MAS says his statements “included overstating his target sell price for the securities and claiming that he had purchased shares in the securities when he had not.” He and a friend in the same groups promoted stocks they held, then sold as the price rose. He was convicted in October 2024 of making false statements to induce others to trade, and sentenced to 16 months in prison. His friend got 19 months.

Notice what the group saw. They saw a respected regular with a good record of “spotting” moves, a target price, and a claim that he was buying too. Every one of those signals looked like conviction. None of it was true.

The second case shows the other half, fake volume. A former chief executive of an SGX-listed company and an associate used 14 trading accounts in other people’s names to trade the company’s shares back and forth. According to MAS, the price rose “from a low of $0.115 on 4 November 2014 to a high of $0.191 on 25 May 2015, before closing at $0.118 on 8 September 2015.”

So that is a 66% rise built on trades between their own accounts, followed by a 38% fall to almost exactly where it began. Anyone who bought near the top on the strength of “heavy volume” bought from a ghost.

Why are penny stocks the usual target?

Because a small push moves them a long way.

The SEC’s investor bulletin on microcap stocks says these companies are “susceptible to fraud and manipulation”, and that with low trading volumes “any size trade can have a large percentage impact on the price.”

Now look at the tick sizes on SGX. Under SGX Rule 8.3.3, a share priced below 20 cents moves in steps of 0.1 cent. On a 1.2-cent share, one step is 8.3% of the price. On a S$5 share, one step of 1 cent is 0.2%. So a promoter needs a handful of trades to make a penny stock look like it is flying, and the chart will show double-digit percentage jumps that would take serious money on a blue chip.

So treat a sudden spike on a thin penny stock as noise until proven otherwise. A real business rarely reprices by a third in an afternoon. Why the low price is a trap even without a promoter is a topic of its own, covered in our post comparing penny stocks with blue chips.

Source, Story, Size, Seller: the four checks before you buy

Run these four on any tip that reaches you through a chat group, a stranger’s message or a post that “everyone” is sharing.

CheckAsk yourselfRed flag
SourceDo I know this person, and are they licensed to give advice?A stranger online, a “mentor”, a group admin you have never met
StoryCan I check the claim in the company’s own filings?Targets, “insider” news, screenshots of buys you cannot verify
SizeHow small is the company, and how much trades each day?A tiny market value, a price below 20 cents, a volume spike from nothing
SellerIf I buy now, who is selling to me?The person telling you to buy already owns it

The SPF’s 2021 advisory puts the first check plainly: “Be wary of stock tips provided to you online or by persons you have not personally met before.” You can also look up whether an adviser is on the MAS register, and whether the name appears on MAS’s Investor Alert List.

The fourth check is the one people skip. Every share you buy, someone sells. In a pump, the seller is often the person cheering you on. Ask who benefits if you click buy in the next ten minutes, and the answer is usually not you.

If you want a daily routine that starts from your own chart instead of a group chat, our free 15-Minute Swing Trader’s Checklist has the questions to ask before any trade. Get the free checklist →

But aren’t these real shares on real exchanges?

Yes, and that is exactly the trap. A trader asked about one such scam this year: “These were real companies traded on NASDAQ.” The same writer added that “once I had made some money, naturally he gained my trust.”

The SPF saw this coming in 2021, when it warned: “Do not be lulled into complacency just because you are purchasing actual shares listed on reputable exchanges.” A real ticker on a real exchange tells you the shares exist. It tells you nothing about why the price is moving.

There is a second variant you should know about. In its advisory of 4 June 2026, the SPF said that “Since May 2026, at least 48 cases were reported, with total losses amounting to at least $3.6 million” in scams where “mentors” in WhatsApp groups move victims onto fake trading platforms. There the shares never existed at all. The early “profits” are numbers on a screen, built to make you deposit more.

Why do smart people still fall for it?

Because the group feels like evidence. When hundreds of people post green screenshots, your brain reads the crowd as proof. That is herd behaviour, and a pump is designed to trigger it.

The story does the rest. A tip with a reason attached, a contract coming, a takeover rumour, a “Top Spotter” with a record, feels far safer than a bare ticker. That pull toward a neat story is the narrative fallacy, and it is why the false statements in the MAS case worked.

And then there is the first win. The scam in that post above let the victim make money first. A small early profit feels like proof the source is real, and it is the most expensive proof you can get.

What should you do if you think you are in one?

Stop adding money. Do not chase a loss by buying more on the next “target”.

Then check the four boxes in the table against what you hold. If the stock is tiny and thin, the size of your position matters more than your view on it. Our guide to how much of your portfolio to put in one stock shows why one position should never be able to sink the account. The wider habits are in the risk management guide.

If you were asked to move money to an unfamiliar platform or app, report it. The SPF’s own advice is to check through ScamShield and tell the police.

So how do you spot a pump-and-dump?

You look past the excitement and check the plumbing. Who is telling you, can you verify what they say, how easily can the price be pushed, and who is on the other side of your trade.

The groups will keep forming, because the crowd is the fuel and the crowd is free. What changes is whether you are in it. The next time a tip arrives with a target and a rocket emoji, which of the four checks will it pass?

FAQ

What is a pump-and-dump?

It is a scheme where promoters buy a cheap, thinly traded stock, hype it to a crowd, then sell their shares into the buying they caused. The price usually falls back once they stop.

Is a pump-and-dump illegal in Singapore?

Yes. In the MAS case above, the promoter was convicted of making false statements to induce others to trade, under section 200(1)(a) of the Securities and Futures Act, and sent to prison for 16 months.

Why do pump-and-dumps target penny stocks?

Because they are cheap to move. Below 20 cents, SGX shares move in steps of 0.1 cent, so a single step on a 1.2-cent share is 8.3% of the price, and thin daily volume means a few trades can push it a long way.

Can I lose money even if the shares are real?

Yes. Real shares on a real exchange can still be pumped. You lose when you buy near the top from the promoters and the price falls back after they sell.

How do I check if an adviser is licensed?

Look the person or firm up on the MAS Financial Institutions Directory, and check the MAS Investor Alert List for names that have been flagged.

Go deeper

Pump-and-dumps prey on traders who have no routine of their own. The free 15-Minute Swing Trader’s Checklist gives you one: the daily scan, the questions to ask before every trade, and the five rules that keep you in the game.


About the author. Spencer Li is The 15-Minute Trader and the founder of Synapse Trading. He is a Certified Financial Technician (CFTe) with 15+ years of trading, run from 70+ countries. He holds a B.Acc and B.BM from SMU. Every trade he takes is public, dated, losses left in. He teaches low-risk swing trading in 15 minutes a day, one system for any market.

Educational content only, not personalised financial advice. Trading carries risk, including loss of capital. Past performance is not indicative of future results. Synapse Trading is not licensed or regulated by MAS.
by Spencer Li
https://synapsetrading.com/wp-content/uploads/2026/10/how-to-spot-pump-and-dump-card.webp 630 1200 Spencer Li https://synapsetrading.com/wp-content/uploads/2026/10/synapse-logo-horizontal-light.png Spencer Li2026-04-27 20:07:072026-09-29 20:27:40How to Spot a Pump-and-Dump Before You Buy
Spencer Li

How to Size a Credit Spread Using Its Max Loss

Markets & Products
Size a credit spread - options

Why the premium is the wrong number to size by, worked through on one spread

Published: 16 October 2026 · Last updated: 31 August 2026 · By Spencer Li, CFTe


Most people new to credit spreads ask how much one can make. The better question is how many to run, and it is the one a Reddit thread, titled simply “Credit spreads risk”, kept circling.

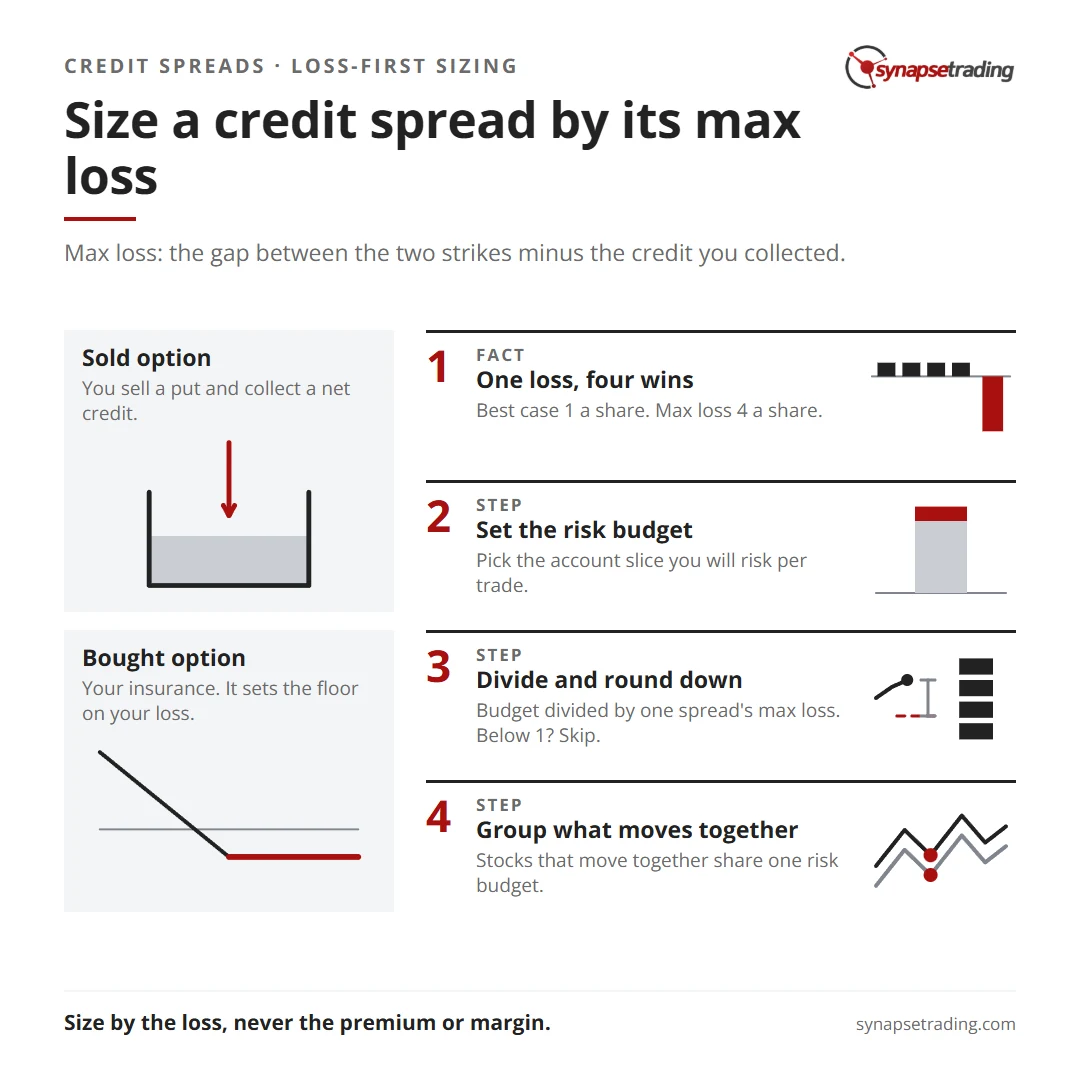
The short answer is to size a credit spread by its maximum loss, never by the premium it pays or the margin it frees up. On a simple credit spread, the max loss is the gap between the two strikes minus the credit you collected. Decide what slice of your account you are willing to lose on one trade, divide it by the max loss of one spread, and round down. That is your ceiling. Then count every spread on stocks that move together as a single position, because in a sell-off they all lose at the same time.

The rest of this post works that through on one spread, with the arithmetic shown in full.

Size a credit spread by its max loss. Summary card for the post: How to Size a Credit Spread Using Its Max Loss.

What is the max loss on a credit spread?

Take a hypothetical spread, with round numbers. A stock trades at USD 100. You sell a put with a strike of 95 and buy a put with a strike of 90, both expiring next month, and collect a net USD 1.00 a share. This is a put credit spread, sometimes called a bull put spread.

The 90 put is your insurance. It sets the floor on how much you can lose, which is what makes this a “defined-risk” trade.

Stock price at expiryResult per shareAs a multiple of the credit
95 or higher+1.00, you keep the credit+1×
940, your breakeven0
92−2.00−2×
90 or lower−4.00, the max loss−4×

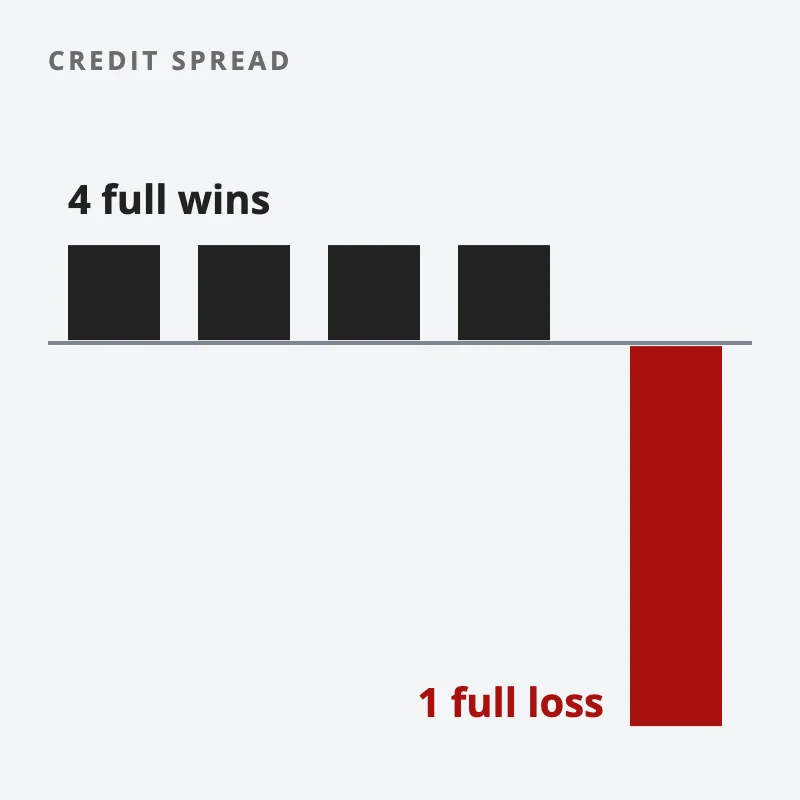
The max loss is the width, 5, minus the credit, 1. That is 4 a share, against a best case of 1 a share. One contract covers 100 shares, so both numbers scale by 100.

You need four full wins to pay for one full loss.

Four short bars above the line for four full wins, and one red bar four times as long below it for one full loss
One full loss on this spread costs four full wins, so size it by the loss.

This is the trade-off the guide to options trading describes as “many small wins, then one loss that erases them”. It is built into the shape of the spread, before a single trade is placed.

Why does sizing by the premium go wrong?

Because the premium is the number you can see, and the loss is the number you have to imagine.

Picture a trader whose account is big enough that one of these spreads can lose 0.8% of it. The credit on one spread feels too small to bother with, so he sells five. Five credits look good on the screen. But five spreads also carry a max loss of 4% of the account, riding on one stock, one week and one direction.

Make it ten, and one bad week takes 8% of the account. A run of three bad weeks in a falling market, and a good year is wiped out in a month.

Traders who have been through this say so in their own words. A trader on r/thetagang, looking back on 2 years of selling options, put this first on his list of mistakes: “OVERSIZING: used way more margin that I should have.” After he cut his margin use, he wrote: “This alone made the most difference.”

There is a quieter cost too. At a 1-to-4 payoff, you need to win more than 4 trades in 5 just to break even, if every loss is a full loss. Real losses are often smaller, because people close early, but real fills are also worse than the screen shows, and over dozens of trades that gap adds up to more than most people expect when they start. One trader on Reddit logged 60 index iron condor fills against the midpoint on his screen in March 2026. His real returns came in “15-20% below what my model projected”, because the fills on a multi-leg order were worse than the midpoint.

So the high win rate is what you pay for with the lopsided payoff. Neither half comes free.

Loss-First Sizing, in four steps

Here is the method, which I call Loss-First Sizing, because the loss is the first number you write down.

  1. Set the risk budget. Pick the slice of your account you will risk on one trade, as a percentage. In this example it is 1%. Our post on the 2% money management rule explains how to choose that slice.
  2. Find the max loss of one spread, as a share of the account. Width minus credit, times 100 shares, divided by the account. In the example, 4 a share works out to 0.8% of the account.
  3. Divide and round down. 1% divided by 0.8% is 1.25, so the answer is 1 spread. If the answer is below 1, the spread is too wide for the account, so you narrow the strikes or skip the trade.
  4. Group what moves together. Spreads on five chip stocks are one position in a sell-off. They share one risk budget between them.

Run the example through it and the answer is one spread. Just one, against the five that felt worth the effort. That gap, between what feels worth doing and what the account can carry, is where most of the damage comes from.

Before you enter, also write down the point at which you will close the spread if it goes against you. Deciding that in the moment, with the loss growing and the fear rising, is how a planned small loss turns into the max loss.

Sizing is the part of this that carries straight over to what we do teach. Our free 15-Minute Swing Trader’s Checklist has the daily routine and the questions to ask before any trade, position size included. Get the free checklist →

Why is margin the wrong measure of size?

Each broker sets its own margin rule for spreads, so check yours. Whatever it holds, “margin used” can look like a natural measure of size, and it is easy to stop there.

It answers the wrong question. At best, margin tells you what one spread can lose. It says nothing about how many spreads your account can survive losing at the same time, which is the question that decides whether you are still trading next year.

How does this work for an iron condor and other multi-leg trades?

An iron condor is two credit spreads at once, a put spread below the price and a call spread above it. The good news is that, at expiry, the stock cannot finish below the puts and above the calls at the same time. So only one side can take the full loss.

The max loss on an iron condor is the width of the wider side minus the total credit for both sides. Size it with the same four steps, using that number.

Every other multi-leg structure works the same way. Find the worst case at expiry, write it down per contract, and size from there. If you cannot work out the worst case, that is a sign to skip the trade, because you are taking a risk you cannot measure.

What can go wrong that the max loss does not show?

Two things, both from the fine print.

The first is early assignment. US-listed stock options can be exercised on any business day. The Options Industry Council says “All standardized equity options use American-style exercise,” and the clearing house hands out exercise notices at random. If your short leg is deep in the money, you can be assigned before expiry while your insurance leg is still open. On a call spread near an ex-dividend date, the Council warns that “An assigned call writer (covered or not) is obligated to deliver the stock plus the dividend.” The full mechanics are in what happens when an option is assigned.

The second is expiry day itself. If the stock closes between your two strikes, your short leg finishes in the money and is likely to be assigned, while your insurance leg expires worthless. You can wake up holding 100 shares per contract over a weekend. Some brokers close such positions before the bell, so read your broker’s expiry rules. From Singapore, a Friday expiry ends at the New York close, in the early hours of Saturday morning local time, so this happens while you are asleep.

Neither changes the max loss on paper. Both can change what your account looks like on Monday morning.

What is the most you would be comfortable losing on one trade? And how many of your open spreads would lose together if the market fell 5% tomorrow? Those two answers, written down before the next trade, size the spread for you.

FAQ

How do you calculate the max loss on a credit spread?

Take the width between the strikes, subtract the credit you collected, and multiply by 100 for one contract. A 5-point spread sold for 1.00 has a max loss of 4.00 a share, four times the credit.

How many credit spreads should I trade at once?

Trade only as many as fit your risk budget when you size by the max loss, rounded down. Spreads on stocks that tend to move together share a single budget, because they tend to lose together.

Is a credit spread safer than selling a naked put?

A credit spread caps the loss, so the worst case is known before you enter, which a naked put does not offer. The trade-off is that the loss can still be several times the credit, so the sizing matters just as much.

What is the max loss on an iron condor?

It is the width of the wider spread minus the total credit collected on both sides. Only one side can lose in full at expiry, because the stock cannot finish beyond both.

Does Synapse Trading teach credit spreads?

No, we do not teach options at the moment. We teach end-of-day swing trading in shares, forex and ETFs, and the risk-per-trade sizing in this post works the same whichever product you use.

Go deeper

This post covers one corner of options. If you would rather start with what we do teach, the free 15-Minute Swing Trader’s Checklist has the daily routine, the questions to ask before every trade, and the five rules that keep you in the game.


About the author. Spencer Li is The 15-Minute Trader and the founder of Synapse Trading. He is a Certified Financial Technician (CFTe) with 15+ years of trading, run from 70+ countries. He holds a B.Acc and B.BM from SMU. Every trade he takes is public, dated, losses left in. He teaches low-risk swing trading in 15 minutes a day, one system for any market.

Educational content only, not personalised financial advice. Trading carries risk, including loss of capital. Past performance is not indicative of future results. Synapse Trading is not licensed or regulated by MAS.
by Spencer Li
https://synapsetrading.com/wp-content/uploads/2026/10/credit-spread-max-loss-card.webp 630 1200 Spencer Li https://synapsetrading.com/wp-content/uploads/2026/10/synapse-logo-horizontal-light.png Spencer Li2026-04-08 11:02:492026-08-31 11:48:02How to Size a Credit Spread Using Its Max Loss
Spencer Li

The Yen Carry Trade: Unwinding and Its Global Implications

Markets & Products
The yen carry trade unwinds - macro

The yen carry trade has long been a cornerstone of global financial strategies, allowing investors to leverage Japan’s low-interest rates for higher returns abroad.

However, recent developments have put this once-reliable trade under pressure.

In this blog post, I will explain what the yen carry trade is, its historical context, the reasons behind its current unwinding, and how it will affect the various financial markets.


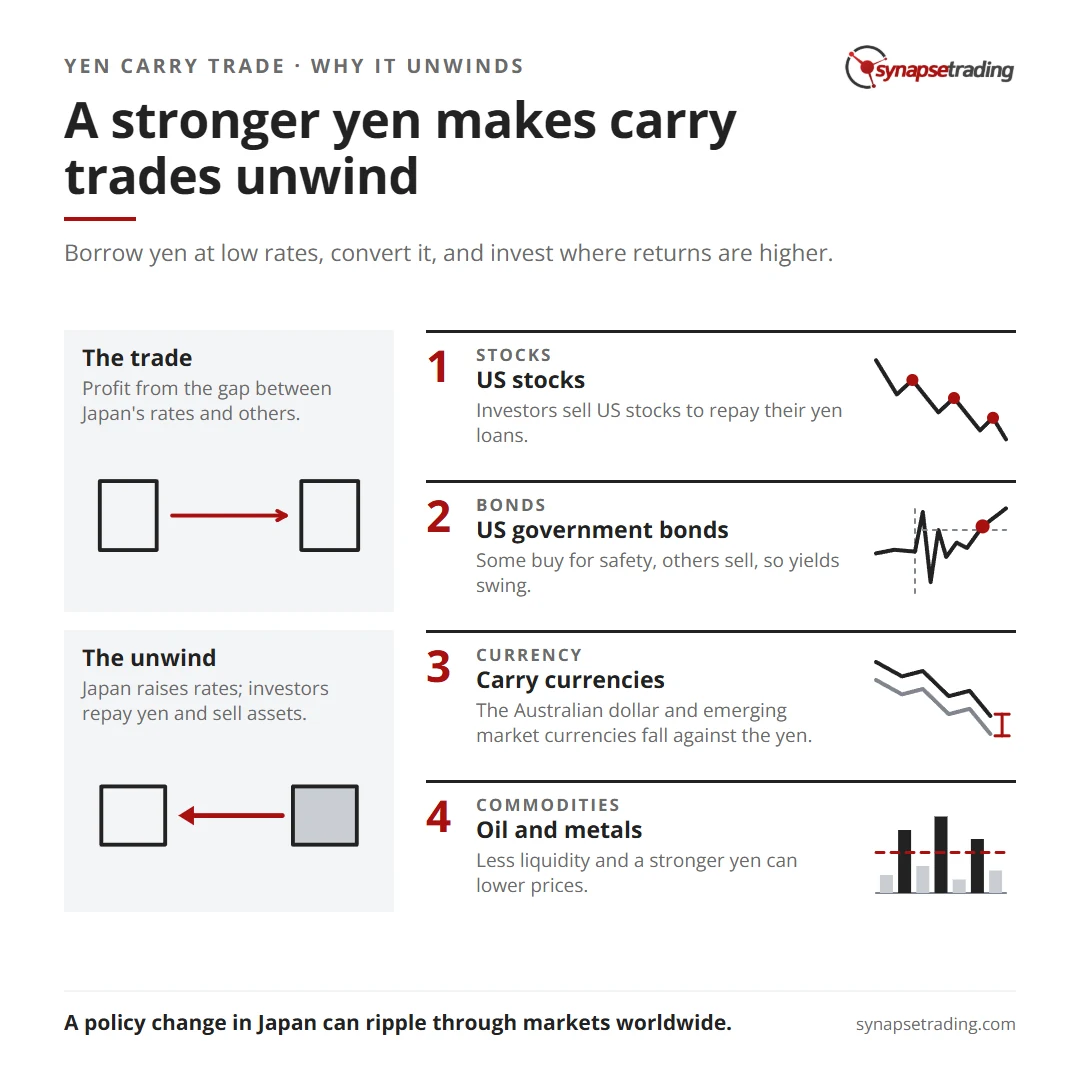
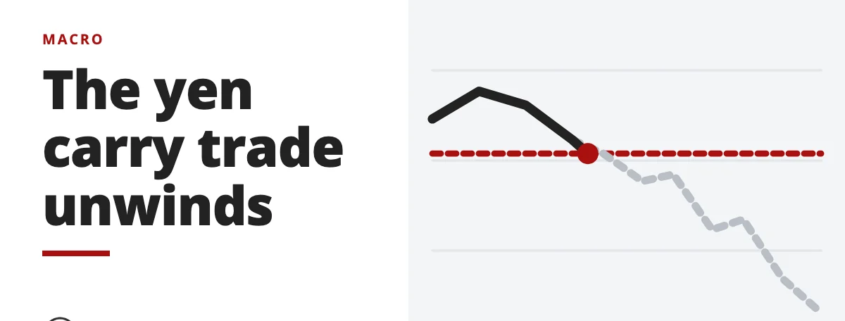
A stronger yen makes carry trades unwind. Summary card for the post: The Yen Carry Trade: Unwinding and Its Global Implications.

What is the Yen Carry Trade?

The yen carry trade involves borrowing funds in Japanese yen, where interest rates are typically very low, and then converting these funds into a currency with higher interest rates to invest in assets that yield better returns.

This strategy exploits the differential in interest rates between Japan and other countries, allowing investors to profit from the spread. Historically, it has been a lucrative endeavor, with minimal cost for borrowing in yen and potential for significant gains in higher-yielding currencies and assets.

To elaborate, the core mechanism of the yen carry trade is based on the interest rate differential. Japan has maintained one of the lowest interest rates among developed countries, often near or at zero.

Investors borrow in yen at these low rates and convert the yen into currencies like the U.S. dollar or Australian dollar, where interest rates are higher. The borrowed funds are then invested in assets that provide higher returns, such as government bonds, corporate bonds, equities, or real estate in those higher-yielding currencies.

The profit for the investor comes from the difference between the low cost of borrowing in yen and the higher returns on the investments made in other currencies.

For example, if an investor borrows yen at an interest rate of 0.1% and invests in U.S. Treasury bonds yielding 2%, the investor earns the difference, minus any exchange rate changes. This trade is particularly attractive during periods of stable or appreciating currencies against the yen, as any gain in the target currency further enhances returns.

Historical Context

The yen carry trade gained popularity in the late 1990s and early 2000s as Japan maintained ultra-low interest rates in response to its prolonged economic stagnation. The Bank of Japan’s (BOJ) commitment to near-zero rates created a fertile ground for this strategy.

Investors flocked to borrow in yen and invest in higher-yielding assets worldwide, driving significant capital flows across global markets. This trade contributed to liquidity in financial markets and often amplified asset price movements.

In the 1990s, Japan’s economy was grappling with the aftermath of the asset bubble burst. The BOJ slashed interest rates to stimulate economic activity, making borrowing extremely cheap.

This environment catalyzed the yen carry trade, attracting global investors who could borrow yen at negligible costs. By the early 2000s, this strategy was widespread, influencing capital flows and asset prices globally.

The 2008 financial crisis marked a significant moment for the carry trade. As global markets plunged, investors scrambled to unwind their yen positions, leading to a sharp appreciation of the yen.

This episode highlighted the inherent risks of the carry trade—while it could be highly profitable in stable times, it also posed substantial risks during periods of market turbulence.

Why is the Trade Unwinding Now?

The yen carry trade is unwinding primarily due to the recent policy shifts by the Bank of Japan. For the first time in many years, the BOJ has signaled an end to its ultra-loose monetary policy by lifting its main interest rate. This move, aimed at combating inflation and stabilizing the economy, has had profound implications for the carry trade.

As Japan’s interest rates rise, the cost of borrowing in yen increases, reducing the profitability of the carry trade. Consequently, investors are beginning to unwind their positions, repaying yen-denominated debt and selling off foreign assets.

In detail, the BOJ’s decision to raise interest rates is a response to rising inflationary pressures. Japan, historically plagued by deflation, is now facing inflationary trends similar to other advanced economies.

To curb inflation, the BOJ has started to tighten its monetary policy, which includes raising interest rates. This change increases the cost of borrowing in yen, thereby diminishing the appeal of the carry trade.

As the yen appreciates, the cost of repaying yen-denominated loans increases, prompting investors to close their positions.

The rapid unwinding has created significant volatility in financial markets, particularly in assets that were popular targets of the carry trade, such as U.S. equities and emerging market currencies.

What is the Significance of This?

The unwinding of the yen carry trade is significant for several reasons.

Firstly, it signals a major shift in Japanese monetary policy, which has been a cornerstone of global financial markets for decades.

Secondly, it highlights the interconnectedness of global markets, where a policy change in Japan can ripple through to impact asset prices and capital flows worldwide. The yen exchange rate has become a key driver of global markets, indicating the profound influence of Japanese monetary policy on international financial dynamics.

This shift underscores the global dependency on Japanese monetary policy.

For years, the yen carry trade has been a source of global liquidity, supporting asset prices and economic growth in various regions. The BOJ’s policy shift not only affects Japan but also has broad implications for global financial stability.

The yen’s appreciation and the subsequent market reactions demonstrate how deeply intertwined global financial systems are, with Japan playing a pivotal role.

How Does it Affect the Markets?

The impact of the yen carry trade unwinding is already being felt across various markets.

The rapid appreciation of the yen against the U.S. dollar has caught many market participants off guard. Over the last month, the yen has surged approximately 8% against the dollar, a stark contrast from its depreciation earlier in the year. This sudden rally has triggered a sell-off in U.S. equities, as investors unwind their carry trade positions, leading to downward pressure on asset prices.

This market reaction highlights the vulnerabilities in financial markets to changes in the yen exchange rate. The appreciation of the yen increases the cost of repaying yen-denominated debt, prompting investors to liquidate assets to meet these obligations. This selling pressure has led to declines in equity prices and increased volatility in financial markets.

Deep Dive on Specific Markets

  1. U.S. Equities: The U.S. stock market has experienced increased volatility and a broad slump as the yen appreciates. The unwinding of the carry trade leads to selling pressure on U.S. equities, exacerbating declines in stock prices. This negative reaction of U.S. equity prices is an early warning of the challenges ahead.The relationship between the yen carry trade and U.S. equities is significant because many investors use borrowed yen to invest in U.S. stocks. When the yen strengthens, these investors face higher costs to repay their loans, leading them to sell their U.S. stock holdings. This selling pressure contributes to market declines and increased volatility.
  2. U.S. Government Debt: The yields on U.S. government bonds have also been affected. As investors sell foreign assets to repay yen-denominated debt, there is a shift in demand dynamics for U.S. Treasuries, influencing yields and bond prices.Typically, during periods of financial stress, U.S. Treasuries are seen as a safe haven. However, the unwinding of the carry trade can lead to complex dynamics. While some investors may flock to Treasuries for safety, others may sell them to cover their yen-denominated liabilities, leading to fluctuating yields.
  3. Global Currency Markets: The yen’s rally has had a ripple effect on other currencies, particularly those that were heavily borrowed against in carry trades. This includes higher-yielding currencies like the Australian dollar and emerging market currencies, which have seen increased volatility and depreciation against the yen.The strength of the yen affects global currency markets by altering the dynamics of capital flows. Currencies that were favored in carry trades may experience significant depreciation as investors unwind their positions. This can lead to heightened volatility and potential financial instability in countries reliant on these capital flows.
  4. Commodities: Commodity markets are also impacted as the unwinding of the carry trade affects global liquidity and risk sentiment. A stronger yen can lead to reduced commodity prices, as Japan is a significant importer of raw materials.Commodities are sensitive to changes in global liquidity and risk sentiment.The unwinding of the carry trade can reduce liquidity, leading to lower demand for commodities. Additionally, a stronger yen makes imports cheaper for Japan, potentially reducing the global prices of commodities such as oil and metals.

Concluding Thoughts

The unwinding of the yen carry trade is a pivotal development in global financial markets, driven by the Bank of Japan’s shift in monetary policy. Its effects are far-reaching, impacting equities, bonds, currencies, and commodities worldwide. As the yen appreciates, the vulnerabilities in global markets are laid bare, underscoring the interconnectedness of financial systems.

Investors and policymakers alike must navigate these changes with an understanding of the intricate dynamics at play, ensuring strategies are adapted to this new financial landscape.

Now that I have shared all about the Yen carry trade unwinding, here are some questions to ponder about:

  • How might the unwinding of the yen carry trade influence the stability and valuation of emerging market currencies that were previously beneficiaries of this strategy?
  • What potential long-term impacts could the shift in Japanese monetary policy have on global equity markets, particularly in terms of investment flows and asset allocation strategies?

Let me know your answers in the comments below.

by Spencer Li
https://synapsetrading.com/wp-content/uploads/2026/10/yen-carry-trade-unwinding-card.webp 630 1200 Spencer Li https://synapsetrading.com/wp-content/uploads/2026/10/synapse-logo-horizontal-light.png Spencer Li2024-08-05 14:39:392026-09-26 12:45:48The Yen Carry Trade: Unwinding and Its Global Implications
Spencer Li

Understanding Contracts for Difference (CFDs)

Markets & Products
How CFDs really work - products

What Are CFDs (Contracts for Difference) and How Do They Work?

Last updated: 27 September 2026 · By Spencer Li, CFTe


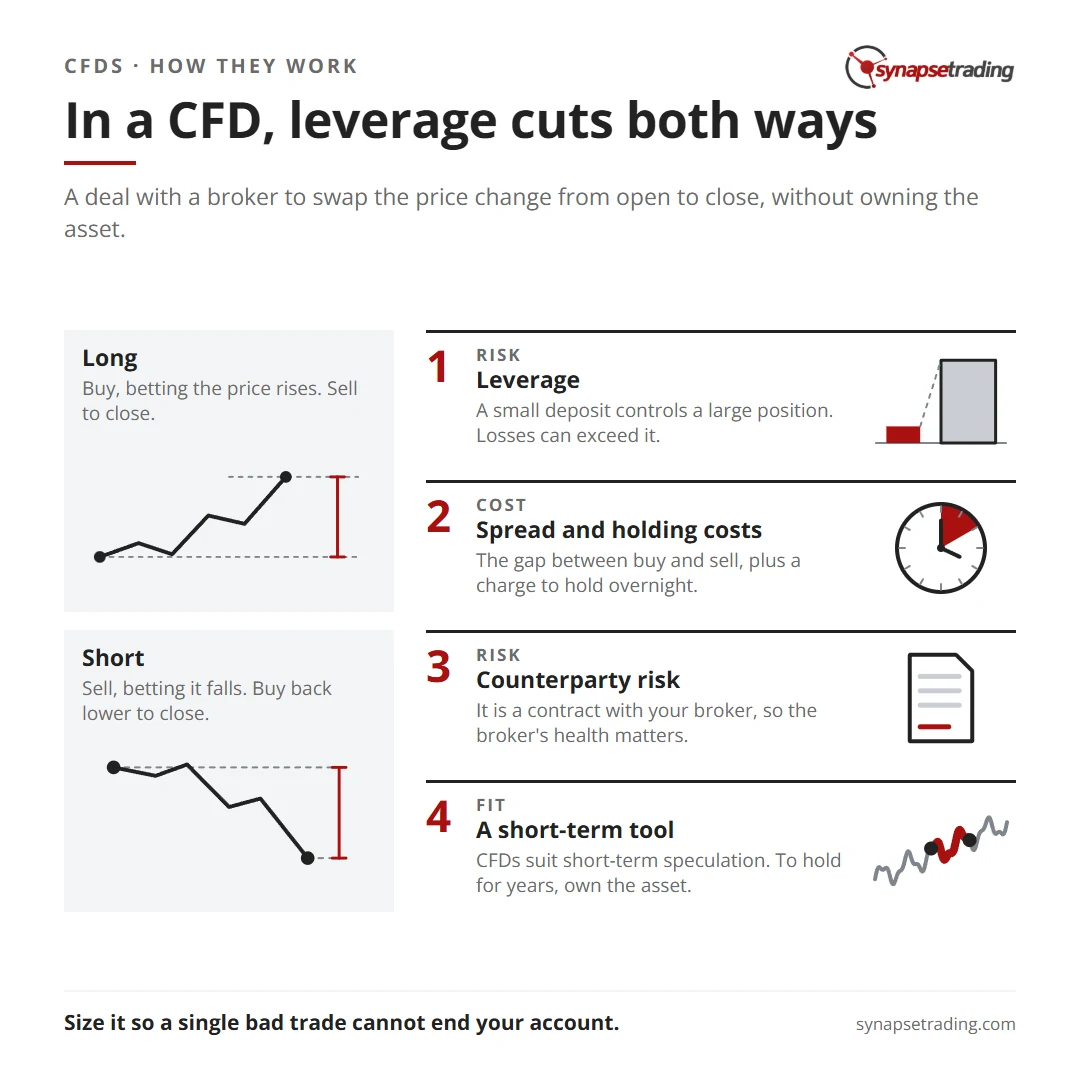
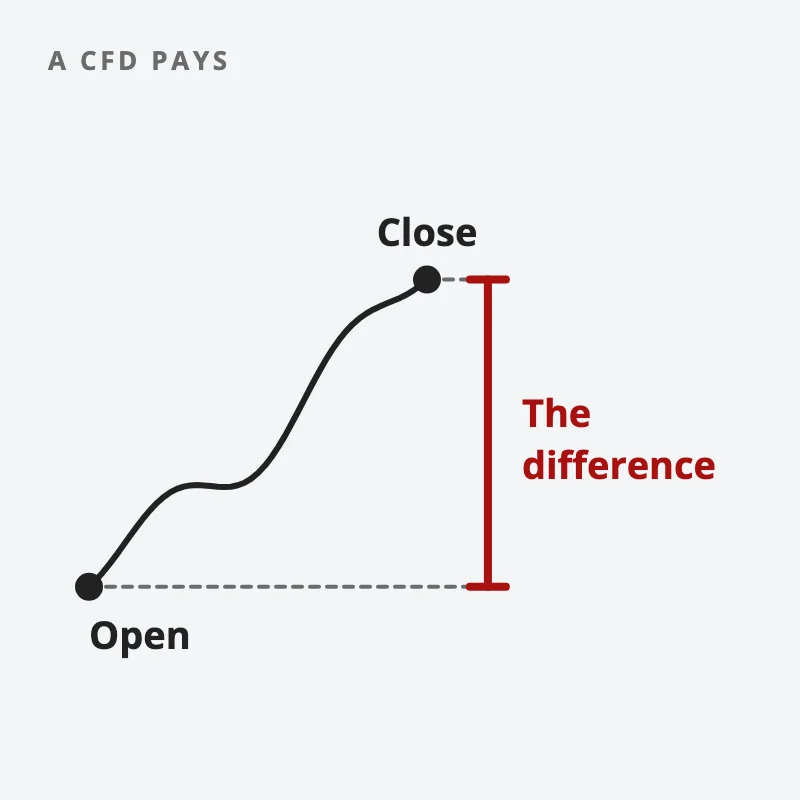
A CFD (Contract for Difference) is an agreement between you and a broker to exchange the difference in an asset’s price from when you open the trade to when you close it, without ever owning the asset itself. If the price moves your way, the broker pays you the difference; if it moves against you, you pay the broker. You can go long (buy, betting the price rises) or short (sell, betting it falls), and because CFDs are traded on margin (you put up a small fraction of the position’s value), a small amount of capital controls a large position. That leverage cuts both ways: it magnifies your gains and your losses in equal measure. CFDs let you trade stocks, indices, forex, commodities, and crypto from one account, which is the real draw. The catch is that the same leverage that makes them attractive is what blows up most beginners. So they suit experienced traders who already have risk management down. Beginners should not learn them on a live account.

Here is how they actually work, the markets you can trade, the trade-offs, and two worked examples.

In a CFD, leverage cuts both ways. Summary card for the post: Understanding Contracts for Difference (CFDs).

What is a CFD, in plain terms?

A CFD is a financial derivative (a contract whose value is derived from something else) that lets you speculate on an asset’s price without buying the asset. You never hold the shares, the gold, or the coins. You hold a contract that tracks the price.

Think of it like betting on the outcome of a football match without buying the team. You agree with the bookmaker (the broker) on a price now. When the match ends (you close the trade), whoever was right collects the difference. That is the whole idea.

A price line runs from an open dot up to a close dot; a red bracket marks the difference between the two prices, which is what a CFD pays
A CFD pays the price difference between your open and your close, without owning the asset.

Four things happen in every CFD trade:

  • Opening a position. If you think the price will rise, you open a long (buy) position. If you think it will fall, you open a short (sell) position. The ability to short easily is a big part of why traders like CFDs.
  • Leverage. CFDs trade on margin, so a small deposit controls a much larger position. This amplifies profits, and it amplifies losses by exactly the same factor. Do note that this is the part that hurts people.
  • Spread and costs. Your cost includes the spread (the gap between the buy price and the sell price) plus any holding cost charged for keeping a position open overnight.
  • Closing a position. To bank the profit or loss, you do the opposite of what you did to open: you sell if you bought, and you buy if you sold. The difference between your open and your close is your result.

Where did CFDs come from?

CFDs were created in the early 1990s in London, developed by two investment bankers at UBS Warburg, Brian Keelan and Jon Wood. They were not built for retail traders at all. They started as an equity swap that institutions used to hedge positions on the London Stock Exchange cheaply, mostly to sidestep the UK stamp duty tax on buying physical shares.

Three things made them useful from the start:

  • Tax efficiency. They let big institutional players avoid stamp duty on large share purchases.
  • Leverage. They let traders control large positions with a small amount of capital (amplifying profit and loss alike).
  • Flexibility. They made it easy to go both long and short, in any market condition.

Through the late 1990s and early 2000s, online brokerages and trading platforms put CFDs in front of retail traders for the first time. The product spread out of the UK into Europe and Australia, with each region adapting it to its own rules.

That popularity brought scrutiny. Regulators like the Financial Conduct Authority (FCA) in the UK and the Australian Securities and Investments Commission (ASIC) stepped in to protect retail investors. They imposed leverage limits to cap the risk, and they required brokers to give clear risk warnings so clients understand what they are getting into. That regulatory tightening is also why CFDs are restricted or banned outright in some countries.

What can you trade with CFDs?

This is the genuine appeal. One CFD account gives you access to a wide range of markets:

  • Stocks. Shares of companies like Apple, Google, and Tesla.
  • Indices. The S&P 500, FTSE 100, Nikkei 225, and other market indices.
  • Forex. Currency pairs like EUR/USD and GBP/JPY.
  • Commodities. Precious metals like gold and silver, and energy like oil and natural gas.
  • Cryptocurrencies. Bitcoin, Ethereum, and others.
  • ETFs. Exchange-traded funds, for exposure to whole sectors or asset classes at once.

Pros and cons of trading CFDs

CFDs come with real advantages and real risks, and you need both halves of the picture before you decide whether they fit you.

CFDs
LeveragePro: higher potential returns from a smaller deposit. Con: the same leverage can produce losses that exceed your initial outlay.
Market accessPro: stocks, forex, commodities, indices, and crypto from one platform.
DirectionPro: profit from falling markets (short) as easily as rising ones (long).
OwnershipPro: no need to custody or handle the underlying asset. Con: you own nothing, so no dividends-in-kind, no voting, no shares to hold long term.
Entry costPro: lower capital required than buying the asset outright.
Trading costsCon: spread, overnight holding costs, and sometimes commission.
RegulationCon: not available in some countries; restricted in others.
ComplexityCon: managing leveraged positions takes real understanding of markets and risk.
Counterparty riskCon: if the broker defaults, your positions are exposed.

Personally, the line I would underline is counterparty risk and leverage. A CFD is a contract with your broker, not a share you hold in your own name, so the broker’s health matters. And leverage is the single feature that turns a manageable mistake into an account-ending one. Respect it, or it will teach you the hard way.

CFD vs owning the shares: what is the difference?

A common question is how a CFD differs from just buying the stock. The core difference: with a CFD you own a contract that tracks the price; you never own the asset.

CFDOwning the shares
What you holdA contract with the brokerThe actual asset in your name
Capital requiredA margin deposit (a fraction of position size)The full value of the position
Short sellingEasy, built inHard or restricted for retail
LeverageYes, magnifies gains and lossesUsually no
Overnight costHolding cost charged dailyNone
Time horizon it suitsShort-term speculationLong-term investing
Counterparty riskYes, exposed to the brokerNo

The short version: CFDs are a tool for short-term, leveraged speculation. If your goal is to buy and hold for years, owning the asset is usually the cleaner choice.

Two worked examples

Numbers make this concrete. Here is one long trade and one short trade, costs excluded for clarity.

Long example (stocks). You think Apple will rise. You buy 100 CFD shares of Apple (AAPL) at $150. The price rises to $160, and you close.

  • Opening position: 100 shares x $150 = $15,000
  • Closing position: 100 shares x $160 = $16,000
  • Profit: $16,000 minus $15,000 = $1,000 (excluding costs)

Short example (commodities). You think gold will fall. You sell 10 CFDs of gold at $1,800 per ounce. The price drops to $1,750, and you close.

  • Opening position: 10 ounces x $1,800 = $18,000
  • Closing position: 10 ounces x $1,750 = $17,500
  • Profit: $18,000 minus $17,500 = $500 (excluding costs)

Side by side, so the long-vs-short mechanics are clear:

Long (Apple)Short (Gold)
Your viewPrice will risePrice will fall
Action to openBuy at $150Sell at $1,800
Action to closeSell at $160Buy at $1,750
Result+$1,000+$500

Notice the short trade: you sold first and bought back lower, and you still made money. That is the part new traders find counterintuitive, and it is exactly what CFDs make easy.

Where the human edge comes in

Leverage and one-click access to every market are now free. Any broker hands them to you on signup. What no platform hands you is the discipline to size a leveraged position so a single bad trade cannot end your account, or the judgment to skip a market you do not actually understand. The leverage is the easy part. Knowing how much of it to use, and when to use none at all, is the part worth learning. That is discipline and sizing, the second of the Five Edges no broker can supply for you.

FAQ

What is a CFD in simple terms?
A CFD (Contract for Difference) is an agreement with a broker to exchange the difference in an asset’s price between when you open and close the trade, without owning the asset. If the price moves your way you profit; if it moves against you, you lose.

Are CFDs good for beginners?
Generally no. CFDs use leverage, which magnifies losses as much as gains, so they are best suited to experienced traders who already have risk management in place. A beginner is better off learning position sizing and a tested system first.

Can you lose more than you invest with CFDs?
Yes. Because CFDs are leveraged, losses can exceed your initial deposit. This is why regulators impose leverage limits and require risk warnings, and why sizing matters more than the entry.

What is the difference between a CFD and buying the stock?
With a CFD you hold a contract that tracks the price, and you never own the share itself. CFDs require less capital, allow easy shorting, and use leverage, but carry overnight costs and broker counterparty risk. Owning the stock suits long-term investing; CFDs suit short-term speculation.

What can you trade as CFDs?
Stocks, indices (like the S&P 500 and FTSE 100), forex pairs, commodities (gold, silver, oil), cryptocurrencies, and ETFs, all from a single account.


Now that you know how CFDs work, the question is not really “what is a CFD,” it is “how do I keep leverage from blowing me up.” That answer is the same in every market: a tested system and disciplined sizing. Which leads naturally to the next thing to learn.

If you want the full foundation, start with the pillar: The Beginner’s Guide to Trading.

Want a system that controls the risk for you? Grab the free 15-Minute Swing Trading Starter Kit. It’s the exact routine I use to scan once a day and trade any market in 15 minutes, with sizing baked in so leverage stays under control.


About the author. Spencer Li is The 15-Minute Trader and the founder of Synapse Trading. He is a Certified Financial Technician (CFTe) with 15+ years of trading, run from 70+ countries. He holds a B.Acc and B.BM from SMU. Every trade he takes is public, dated, losses left in. He teaches low-risk swing trading in 15 minutes a day, one system for any market.

Education, not financial advice. Synapse Trading is not licensed by MAS to advise on investment products. Trading carries risk of loss, including the risk of losing more than your initial deposit with leveraged products; past performance is not indicative of future results.


Related

The Beginner’s Guide to Trading & Technical Analysis · What is Leverage in Forex? · Short Selling Explained · What is the Forex Market or Currency Market?

by Spencer Li
https://synapsetrading.com/wp-content/uploads/2026/10/cfds-contracts-for-difference-card.webp 630 1200 Spencer Li https://synapsetrading.com/wp-content/uploads/2026/10/synapse-logo-horizontal-light.png Spencer Li2024-06-20 04:57:192026-10-22 13:19:42Understanding Contracts for Difference (CFDs)
Spencer Li

Will we see an Ethereum (ETH) ETF Soon?

Markets & Products
Will an Ether ETF come? - crypto

What Is an Ethereum (ETH) ETF, and How Does It Work?

Last updated: 17 September 2026 · By Spencer Li, CFTe


An Ethereum ETF is an exchange-traded fund that holds Ethereum (ETH) on your behalf and trades as a single ticker on a regular stock exchange, so you can get exposure to ETH through a normal brokerage account without ever holding the crypto yourself. A spot Ethereum ETF holds actual ETH; a futures Ethereum ETF holds ETH futures contracts instead. The US Securities and Exchange Commission (SEC) approved the first spot Ethereum ETFs in mid-2024, and they began trading in July 2024, roughly six months after spot Bitcoin ETFs did the same. The appeal is simple: no private keys, no crypto exchange, no self-custody, just a line item in the same account that holds your stocks. The trade-off is just as simple: you own a fund, not the coin, so you pay a management fee and you cannot move the ETH on-chain or stake it yourself.

Here is what an Ethereum ETF actually is, how the spot and futures versions differ, and what it does and does not give you.

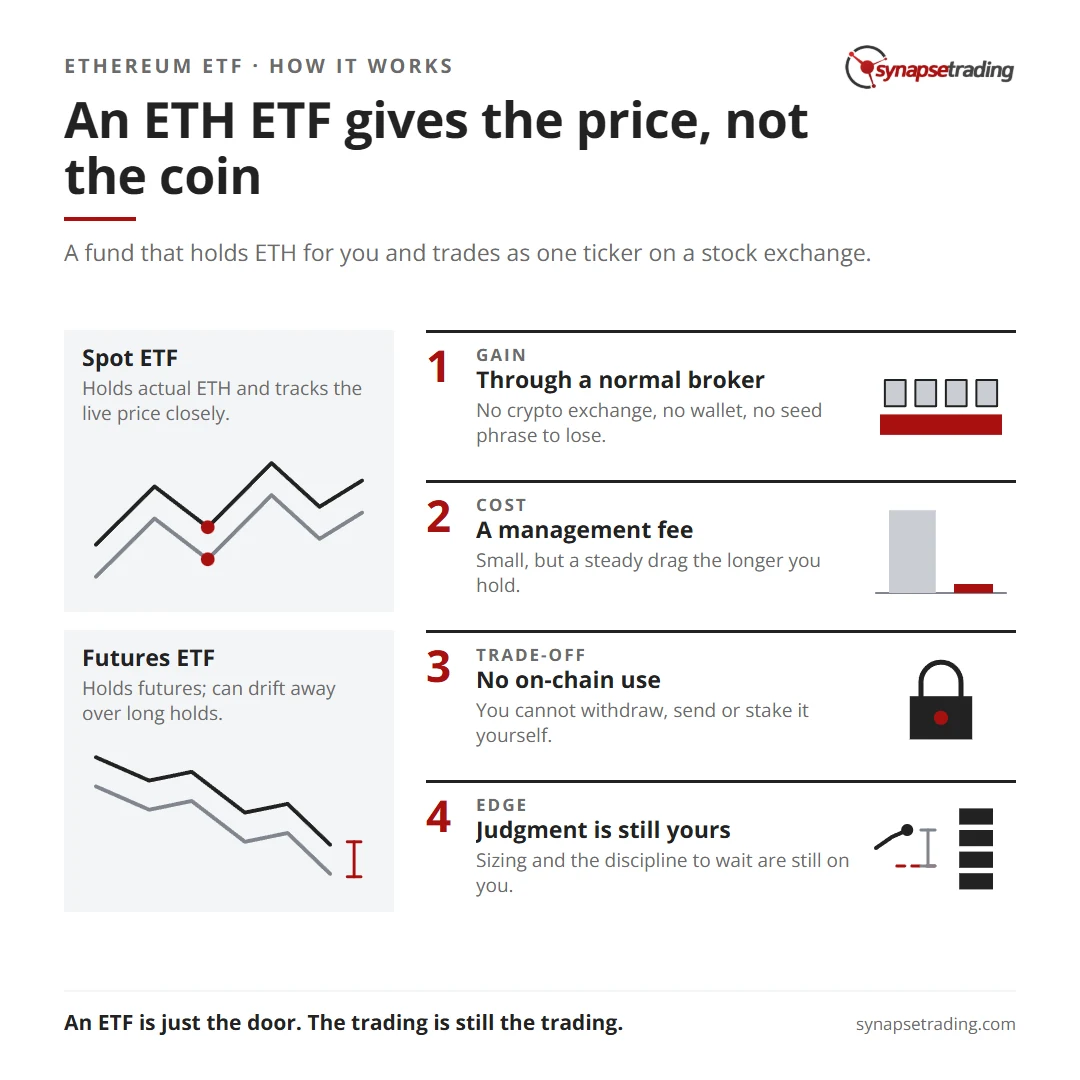
An ETH ETF gives the price, not the coin. Summary card for the post: Will we see an Ethereum (ETH) ETF Soon?.

What is an Ethereum ETF?

An ETF (exchange-traded fund) is a fund that holds an underlying asset and trades on a stock exchange like a share. An Ethereum ETF applies that wrapper to ETH.

You buy the ticker through your normal broker. Behind the scenes, the fund holds the exposure, and the price of your shares tracks the price of Ethereum (minus fees). When ETH goes up, the fund goes up. When ETH falls, so does the fund.

The point of the wrapper is access. Buying ETH directly means opening a crypto exchange account, funding it, and then either trusting that exchange to hold your coins or moving them into a self-custody wallet and looking after the private keys yourself. An ETF removes all of that. You get the price exposure inside the same regulated, familiar account you already use for stocks.

Spot vs futures: what is the difference?

There are two kinds of crypto ETF, and the difference matters.

A spot ETH ETF holds actual Ethereum. The fund buys and stores real ETH, so the share price tracks the live spot price closely.

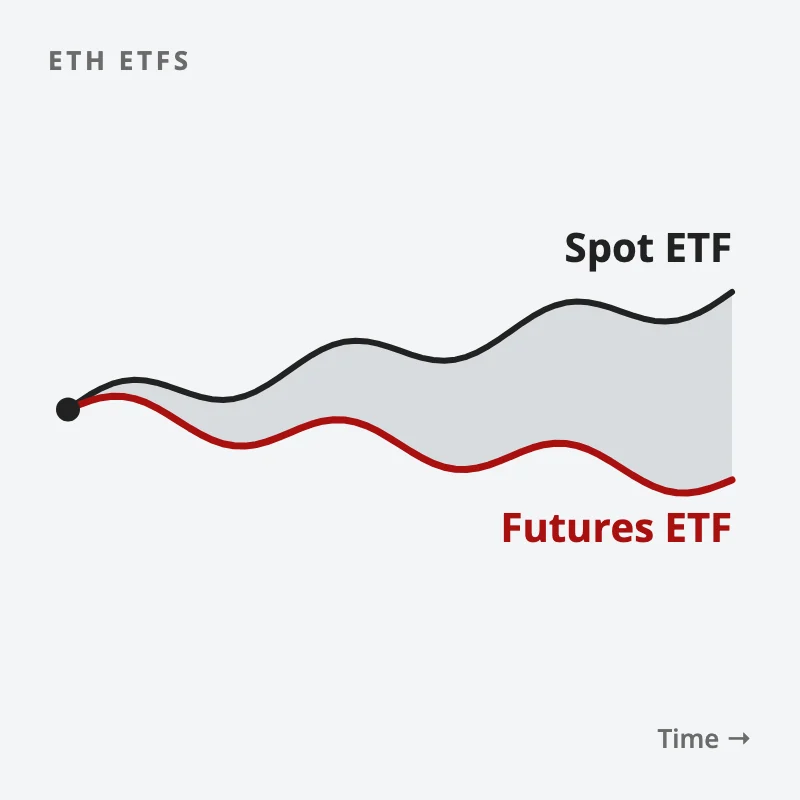
A futures ETH ETF holds ETH futures contracts (agreements to buy or sell ETH at a set price on a future date) rather than the coin itself. Futures funds came first, because regulators were comfortable with them earlier. They track ETH well enough for short holds, but over longer periods the cost of rolling contracts forward can cause the fund to drift away from the spot price.

Two lines start at the same point: the spot ETF line tracks closely while the futures ETF line drifts further away over time
A spot ETF tracks ETH closely; a futures ETF can drift away over long holds.
Spot ETH ETFFutures ETH ETF
What it holdsActual ETHETH futures contracts
Tracks spot priceCloselyApproximately, can drift over time
Main drawbackManagement feeRoll costs over longer holds
US approvalMid-2024Earlier (futures came first)
Best forLonger-term ETH exposureShorter-term or tactical exposure

For most people who simply want ETH exposure and plan to hold it, the spot version is the cleaner instrument. The futures version exists, and it has its uses, but you should know which one you are buying.

Why did the SEC take so long to approve it?

The short version: the SEC’s job is investor protection and market integrity, and for years it treated crypto products as guilty until proven innocent.

The agency has a long, documented pattern of delaying decisions on crypto ETFs rather than rejecting them outright. It repeatedly invoked its full review windows, asked for more comment, and pushed deadlines back. The same thing happened with Bitcoin. The SEC stalled spot Bitcoin ETFs for years before approving eleven of them in January 2024, and even then the approval passed by a single vote, with then-Chair Gary Gensler stressing that approval was not an endorsement of crypto.

Ethereum carried an extra question on top of all that: is ETH a commodity or a security? That classification debate, plus Ethereum’s move to a proof-of-stake model (where the network is secured by staked ETH rather than mining), gave regulators more to scrutinise around liquidity and how the asset is treated under the law.

The resolution, when it came in mid-2024, followed the Bitcoin script almost exactly: long reluctance, then approval once the precedent and the institutional demand were impossible to ignore. That is the useful pattern to remember. With crypto products, the SEC has tended to delay, then eventually follow the precedent it set with the prior asset.

What an Ethereum ETF gives you, and what it doesn’t

This is where I want to be straight with you, because the convenience cuts both ways.

What you gain:

  • Access through a normal broker. No crypto exchange, no wallet, no seed phrase to lose.
  • Regulated, familiar custody. The fund handles storage. For a lot of people that alone is worth the fee.
  • It sits with your other assets. ETH exposure in the same account as your stocks, with normal reporting.

What you give up:

  • You own units of the fund; the fund holds the coin. You cannot withdraw ETH on-chain, send it, or use it in any application.
  • You pay a management fee. Small, but it is a steady drag the longer you hold.
  • Staking yield is not yours by default. Holding ETH directly can earn staking rewards. An ETF wrapper may or may not pass any of that through, so check the specific fund.

Personally, I think the ETF is the right tool for someone who wants price exposure and values simplicity over control. If you actually want to use Ethereum, stake it, or hold the keys yourself, the ETF is not that. Pick the instrument that matches what you are trying to do.

Where the human edge comes in

An ETF makes the access trivial. One click in your broker and you have ETH exposure. What it does not do is tell you how much to put on, when crypto’s volatility means a position this size is too big for your account, or whether you should be buying ETH at all right now versus sitting on your hands.

The wrapper solved the plumbing. It did nothing for the judgment, the sizing, or the discipline to wait for your spot. That part is still on you, and it is the first of the Five Edges no product can outsource for you.

FAQ

Is there a spot Ethereum ETF?
Yes. The SEC approved the first US spot Ethereum ETFs in mid-2024, and they began trading in July 2024. A spot ETH ETF holds actual Ethereum, so its price tracks the live ETH price closely.

What is the difference between a spot and a futures Ethereum ETF?
A spot ETH ETF holds real ETH; a futures ETH ETF holds ETH futures contracts. Spot funds track the live price closely, while futures funds can drift from the spot price over longer holds because of the cost of rolling contracts forward.

Do I own actual Ethereum if I buy an ETH ETF?
No. You own shares in a fund that holds the exposure. You cannot withdraw the ETH on-chain, send it, stake it yourself, or use it in any application. If you want the actual coin, you need to buy ETH directly and hold it.

Can I earn staking rewards through an Ethereum ETF?
Not by default. Holding ETH directly can earn staking rewards, but an ETF may or may not pass any staking yield through to shareholders. Check the specific fund’s structure before assuming you get it.

Why did the SEC take so long to approve an Ethereum ETF?
The SEC’s mandate is investor protection and market integrity, and it has a long pattern of delaying crypto ETF decisions rather than rejecting them. With Ethereum it also had to weigh the commodity-versus-security classification question. As with Bitcoin, it eventually approved spot ETH ETFs once the precedent and institutional demand were clear.


Now that you know what the wrapper is and is not, the real question is the same one it always is: what is your plan for the position once you own it? An ETF is just the door. The trading is still the trading.

If you want the bigger picture on crypto and DeFi, read the pillar: The Ultimate Guide to Blockchain and Cryptocurrencies.

Want a simple system for any market, crypto included? Grab the free 15-Minute Swing Trading Starter Kit. It’s the exact routine I use to scan once a day and trade in 15 minutes, on stocks, forex, or crypto.


About the author. Spencer Li is The 15-Minute Trader and the founder of Synapse Trading. He is a Certified Financial Technician (CFTe) with 15+ years of trading, run from 70+ countries. He holds a B.Acc and B.BM from SMU. Every trade he takes is public, dated, losses left in. He teaches low-risk swing trading in 15 minutes a day, one system for any market.

Education, not financial advice. Synapse Trading is not licensed by MAS to advise on investment products. Trading carries risk of loss; past performance is not indicative of future results.


Related

The Ultimate Guide to Blockchain and Cryptocurrencies · Bitcoin ETF explained · What is Cryptocurrency, and is it a Good Investment? · What is DeFi

by Spencer Li
https://synapsetrading.com/wp-content/uploads/2026/10/ethereum-eth-etf-card.webp 630 1200 Spencer Li https://synapsetrading.com/wp-content/uploads/2026/10/synapse-logo-horizontal-light.png Spencer Li2024-02-02 08:00:012026-10-22 13:19:46Will we see an Ethereum (ETH) ETF Soon?
Page 4 of 14«‹23456›»

Free checklist

The 15-Minute Swing Trader’s Checklist

The daily and weekly routine I use to find, manage and review trades in about 15 minutes a day, trading since 2007.

Get the free checklist

Topics

  • Trading foundations
  • Technical analysis
  • Strategies and systems
  • Risk and money
  • Trading psychology
  • Markets and products

Synapse Trading

Swing trading for busy professionals, in 15 minutes a day.

Start free

Learn

  • Start here
  • Free trading guides
  • Blog
  • Tools and resources

Programs

  • Trading Mastery Program
  • Daily trading signals
  • Student results
  • Public trade log

Company

  • About
  • Contact me
  • Partnerships
  • Disclaimer
  • Privacy policy
  • Terms & Conditions

Synapse Trading Pte Ltd
Registration No. 201316168H
WhatsApp +65-8897-1204
info@synapsetrading.com

Contact Us

Synapse Trading Pte Ltd
Registration No. 201316168H

Whatsapp: +65-8897-1204
Telegram: @iamrecneps
Email: info@synapsetrading.com

Links

Disclaimer
Privacy policy
Terms & Conditions
Contact us
Partnerships

© 2012-2026 Synapse Trading | All rights reserved. Educational content only, not personalised financial advice. Trading carries risk, including loss of capital. Past performance is not indicative of future results. Synapse Trading is not licensed or regulated by MAS.
  • Link to Facebook
  • Link to X
  • Link to Instagram
  • Link to Youtube
  • Link to LinkedIn
  • Link to Mail
Scroll to top Scroll to top Scroll to top