Market analysis, insights and trading ideas on various markets and products!

Based on my research, historically April is a strong month, ranked 2nd after December in terms of returns and the probability of closing up by the end of the month. However, after the long run-up, there does not seem to have any positive catalyst left, and may even be overbought, especially after the window dressing during late March. Hence I am expecting a brief pullback/consolidation of sorts.

Looking at the chart of the STI, we can see that it has tested and rebounded strongly from the support zone, and is close to breaking above the pivot of the W-bottom. However, due to its long run-up, it is very likely that there will be a pullback after the breakout in the event that one does occur. That will be a more optimal time for a long entry.

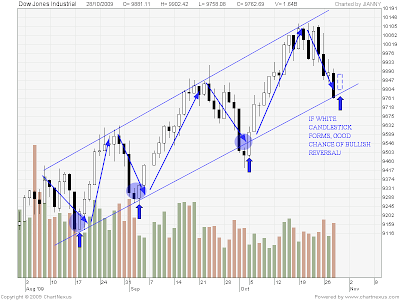
20091030 Dow Jones Industrial 800x600

Key insights from 3 major indices

The Dow Jones has found support at the bottom of the channel, and this could mark the end of its decline and the resumption of its slow creeping journey upwards. The Dow heading upwards could improve global sentiment and give a boost to all indices worldwide.
Key insights from 3 major indices
After the steep drop from the earthquake disaster, the Nikkei has found support at the previous low. The fall has stabilised with a couple of harami inside bars, with one of the bars being a hammer. With Warren Buffett stepping out to encourage buying, it suggests that the situation in Japan is much under control now.
Key insights from 3 major indices
The STI is coming out of the oversold zone, but the question is whether one should buy on dips or short on rallies. Looking at the recent price channel, it is clearly sloping down, and price is under the 200-day moving average, a common gauge of bullishness/bearishness, and in this case bearishness. Based on my trend-following approach, I would avoid going long against the trend. However, neither would I go short now since the reward/risk is unfavourable. I am anticipating this week to close up, but would prefer to see at least a higher low form before considering going long.
Remember, trading is not about calling every small turn, but rather having the patience to wait for the best setups, and positioning yourself such that the odds are in your favour. Good luck!

F&N
Today, I came across this call by CIMB:

Fraser & Neave Target Cut To S$6.84 From S$6.91

Currently, the price is now 5.28, and 6.84 represents quite a significant upside. Most likely, this value was derived from a valuation model, and not from the charts, because it doesn’t look too rosy on the charts, with a clear head and shoulders (H&S) reversal pattern. This is one of the most bearish reversals, and could last quite a while. Last week, a pullback to resistance offered an excellent shorting opportunity. I would avoid buying this stock, at least until this pattern is negated or has run its full course of decline.

Major Commodity Indices

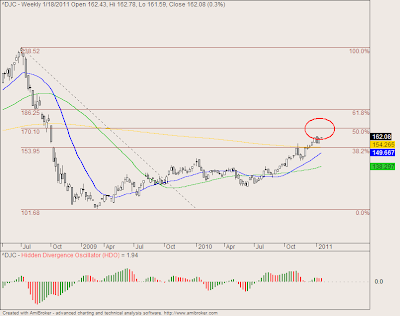
Both the CRB and the DJC commodity indices are near the crucial 50% retracement level, which will act as strong resistance. Prices will definitely not sail right past this level, hence there will have to be some sort of reaction, for example like a pullback or consolidation, or even a correction. This could act as a drag on commodity stocks in the coming weeks. This once again highlights the importance of tracking the various global markets, even when your main market is the Singapore market. Stay tuned!

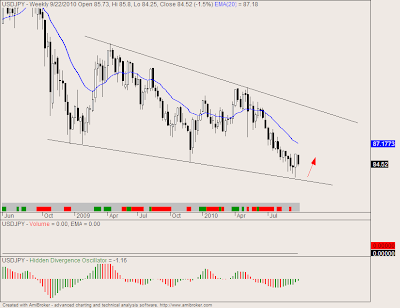
usdjpy 092210


weekly chart of USD

On this weekly chart of USD/JPY, we can see that the USD has not touched the 20-EMA in quite a while, and has also bounced off the bottom of the channel. Since there is still much bearish pressure, there is a good chance that it will try to test the old lows of 82.85. USD has been weakening against the Yen, which led to the BoJ intervening to prevent a further strengthening of the Yen, by buying USD and selling Yen. An overly strong Yen makes Japanese exporters less competitive in the global market.
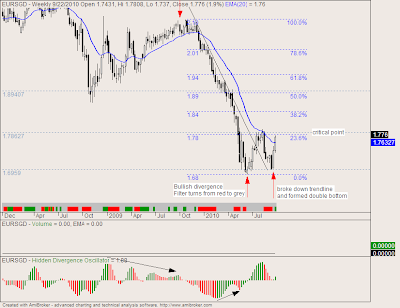
weekly chart of EUR/SGD
On this weekly chart of EUR/SGD, we can see a double bottom trend reversal pattern, after the down trendline was violated. However, given the prior strong downtrend, the bull flag might fail and go into a consolidation instead. This might simply be a 2-leeged pullback before resuming the downtrend. .