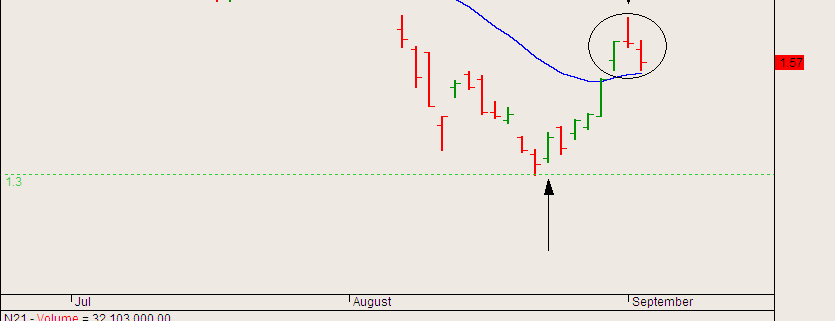
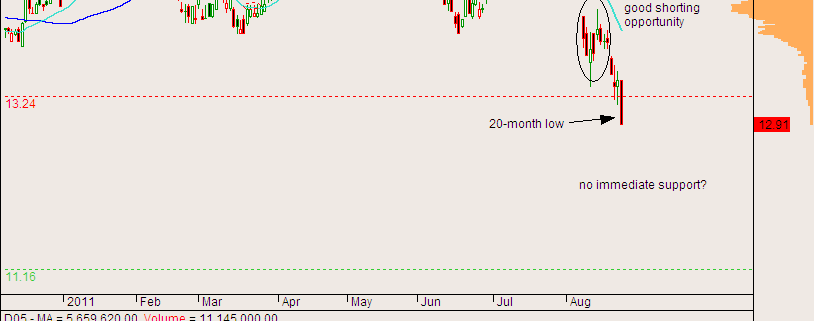
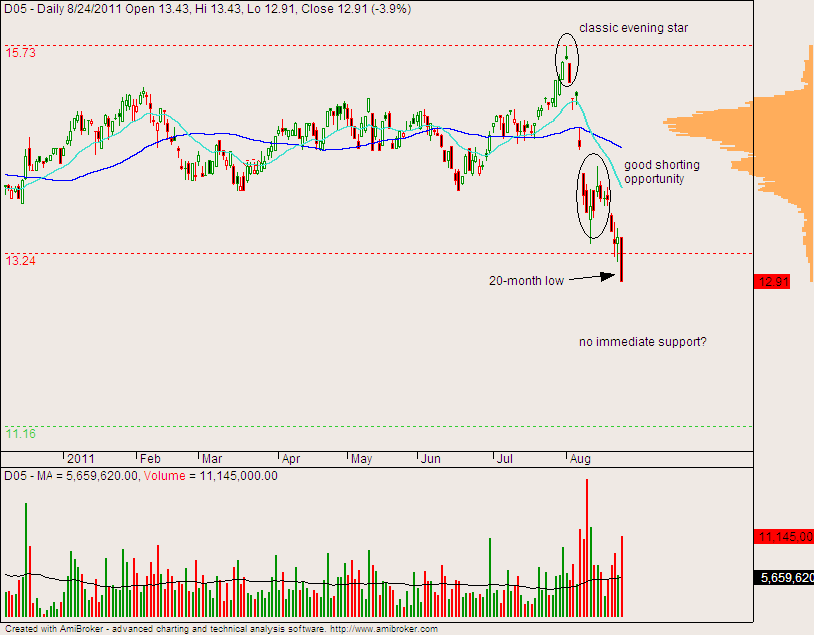
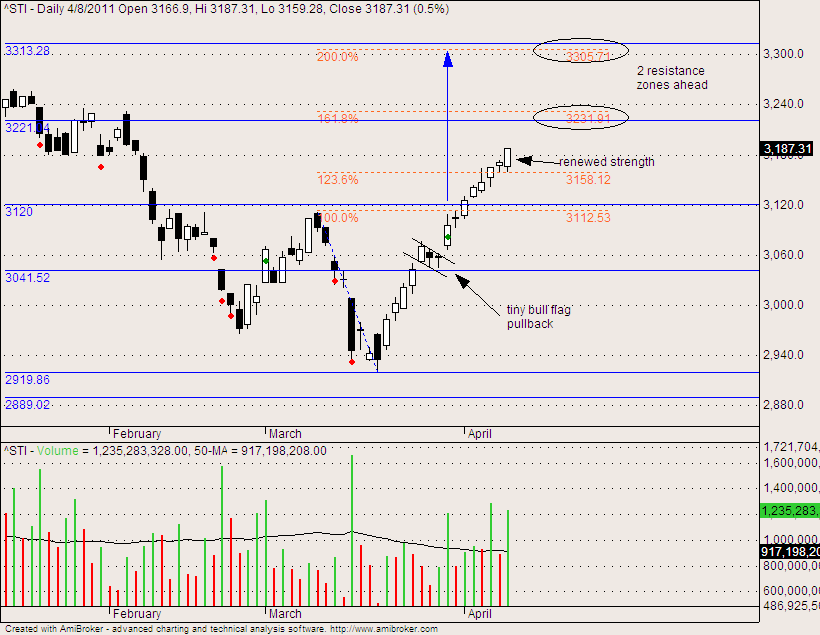
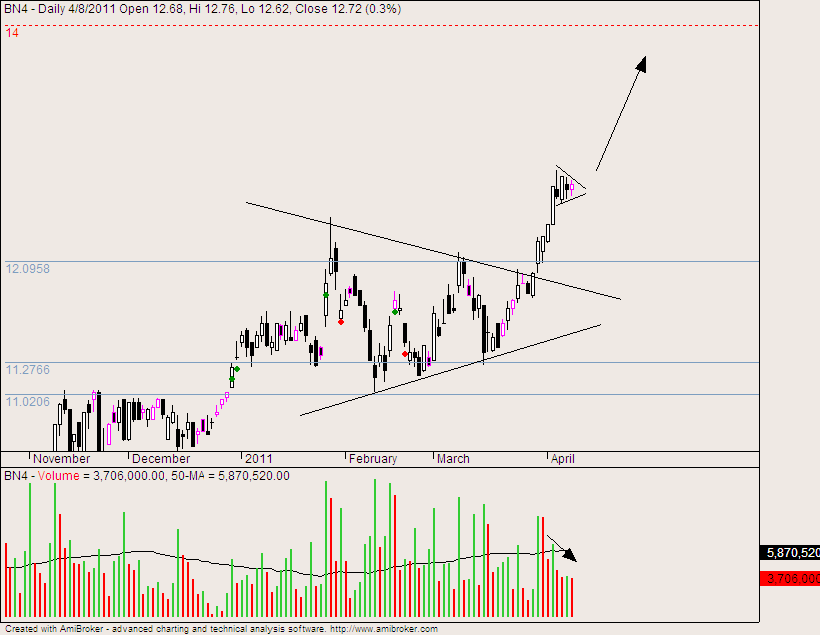
Leonardo Da Vinci once said that simplicity is the ultimate sophistication. Let’s take a moment to ponder that. This applies to research analysis as well. When you hear people talking about some sophisticated trading system or some flashy indicators or some complex wave projections, think again. It is more likely to be smoke and mirrors. All these tell you nothing new if you know how to read the bare charts. It’s as simple as that. Simple, and yet sophisticated. Looking back at my last few stock picks, I found that it is possible to read and understand what is happening on the charts. This makes it possible to pinpoint the low risk entry points, as seen in some of my previous posts.
https://synapsetrading.com/dbs-are-the-banks-leading-the-decline/
https://synapsetrading.com/noble-group-evening-star-signals-turn-to-the-downside/
Compare that with indicators. If you see a green arrow, do you know why it is a buy? Maybe it worked the past 3 times, but will it work this time? Maybe. Or maybe not. You won’t know. In fact, you won’t have any idea why there is a green arrow. You won’t know what is happening in the market. You won’t know what the smart money is doing. That is why chart-reading is an important skill everyone should master. Banks, funds and proprietary trading firms use it as their main tool. Maybe you should consider it too.
Spencer is an avid globetrotter who achieved financial freedom in his 20s, while trading & teaching across 70+ countries. As a former professional trader in private equity and proprietary funds, he has over 15 years of market experience, and has been featured on more than 20 occasions in the media.

