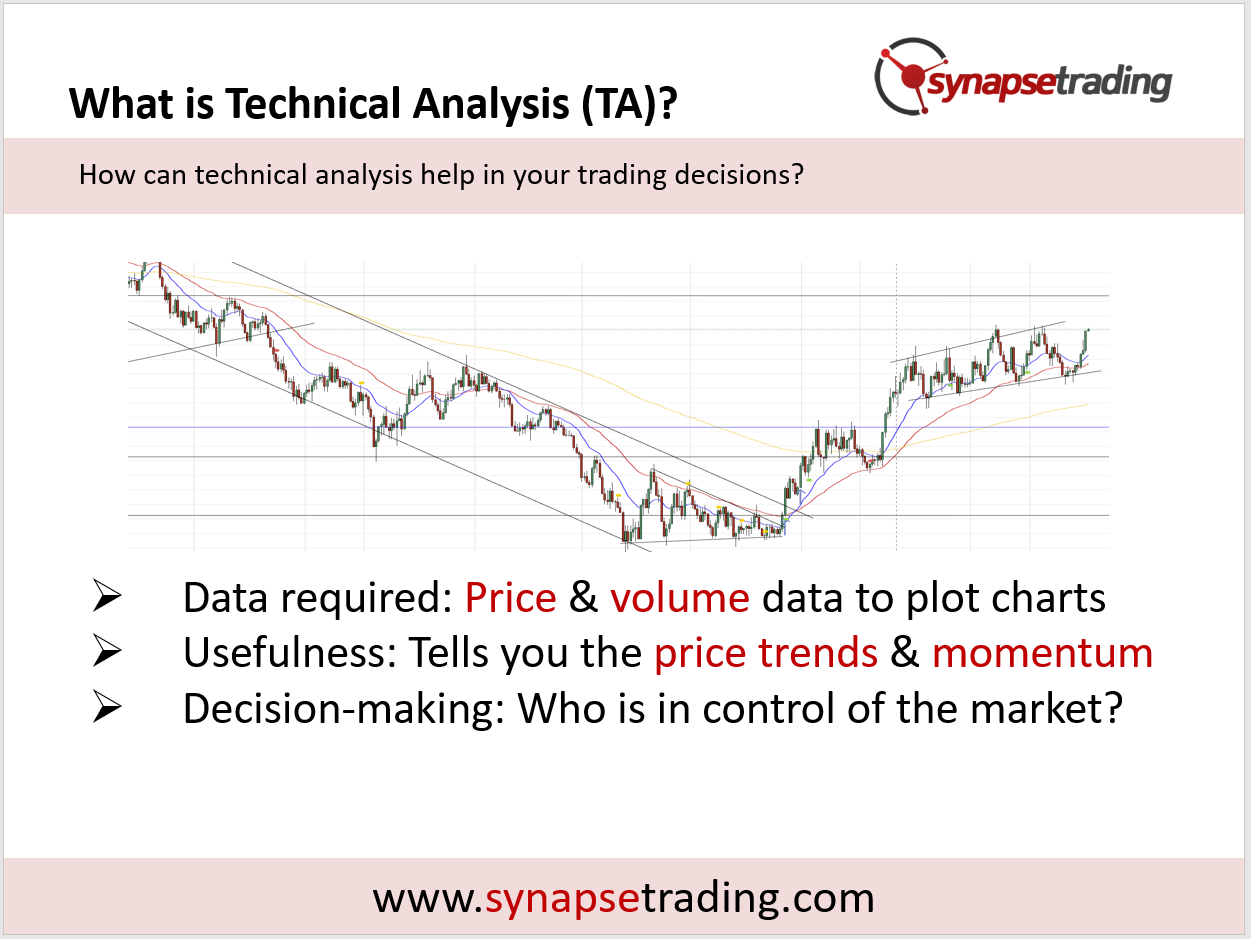
Technical Analysis is the study of price patterns and trends in the financial markets so as to exploit those patterns. It is in effect applied mass psychology, for it studies the collective action of all market participants.
There are 2 main schools of thought – the classical approach vs. the statistical approach.
The classical approach came about before there were computers, when people manually plotted charts on graph paper, and drew lines (support, resistance, trendlines, channels) to identify behavioral patterns and price chart patterns. Even now, it is still widely popular.
The statistical approach uses data and mathematical formulas (indicators, algorithms) to find mathematical patterns and predict probabilities.
Personally, I find the current best approach is to use a combination of both. Just like in driving, you can rely on the autopilot to help you do calculations and provide useful input, but in certain scenarios it is better to manually take over.

In applying technical analysis, the same skills can be applied almost universally across different charts and markets, for example a head and shoulders pattern on a stock chart can be interpreted in a similar way to one one a forex or commodity chart.
This is useful if you need an immediate opinion on a market that you know nothing about. The reason technical analysis works so well across different markets universally is because it analyses market psychology, which is the collective psychology of individual market participants.
In contrast with fundamental methods, technical analysis is much less time consuming, for example it can take as little as five minutes to analyse a chart, while doing a valuation on the same stock may take days.
This is possible because market technicians believe that market action discounts everything, so instead of trying to figure out the “true” value of a stock by valuation, the technician allows the market to do that for him, by looking at the consensus of all market participants.
In addition, technical analysis provides great timing and price projection tools, which cannot be found in the fundamentals.
Technical analysis is part art and part science, which is why both its branches complement each other in analysis.
For the classic method, there is some subjectivity involved, since different technicians can interpret the same charts in different ways. In addition, charts cannot be used to predict sudden positive or negative fundamental events, for example earnings, rights issue, M&A, employment data, etc.
Therefore, it is also importance for technicians to keep track of relevant fundamental news, since these act as price catalysts.
Fundamentals and technicals are not mutually exclusive.
One way to visualise this relationship is to think of fundamentals as the cause (economic reasons why a market moves), and technicals as the effect (the actual moving of the market price).
In the short run, the cause and effect might conflict, and it is almost impossible to attribute the infinite different causes to the observed effects. However, in the long-run, they tend to converge.
For example, in stock investing, only the insiders in the company know almost everything about the company. For us, who are outsiders, although we may have gathered extensive sources of information on the company, industry, country, we may still be wrong.
Thus, it is wise to couple technicals (price consensus of all market participants) with fundamentals (specific knowledge of industry & company) to increase the probability of earning a positive return on your investments.
Technical analysis is used to find opportunities when the probabilities are in your favour, and project possible paths and key levels that prices will reach. It is using past data to make a calculated guess of the future. It is NOT a crystal ball that can forecast the future.


