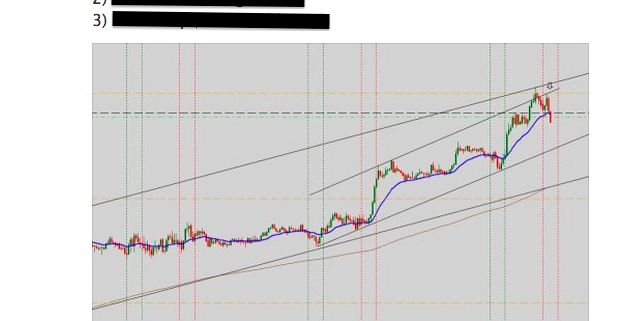
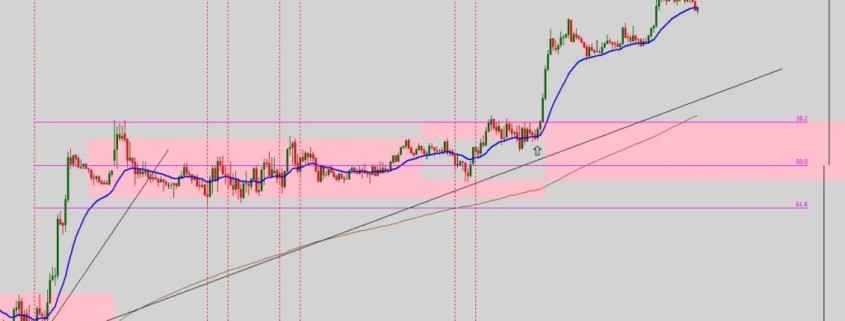
Commodities Trading | Gold

Commodities Trading | Gold 2

This time, besides sharing in the private forum, I also shared this trade in some public forums, minutes after I caught the bottom in Gold at 1636. This kind of precision cannot be done using any software of indicators, because those are slow and it requires the human touch to pinpoint such delicate turning points. Only by observing the price action will one be able to time the entry accurately.

Singapore Stocks | Olam

A simple follow-up for those who traded based on this previous post 4 days ago:
https://synapsetrading.com/the-week-before-christmas-parties-rallies/

Olam has shot up over 9% within 3 days. How did I know the selling pressure was exhausted and a big move was coming? This has to do with reading hidden volume clues and understanding the price action.

Behavioral Analysis

As mentioned in my previous post, I stuck to my trading plan for the day, which was to stick with the trend until I spot the reversal pivotal points. I went long on the EUR/USD in the early part of the day, netting about $3,000. I got out a bit too early, as the price behaviour did not feel right.

I went for dinner and waited for the right moment until I could be certain of the reversal turning point, then I struck without hesitation. I shorted EUR/USD, EUR/JPY and GBP/JPY, making about $4,000 in less than 30 mins.

Since there was no more news for the day, I decided to call it an early night.

Note to Mentoring Program Graduates:
Whether you are trading forex or stocks, the setups are almost the same. I tend to post more forex setups because they occur more frequently on an intraday basis, while stocks tend to move slower. Study the forex chart setups I post in the forum to get a better understanding of how to identify them on the stock charts.

Forex Trading | Revealed

Yesterday, I decided to close out my short positions on the EUR/USD, which on hindsight was a big mistake. I should have stuck with my original TP, and it would have rewarded me with an additional $4000.

Many people have asked me how I derived my TP of 1.3252, and I have decided to reveal one of my techniques for doing precise price projections. If you see the pink grid in the chart, I had that plotted even before the breakout, and if you observe the black sell arrow at the top, that is where price reached, almost to the precise pip. That’s how accurate it can be.

For today, the path of last resistance is still upwards, and I will be watching to either enter on higher timeframe pullbacks or in the opposite direction should I spot any reversal pivotal points.

Soaring Profits on the Euro and Sterling 2

Soaring Profits on the Euro and Sterling 2

Today was a pretty quiet day, just like yesterday, for the large part of the day. The major pairs were trapped in a narrow range of about 30-40 pips. However, from reading the price action, I was pretty certain we would be seeing more upside. Adding to my longs from yesterday, I had about 20 lots on the EUR/USD.

After hitting my first TP, I went long 10 lots on the GBP/USD, staggering the 1st and 2nd TP to maximize my hitrate and lower my risk. The markets were rather quiet after dinner so I took some time off to do some Christmas shopping.

At night, both pairs broke out, and my 2nd TP for GBP/USD was hit. the EUR/USD was showing signs of price weakness, so I decided to take my profits and call it a night. I ended the day with an average of roughly 50 pips on 20 standard lots, which amounted to slightly more than 10k. I am still adapting to wider swings in my P&L, and I will continue to increase my trading size.

Note to Mentoring Program Graduates:
Work on the easier setups, and aim to find one or two good trades a day. Work on getting a high hitrate, and do not be afraid of letting the winners run. One good swing can make you more than many days of small profits. Take small victories, and make sure you catch these windfalls too.
Good luck!