Monthly Market Wrap (March 2026)
Join our Telegram channel for more market analysis & trading tips: t.me/synapsetrading
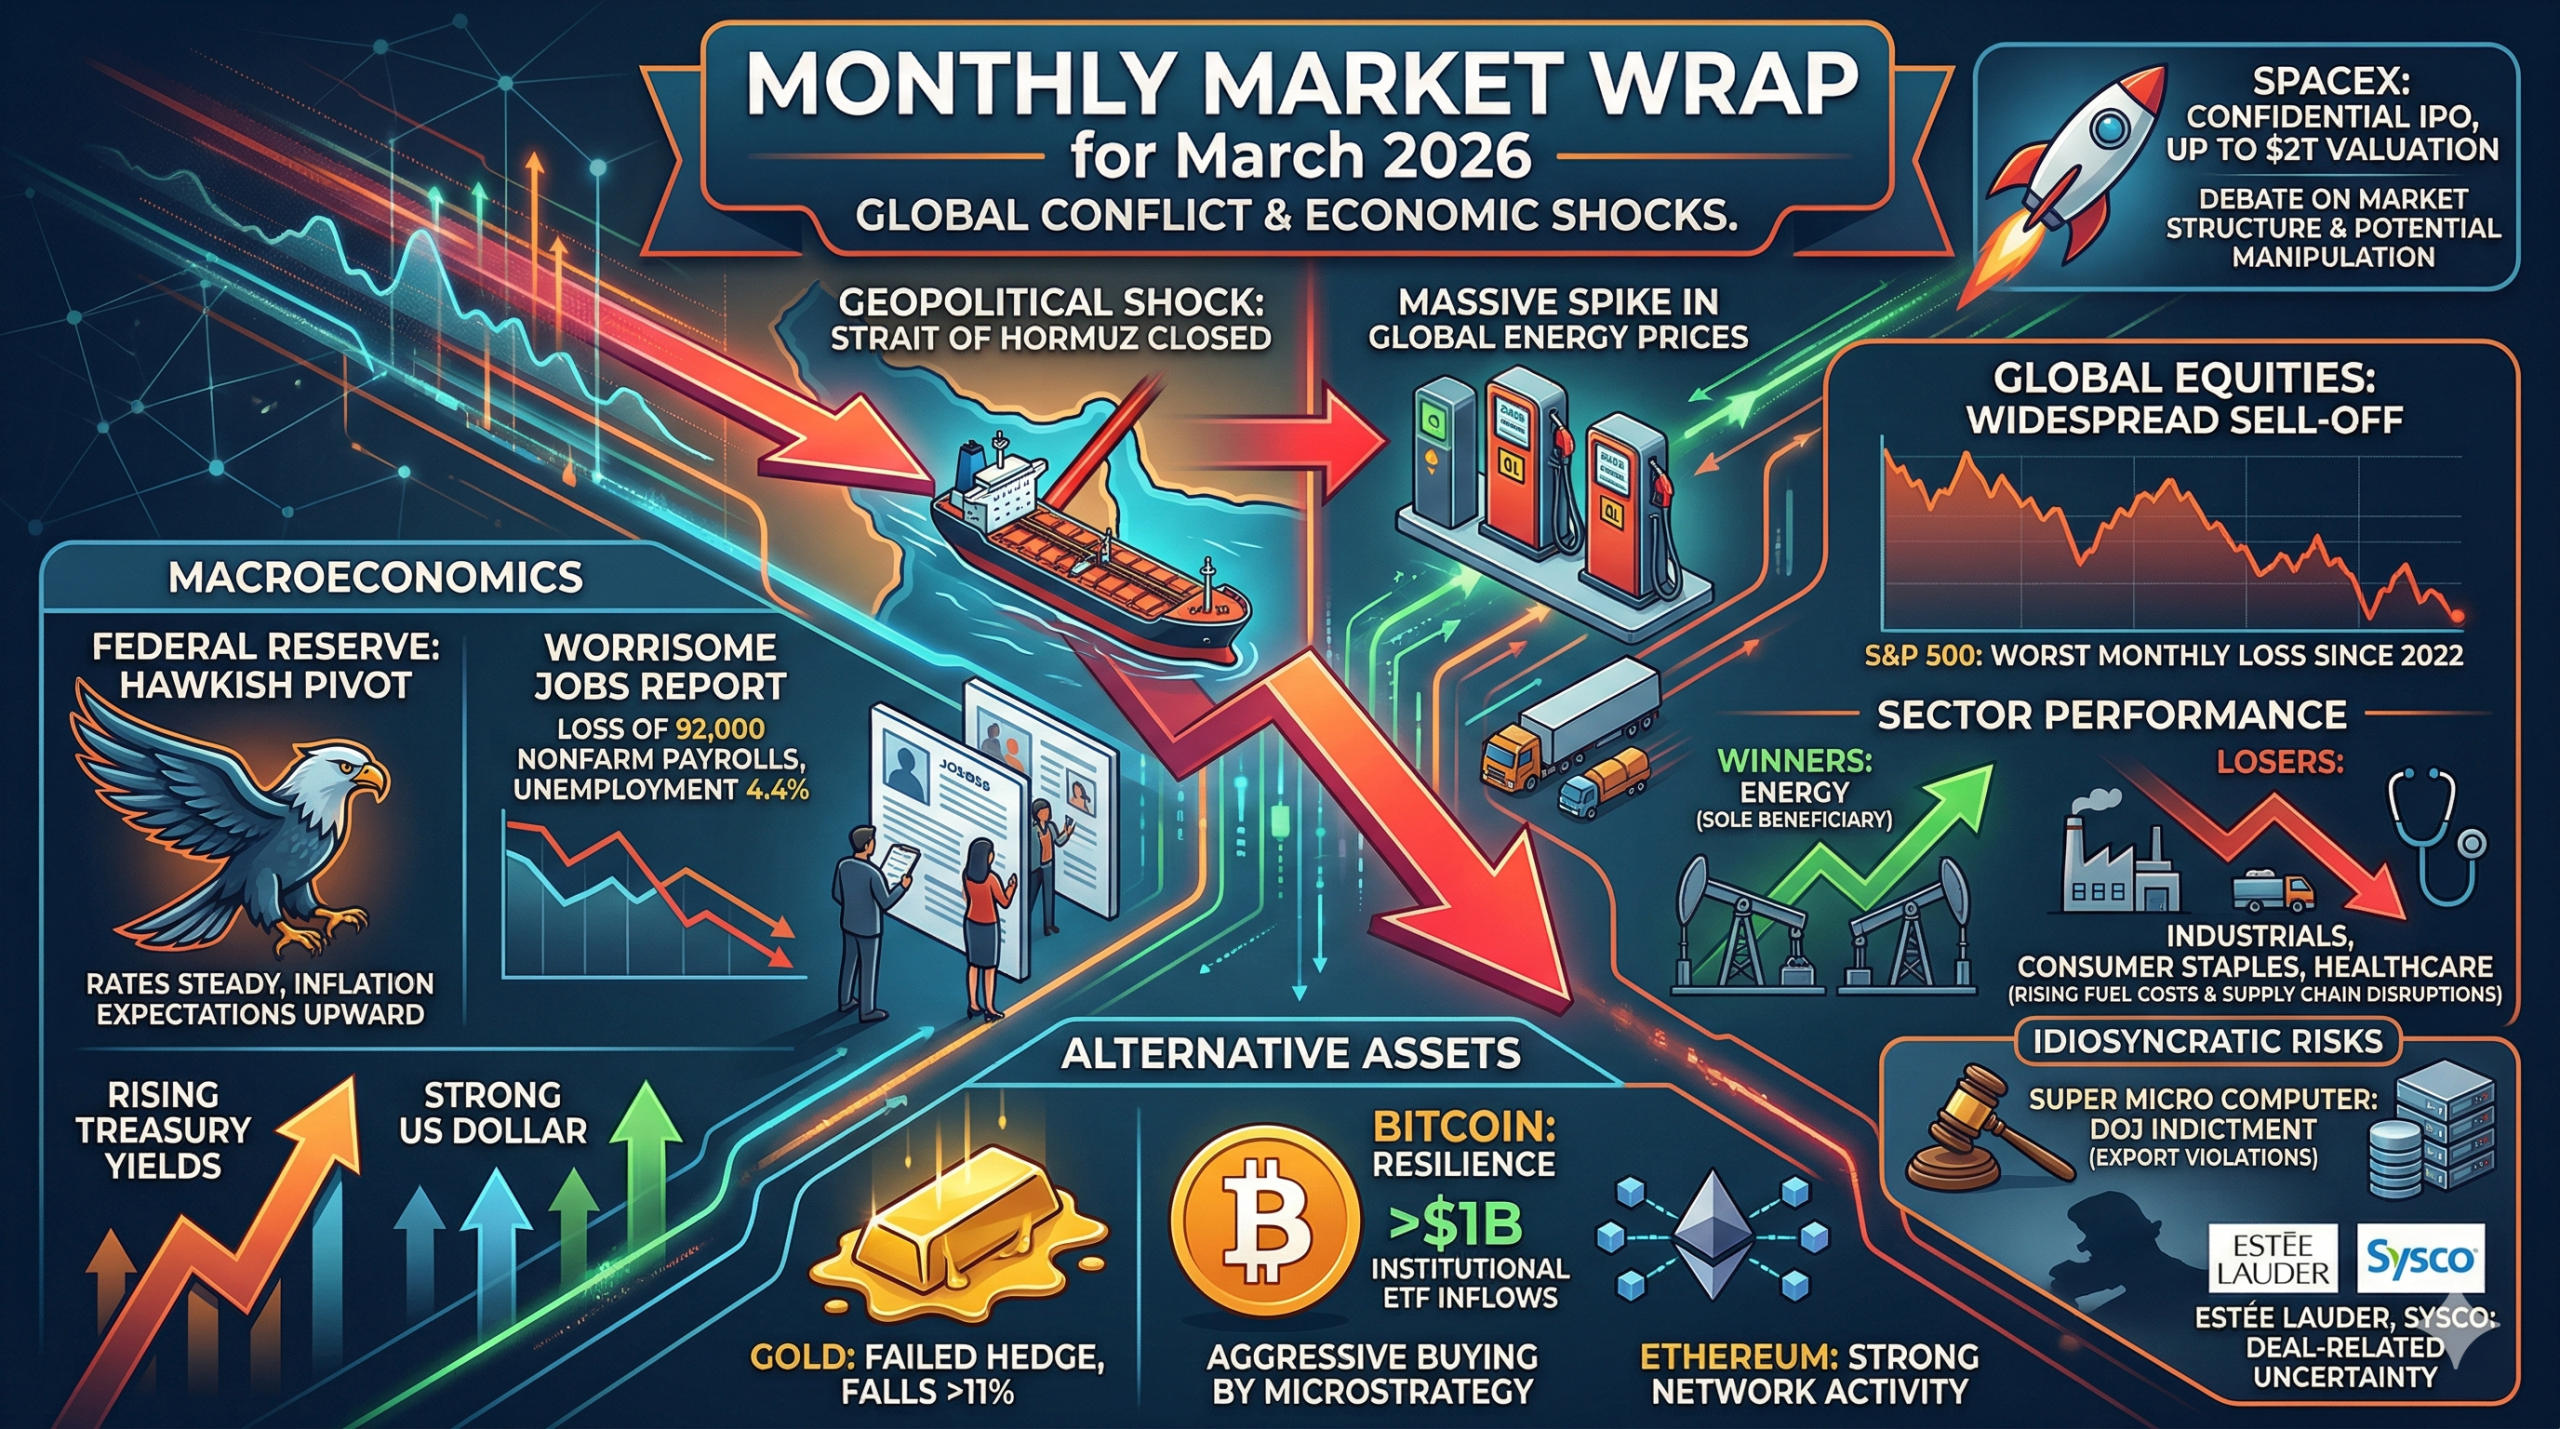
The global financial landscape in March 2026 underwent a structural transformation, as a period of relative economic resilience was abruptly superseded by a regime of heightened geopolitical volatility and supply-side inflationary impulses. The transition from a narrative dominated by the potential of artificial intelligence to one centered on kinetic conflict in the Middle East has forced a comprehensive re-valuation of asset classes. At the core of this transition was the escalation of hostilities between the United States, Israel, and Iran, which culminated in the effective closure of the Strait of Hormuz—a maritime chokepoint responsible for the transit of approximately one-fifth of the world’s petroleum and liquefied natural gas (LNG). This disruption introduced a stagflationary shock that effectively dismantled the “soft landing” consensus that had prevailed since the start of the year, leading to the worst monthly performance for the S&P 500 since September 2022.
Table of Contents
1. Geopolitical Escalation and the Maritime Blockade
The primary driver of market activity in March was the rapid widening of the conflict in the Persian Gulf. Following initial U.S. strikes on Iranian infrastructure in late February, the situation deteriorated as regional militias, including Yemen’s Houthi rebels, entered the theater of operations. The strategic response from Tehran—the blockade of the Strait of Hormuz—represented an unprecedented challenge to global energy security. Maritime tracking data revealed a staggering 96% decrease in vessel transits through the strait during the first two weeks of March compared to the prior period. This blockade removed an estimated $11.1$ million barrels of oil per day from the global market, alongside a third of the world’s fertilizer supply and significant volumes of industrial raw materials.
The impact on commodity pricing was immediate and severe. Brent crude, the international benchmark, surged by more than 60%, surpassing $100 per barrel for the first time in nearly four years and reaching intraday peaks above $118. The price action was characterized by extreme reflexivity to diplomatic rhetoric; markets experienced violent “technical bounces” on rumors of potential de-escalation, only to retreat as Iranian leadership reiterated its intent to maintain the blockade until security guarantees were met. The volatility was further exacerbated by comments from the U.S. administration, which oscillated between threats of targeted strikes on Iran’s power infrastructure and claims of “serious discussions” with a potential successor regime.
Table 1: Key Energy and Commodity Price Movements (March 2026)
| Commodity | Opening Price (Mar 1) | Peak/Closing Price (Mar 31) | Monthly Change (%) | Contextual Driver |
| Brent Crude Oil | approx $70.00 | $118.00 | +63% | Strait of Hormuz Closure |
| WTI Crude Oil | approx $68.00 | $ 102.88 | +51% | Domestic Insulation vs Global Shock |
| U.S. Gasoline (Avg) | <$3.00 | >$4.00 | +33.3% | Pass-through to Consumer |
| U.S. Diesel (Avg) | $ 3.76 | $ 5.45 | +44.9% | Freight and Logistics Pressure |
| Gold (Spot) | $5,200 | $4,664.39 | -11.2% | Real Yield Spikes vs Hedge Demand |
| Silver | approx $91.00 | $72.96 | -19.9% | Industrial Demand vs Liquidity Needs |
The second-order effects of this energy shock reverberated through the global transport and manufacturing sectors. U.S. gasoline prices breached the $4 per gallon mark nationwide for the first time since 2022, effectively acting as a regressive tax on consumer discretionary income. The jump in diesel prices was even more pronounced, rising from $3.76 to $5.45 per gallon, which threatened to reignite the “cost-push” inflation that had plagued the economy in previous cycles. For corporate America, the increase in fuel costs emerged as a significant headwind for earnings margins, particularly for industrials and consumer-facing entities.
2. Macroeconomic Indicators and the Federal Reserve’s Hawkish Pivot
The Federal Open Market Committee (FOMC) convened in mid-March under conditions of extreme uncertainty. While the committee voted 11-1 to maintain the federal funds rate at its target range of 3.50% – 3.75%, the accompanying Summary of Economic Projections (SEP) signaled a critical shift in the monetary policy trajectory. The Fed acknowledged that the geopolitical situation was “unpredictable” and that the rise in oil prices was inherently inflationary. Consequently, the “dot plot” indicated that most officials now project only one rate cut for the remainder of 2026, a significant reduction from previous expectations of a more aggressive easing cycle.
The Decoupling of Labor and Inflation Data
The economic data released in March presented a complex and often contradictory picture of the U.S. economy. The labor market showed signs of significant cooling; nonfarm payrolls for February, reported in early March, showed a decline of 92,000 jobs, sharply missing expectations for a 50,000 gain. This contraction, the most significant in the current cycle, pushed the unemployment rate up to 4.4%. Analysts attributed the weakness to a combination of factors: harsh winter weather in January and February, ongoing layoffs in the technology sector as firms reassessed AI-related spending, and a general hiring freeze in industries sensitive to energy costs.
Despite the weakening labor market, inflation remained stubbornly above the Federal Reserve’s 2% target. The Consumer Price Index (CPI) remained unchanged at 2.4% year-over-year, while core inflation held steady at 2.5%. However, the Fed’s updated projections raised the expected 2026 PCE inflation rate from 2.4% to 2.7%, acknowledging the upward pressure from energy prices and the potential for tariffs to sustain goods inflation. Chair Jerome Powell noted that while inflation had improved from its 2022 highs, the supply-side shocks from the Middle East complicated the path toward price stability.
Table 2: U.S. Macroeconomic Data Summary (March 2026)
| Indicator | Reported Value | Previous Value | Forecast/Target | Implications |
| Nonfarm Payrolls | -92,000 | Positive | +50,000 | Structural Cooling in Labor |
| Unemployment Rate | 4.4% | 4.3% | 4.4% | Reached Cycle High |
| CPI (YoY) | 2.4% | 2.4% | 2.0% | Inflation Floor Established |
| Core PCE (2026 F) | 2.7% | 2.6% | 2.0% | Upward Revision on Energy |
| GDP (2026 F) | 2.4% | 2.3% | 2.0% | Resilient Output Expectations |
| ISM Manufacturing | 52.7 | 50.9 | 50.0 | Continued Expansion |
| ISM Services | 56.1 | 53.4 | 50.0 | Strong Service Demand |
A notable divergence was observed in the Purchasing Managers’ Index (PMI) data. Both the Manufacturing PMI ($52.7$) and the Services PMI ($56.1$) showed continued expansion, suggesting that the underlying demand in the economy remains robust despite the hiring slowdown. This creates a “policy trap” for the Federal Reserve: slowing employment might normally warrant rate cuts, but the expansionary PMI data and spiking energy prices suggest that premature easing could trigger a second wave of inflation.
3. U.S. Equity Benchmarks: Correction and Sector Divergence
The S&P 500 finished March down 4.98%, closing at 6,528.52, marking its most severe drawdown in nearly four years. The correction was characterized by weak market breadth, with 84% of index components declining during the month. The Nasdaq Composite experienced a similar fate, falling 4.68% to 21,408.08 and entering technical correction territory as it closed more than 10% below its previous peak. The Dow Jones Industrial Average, while also negative, showed relative resilience with a 4% loss, aided by its heavier weighting in defensive and energy-related blue-chip stocks.
The Energy Sector as a Lone Outlier
Sector performance was almost entirely dominated by the energy complex. Energy was the only S&P 500 sector to post positive returns in March, gaining 10.26% – 12%. This outperformance was a direct result of the supply constraints in the Middle East, which improved the margins for upstream producers and refiners. Outside of energy, every other sector fell by more than 3%, with Industrials (-8.45%), Consumer Staples (-8.41%), and Healthcare (-8.11%) leading the declines.
| Sector | March Return (%) | YTD Return (%) | Dominant Theme |
| Energy | +10.26% | +30%+ | Supply Shock Windfall |
| Utilities | +10.36% (Mixed) | Positive | Defensive Rotation |
| Industrials | -8.45% | Weak | Fuel and Logistics Costs |
| Consumer Staples | -8.41% | Weak | Margin Compression |
| Health Care | -8.11% | Weak | Risk-Off De-leveraging |
| Information Tech | -3.56% | Strong | AI Reassessment |
| Cons. Discretionary | -3.56% | Weak | Falling Real Wages |
| Financials | -3.76% | Weak | Flattening Yield Curve |
The technology sector, previously the engine of market gains, faced a period of reassessment. Investors began to weigh the immense energy costs required for AI infrastructure against the broader macroeconomic slowdown. While some semiconductor firms like NVIDIA and Micron saw late-month technical recoveries, the broader sector was pressured by rising Treasury yields, which reduced the present value of future earnings for growth-oriented companies.
4. Corporate Performance and Idiosyncratic Risks
While macro themes drove the indices, several individual companies experienced significant moves due to specific news and earnings releases.
The Super Micro Computer (SMCI) Indictment
One of the most high-profile corporate events of March was the unsealing of a Department of Justice indictment against individuals associated with Super Micro Computer, Inc.. The DOJ alleged a “scheme to divert massive quantities of servers housing U.S. artificial intelligence technology to customers in China”. Specifically, the indictment named co-founder and Senior VP Yih-Shyan Liaw, Taiwan general manager Ruei-Tsang Chang, and a third-party broker, Ting-Wei Sun, as conspirators in a project that allegedly generated $ 2.5 billion in illegal revenue between 2024 and 2025.
On this news, SMCI shares plummeted 33.3% on March 20, closing at $20.53 on unusually high volume. The company attempted to distance itself by placing the employees on administrative leave and stating its cooperation with authorities, but the legal overhang triggered a series of class-action lawsuits and a massive de-rating of the stock. This event highlighted the heightened regulatory risks facing the AI hardware supply chain in an era of increasing U.S.-China tension.
M&A Activity and Consumer Staples Turmoil
The consumer staples sector was hit by both macro headwinds and deal-related uncertainty. The Estée Lauder Companies (EL) became the worst performer in the S&P 500 for March, falling 34.4%. The decline was attributed to transaction-related uncertainty following its agreement to acquire the remaining interest in Forest Essentials, occurring against a backdrop of weakening global demand for luxury personal care products.
In contrast, the food industry saw a major consolidation move as McCormick & Company announced a $29 billion agreement to merge with Unilever’s global food unit. However, the market’s reaction to large-scale M&A in March was generally skeptical; Sysco shares plunged 12% after announcing its own $29 billion acquisition of Jetro Restaurant Depot, as investors expressed concern over the company’s debt levels in a rising-rate environment.
Table 3: Significant U.S. Stock Moves (March 2026)
| Ticker | Company | March Change (%) | Reason for Move |
| LYB | LyondellBasell | +40.1% | Petrochemical Supply Disruption |
| APA | APA Corporation | +39.7% | Upstream Energy Leverage |
| SMCI | Super Micro | -29.7% | DOJ Indictment / Export Violations |
| EL | Estée Lauder | -34.4% | M&A Uncertainty / Sector Weakness |
| PARA | Paramount Skydance | -33.2% | WBD Merger Risk-Off |
| SYY | Sysco | -12.0% | Debt-Heavy Acquisition Concern |
| NKE | Nike | -14.5% | Wholesale Strategy Shift / Consumer Drag |
| XOM | Exxon Mobil | +10%+ | Record Quarterly Gain |
In the energy sector, giants like Exxon Mobil and Chevron reached multi-year highs. Exxon recorded its largest quarterly gain in history, driven by a combination of surging crude prices and expanded refining margins as the global market scrambled to replace Persian Gulf supplies.
5. The SpaceX IPO and the Evolution of Market Structure
March 2026 marked a potential watershed moment for the private markets with the confidential IPO filing of SpaceX. The company, led by Elon Musk, is reportedly targeting a valuation of between $1.75$trillion and $2 trillion, which would make it the largest public offering in history. The filing, which targets a possible June listing, comes after SpaceX’s merger with xAI earlier in the year, creating a conglomerate with dominance in launch services, satellite internet (Starlink), and advanced AI models.
Rule Changes and Index Manipulation Concerns
The potential listing has ignited a fierce debate over market integrity and the role of passive investment funds. Nasdaq recently finalized changes to the Nasdaq-100 index rules, effective May 1, 2026, which allow a newly public company of sufficient size to be added to the index in as little as 15 trading days—a drastic reduction from the previous requirement of one year. Notable investors, including Michael Burry, have characterized these changes as “structural manipulation,” arguing that they are designed to provide “exit liquidity” for insiders by forcing passive ETFs and 401(k) plans to purchase shares at a high valuation regardless of fundamentals.
On social media platforms like Reddit’s r/WallStreetBets and r/investing, sentiment was highly polarized. While some retail investors view SpaceX as a “generational wealth” play, others expressed skepticism about the company’s valuation, noting that the merger with xAI effectively bundled a cash-burning AI entity into the profitable SpaceX core. Rumors that Musk might allocate up to 30% of the IPO to retail investors—three times the typical allocation—further fueled the “meme-stock” narrative surrounding the listing.
6. Global Market Performance and Foreign Exchange
The impact of the March crisis was not confined to the United States. In fact, international and emerging markets often experienced even more severe drawdowns due to their direct exposure to energy imports and the strengthening of the U.S. dollar.
International Equities and Regional Responses
The MSCI EAFE index, representing developed markets outside the U.S. and Canada, fell 10.3%, while the MSCI Emerging Markets index dropped 13.1%. Asia was the epicenter of the decline among emerging markets, as countries like South Korea and Japan are heavily reliant on the Strait of Hormuz for their energy needs. Japan’s Nikkei 225, which had been a top performer earlier in the year, saw a late-month slide as the rising cost of energy imports threatened to undermine the country’s fragile economic recovery.
In contrast, Canada’s S&P/TSX Composite Index showed remarkable resilience, gaining 7.57% in February and remaining stable through March. This was largely due to the TSX’s heavy weighting in materials and energy, as well as its status as a “safe haven” for investors seeking exposure to North American commodities away from the geopolitical theater.
| Index | March/Q1 Return (%) | Status | Key Driver |
| S&P 500 (USA) | -4.98% | Correction | Worst Month since 2022 |
| TSX (Canada) | +7.57% (Feb/Mar) | Record Highs | Commodity Exposure |
| Nikkei 225 (Japan) | -0.3% (late Mar) | Consolidation | Energy Import Costs |
| Euro Stoxx 50 | -1.5% (late Mar) | Under Pressure | ECB Hawkishness |
| MSCI EM | -13.1% | Bearish | Oil Dependency / Dollar Strength |
European markets faced a difficult month as rising energy prices revived concerns about “second-round” inflation effects, potentially forcing the European Central Bank (ECB) into a more hawkish stance. The STOXX 600 fell 1.1% late in the month, with cyclicals and travel-related stocks bearing the brunt of the sell-off due to rising fuel costs.
Forex and the U.S. Dollar Index (DXY)
The U.S. Dollar Index (DXY) acted as a primary beneficiary of the flight-to-quality trade. The index reached peaks near $120.89$ in late March, as investors sought the safety of the world’s reserve currency amid global instability. The dollar’s strength was further supported by the Fed’s hawkish pivot and the perception that the U.S. economy, as a net energy exporter (WTI), was better positioned to weather the Hormuz closure than Europe or Asia.
The strength of the dollar put immense pressure on other major currencies. The Euro (EUR/USD) traded near 1.153, while the Japanese Yen (^USDJPY) saw significant volatility as the Bank of Japan struggled to balance currency intervention with the inflationary impact of high oil prices.
7. Fixed Income and the Bond Market Sell-Off
Traditionally, investors flock to sovereign bonds during times of geopolitical crisis. However, the unique nature of the March shock—a supply-side inflationary event—broke this relationship. Treasury yields rose sharply as markets factored in a higher floor for inflation and a more restrictive Federal Reserve.
The yield on the 10-year Treasury rose from 3.97% in late February to peaks as high as 4.44% in March, before settling near 4.32%. This move up in the “risk-free rate” had immediate implications for the broader economy, driving mortgage rates and corporate borrowing costs higher. The 2-year yield rose even more dramatically, by 42 basis points to 3.79%, leading to a “bear flattening” of the yield curve. This structural shift suggests that the bond market is bracing for a period of sustained high rates rather than a temporary spike followed by a quick reversal.
| Treasury Term | Feb Yield (%) | Mar Peak/End Yield (%) | Basis Point Change |
| 2-Year | approx 3.37% | 3.79% | +42 bps |
| 10-Year | 3.97% | 4.44% | +38 to +47 bps |
| 30-Year | approx 4.50% | 4.88% | +38 bps |
In the private credit markets, cracks began to appear in the software lending sector. The average bid for software-related private loans declined significantly, reflecting a broader reassessment of technology valuations and the sector’s vulnerability to rising funding costs. While the impact was not deemed an “existential threat” to the asset class, it highlighted the uneven pressure across different segments of the credit market.
8. Digital Assets: Bitcoin’s Emergence as a “Crisis Asset”
In a surprising turn of events, the cryptocurrency market, specifically Bitcoin (BTC) and Ethereum (ETH), displayed a higher degree of resilience than traditional safe havens like gold in March 2026. Bitcoin broke a five-month losing streak, trading between $67,000 and $73,000 for much of the month.
Institutional Flows and the “Saylor Effect”
The stabilization of Bitcoin was driven largely by massive institutional accumulation. U.S. spot Bitcoin ETFs recorded net inflows of over $1.1 billion in a single week in early March, with BlackRock’s IBIT capturing more than half of the total volume. This influx of capital occurred as gold ETFs saw record outflows, suggesting a structural rotation of institutional “inflation-hedge” capital from precious metals to digital assets.
MicroStrategy continued its relentless accumulation strategy, adding over 40,000 BTC in the first half of March alone. As of March 2026, the company held over 720,000 BTC, acting as a psychological and structural backstop for the market. Analysts noted that Bitcoin was beginning to be viewed as a “safe-haven asset” due to its lack of direct exposure to maritime transit routes or Persian Gulf infrastructure.
Ethereum: Network Strength vs. Price Pressure
Ethereum’s performance was more nuanced. While the price hovered near $2,100, experiencing some selling pressure in the derivatives market following aggressive rhetoric from the U.S. administration, the network’s underlying fundamentals remained robust. Ethereum saw near-record levels of daily active addresses (over 788,000) and new account creation, suggesting that decentralized finance (DeFi) and smart contract activity were continuing unabated by the macro turmoil. However, institutional demand for Ethereum ETFs appeared to lag behind Bitcoin, with some funds seeing modest outflows as investors favored the simpler “digital gold” narrative of BTC during the crisis.
| Asset | Price (Mar 31) | 30-Day Change (%) | Institutional Signal |
| Bitcoin (BTC) | approx $67,500 | Stable / Positive | ETF Inflows / MSTR Buying |
| Ethereum (ETH) | approx $2,050 | +2.1% (Mixed) | On-chain Highs / ETF Outflows |
| Gold (Spot) | $4,664.39 | -11.2% | Significant ETF Outflows |
The divergent performance of Bitcoin (+2% to +3.3%) and Gold (-11%) represents a potential paradigm shift in crisis management for portfolio managers. Historically, the inverse would have been expected, but the combination of high real yields and the digitalization of finance has created a new set of market dynamics.
9. Summary of Market Drivers and Strategic Outlook
March 2026 was a month of deep transition, where geopolitical risk became the primary determinant of asset values, overwhelming the fundamental strength observed in the early part of the year. The effective closure of the Strait of Hormuz acted as a “black swan” event, driving oil prices to levels that challenged the global disinflation narrative and forced the Federal Reserve into a hawkish stance despite a weakening labor market.
The correction in U.S. equities was broad-based but highly uneven. While the energy sector reached record highs, the rest of the market—particularly consumer-facing and tech-heavy segments—was pressured by rising fuel costs and higher Treasury yields. Corporate scandals, exemplified by the SMCI indictment, further eroded investor confidence in the technology supply chain. Meanwhile, the confidential filing for the SpaceX IPO signaled a massive shift in market structure, with multi-trillion dollar private entities preparing to enter the public domain under new, fast-track index rules.
Globally, the strengthening of the U.S. dollar and the high cost of energy imports created a difficult environment for emerging markets and developed Asia. In contrast, commodity-rich Canada emerged as a regional winner. In the alternative asset space, the rotation from gold into Bitcoin suggests that institutional investors are increasingly looking to digital assets for protection against sovereign and geopolitical shocks that traditional hedges are failing to mitigate.
Looking toward the second quarter of 2026, the primary question for investors is whether the current geopolitical tensions will result in a permanent shift in energy logistics or if a diplomatic resolution can restore the status quo. Until the Strait of Hormuz is reopened and energy prices stabilize, volatility is expected to remain elevated, and the Federal Reserve will likely remain constrained in its ability to support the economy through rate cuts.
 Our flagship mentoring program is suitable for both beginners and advanced traders, covering the 4 strategies which I used over the past 15 years to build up my 7-figure personal trading portfolio.
 If you're looking for the best trading opportunities every day across various markets, and don't want to spend hours doing the research yourself, check out our private Telegram channel!

Leave a Reply
Want to join the discussion?Feel free to contribute!