

Using Trading Indicators to Exit Trades for Risk Management
Want the daily routine? Get the free 15-Minute Swing Trader’s Checklist. Get it free →
In trading, many focus on when to enter a trade, but knowing when to exit is just as critical, if not more.
Exiting a trade at the right time can lock in profits, prevent losses, and effectively manage risk.
One of the most effective ways to decide when to exit a trade is by using technical indicators.
These indicators help traders manage risk by setting clear, objective criteria for when to close a position.
To use trading indicators for exits, you need to focus on these key principles:
- Choose indicators that align with your risk management goals.
- Use a combination of trend, momentum, and volatility indicators.
- Set clear exit rules based on indicator signals.
Let’s explore these principles in detail.
Choose Indicators Aligned With Risk Management Goals
The first step is to choose the right indicators that help you manage risk. Not all indicators are suitable for exit strategies, and some are better for identifying when to get out of a trade than others. The goal is to pick indicators that align with how you want to manage risk—whether it’s locking in profits, cutting losses, or both.
For example:
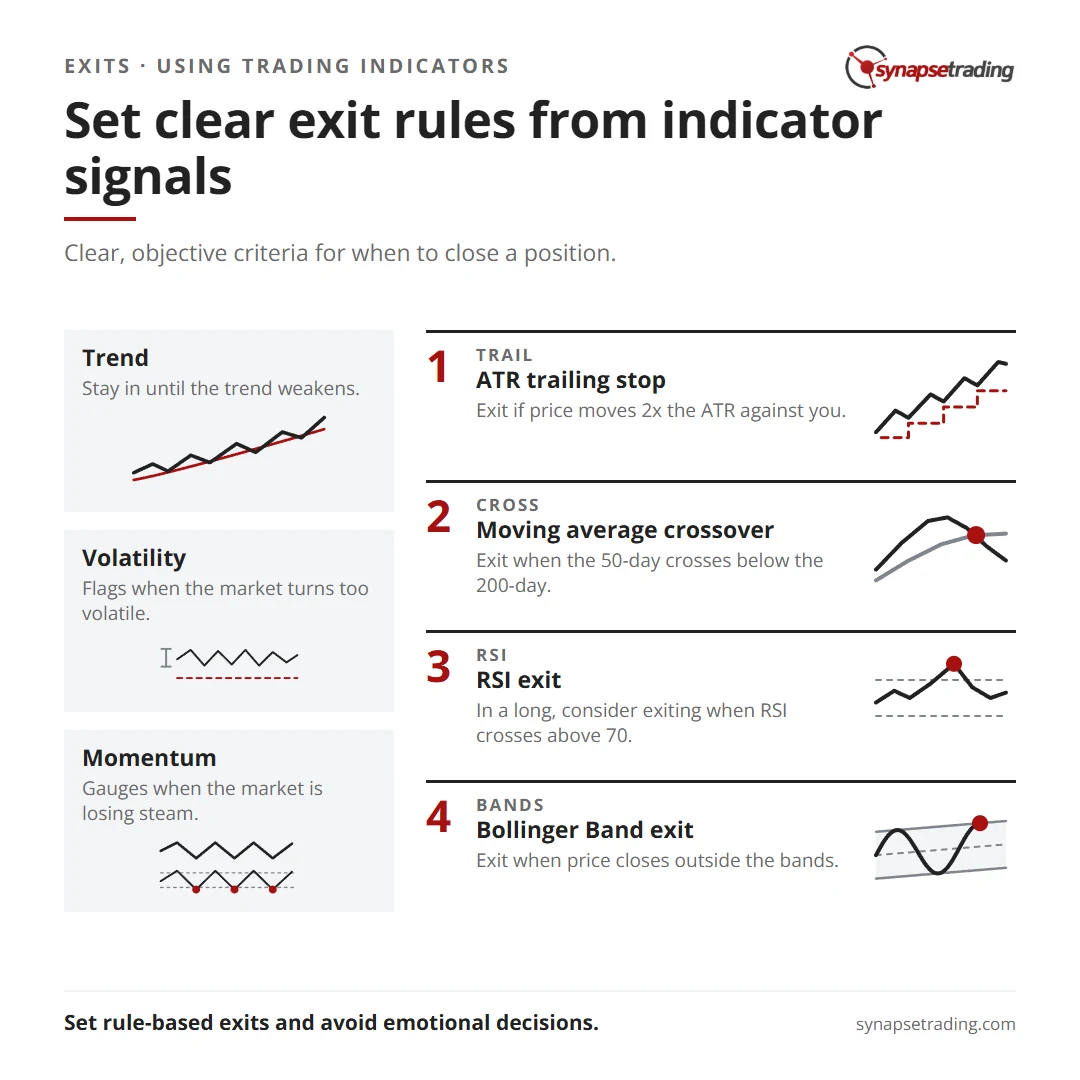
- Trend indicators can help you stay in a trade until the trend weakens.
- Volatility indicators help identify when the market is becoming too volatile and signaling potential danger.
- Momentum indicators can help you gauge when the market is losing steam, prompting an exit.
Categorizing Indicators for Exiting Trades
Understanding the categories of indicators can help you build a solid exit strategy. Each category serves a different purpose when managing risk.
- Trend Indicators: These help you stay in a position while the trend is strong but also signal when the trend is weakening. Examples include Moving Averages (like the 200-day or 50-day) and the MACD (Moving Average Convergence Divergence).
- Volatility Indicators: These help you gauge when a market is experiencing high or low volatility. This can signal when it’s time to get out if the risk of staying in the trade becomes too high. Common indicators include Bollinger Bands, ATR (Average True Range), and the Keltner Channel.
- Momentum Indicators: These help identify when a market is overbought or oversold, which could indicate that the price might reverse soon. Common momentum indicators include the RSI (Relative Strength Index) and Stochastic Oscillator.
Setting Exit Rules Based on Indicators
Once you’ve selected your indicators, you need to define how you will use them to exit trades. Clear exit rules help ensure that your decisions are not based on emotions but on objective signals from the market.
Here are a few examples:
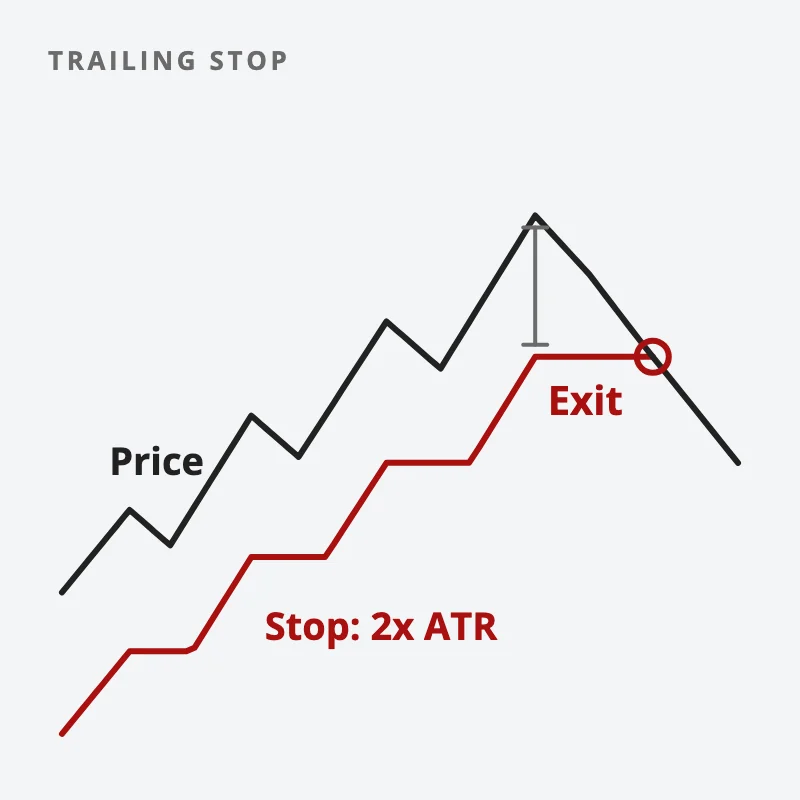
- Trailing Stop Using ATR: Use the Average True Range (ATR) as a trailing stop indicator. ATR measures market volatility, and you can set a stop loss at a multiple of the ATR. For example, if the ATR is 20 points and you set a stop loss at 2x the ATR, you would exit the trade if the market moves 40 points against you.
- Moving Average Crossover: If you are following a trend, you could exit a trade when a shorter-term moving average crosses below a longer-term one. For example, if the 50-day moving average crosses below the 200-day moving average, it could signal that the uptrend is over, prompting an exit.
- RSI Exits: When using RSI, you can exit a trade when the RSI moves into overbought (above 70) or oversold (below 30) territory. For instance, in a long trade, you might consider exiting when the RSI crosses above 70, as this could indicate that the price is nearing a peak.
- Bollinger Bands for Exit: If you’re in a trade and the price hits the upper or lower Bollinger Band, it can signal that the price has moved too far and may soon reverse. Traders often exit when the price closes outside of these bands.
Indicator Combinations for Exiting Trades
Here are a few examples of how combining different indicators can improve your exit strategies:
1. ATR and Moving Averages
Using the ATR as a trailing stop in combination with moving averages helps lock in profits while following the trend. The moving averages (such as a 50-day and 200-day) can guide your decision to stay in or exit based on trend direction, while the ATR ensures you have a safety net by trailing the stop.
2. Bollinger Bands and RSI
Bollinger Bands can give you an idea of volatility and when a price may be overextended. When combined with the RSI, you can confirm whether the price is truly overbought or oversold, giving you a solid basis to exit your trade.
3. MACD and Stochastic Oscillator
The MACD helps to spot trend reversals and can be used to exit when the MACD line crosses below the signal line. Adding the Stochastic Oscillator can help you identify when momentum is weakening, providing another layer of confirmation for your exit.
Example of Using Indicators to Exit Trades
Here’s an example of how to use these indicators to exit a trade in the forex market:
Let’s say you are long on EUR/USD, and you’ve been following the trend with the help of a 50-day moving average. As the price rises, the RSI begins to move into overbought territory (above 70). At the same time, the price closes outside the upper Bollinger Band, signaling overextension.
At this point, your exit strategy could be to close your position as soon as the RSI moves back below 70 and the price dips back inside the Bollinger Bands. This exit strategy locks in profits while managing the risk of a reversal.
Concluding Thoughts
Using trading indicators to exit trades is an essential part of risk management.
Whether you’re focusing on preserving profits or cutting losses, combining indicators from different categories—trend, momentum, and volatility—can provide the necessary insights to make objective exit decisions.
The key to success is setting clear, rule-based exits and avoiding emotional decisions.
By testing different combinations in a demo account, traders can refine their strategies and develop a more disciplined approach to managing their trades.
Want the daily routine? Enter your email for the free 15-Minute Swing Trader's Checklist.
Free 5-page PDF, then occasional trading emails. Education only, not financial advice. Unsubscribe anytime. Kit stores your email in the US: see our privacy policy.
Want to learn the full method? The Trading Mastery Program teaches the 4 strategies I have traded since 2011. It suits beginners and experienced traders.
Rather follow the trades as they happen? Daily Trading Signals is our Telegram channel: my trade ideas with entry, stop and exit, and every trade is public.
Questions about this post? Ask in the free Telegram channel →
Educational content only, not personalised financial advice. Trading carries risk, including loss of capital. Past performance is not indicative of future results. Synapse Trading is not licensed or regulated by MAS.

