

Cup and Handle Pattern: How to Trade It and Avoid the False Breakouts
Want the daily routine? Get the free 15-Minute Swing Trader’s Checklist. Get it free →
By Spencer Li, CFTe · Last updated: 17 October 2026
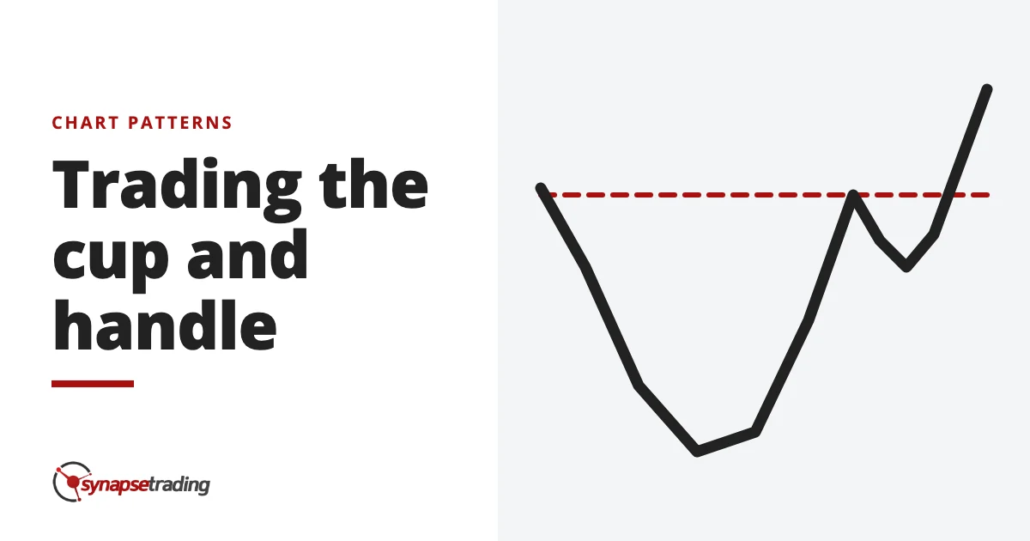
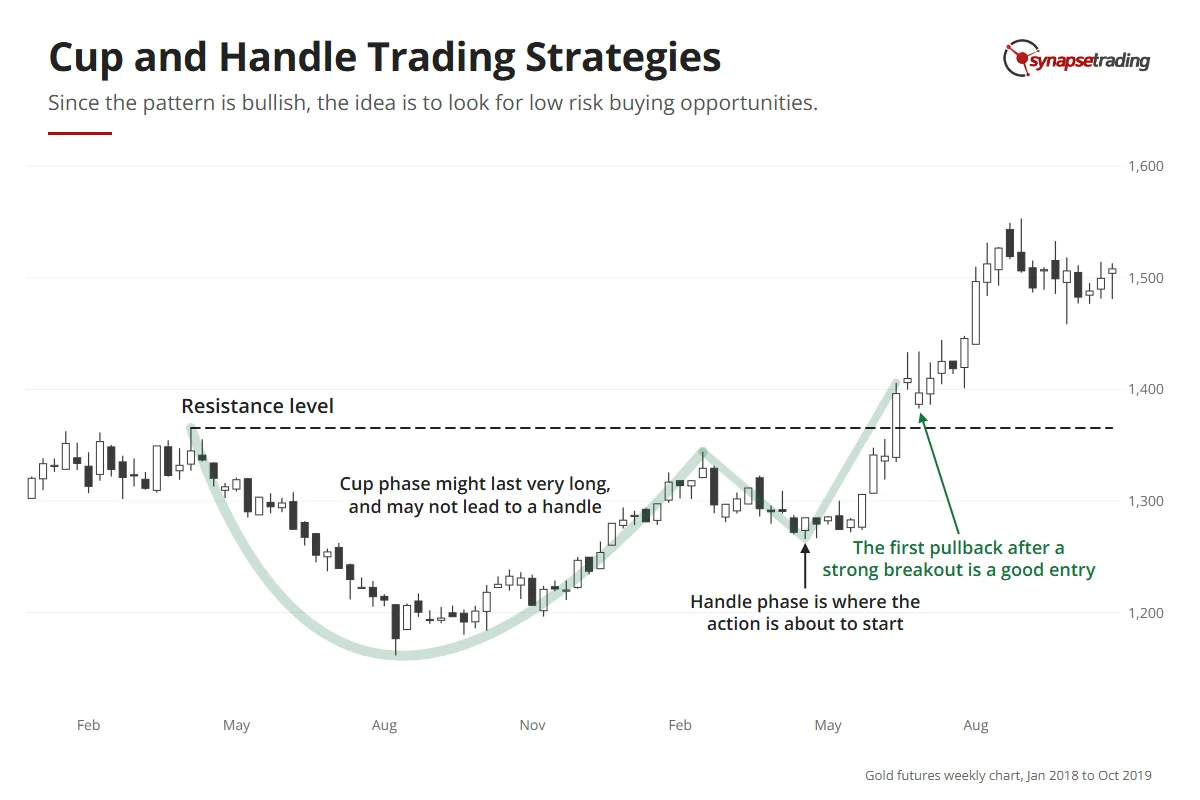
The cup and handle is a bullish chart pattern built from two bases. First comes a wide, rounded U called the cup, where price slowly climbs back to an old high, and then a small, shallow dip called the handle forms just under that high before price finally breaks out above it.
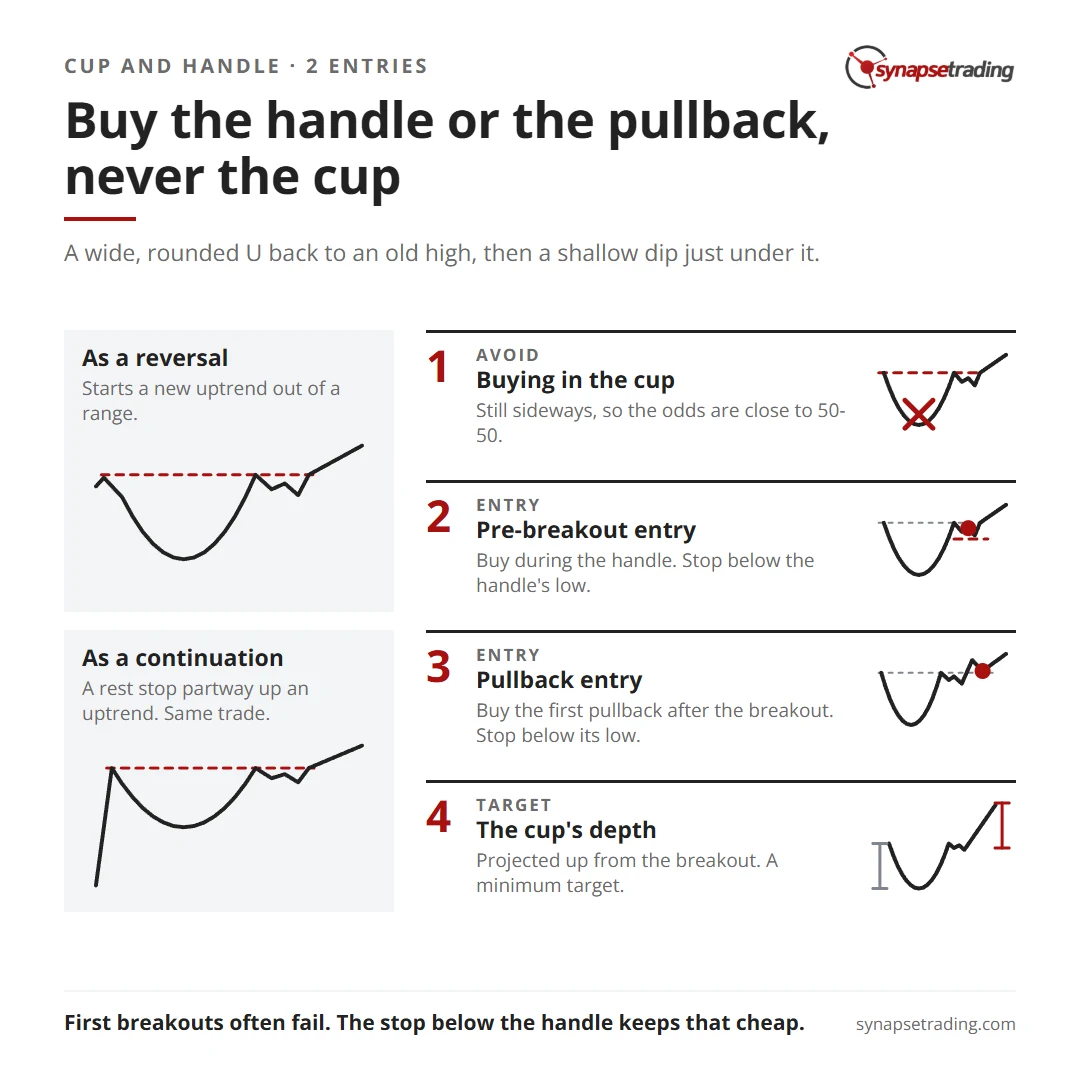
There are two good places to buy it. You can enter during the handle, just before the breakout, with a stop below the handle’s low, or you can buy the first pullback after the breakout. Your minimum target is the depth of the cup, projected up from the breakout. The one place I would avoid is the cup itself, where the price looks cheapest and the odds are close to a coin toss.
What is a cup and handle pattern?
William O’Neil, the investor who made this pattern famous, charted 100 of the biggest winning US stocks from the 1880s to 2008 and counted 105 cup-with-handle examples among them. That is more cups than stocks.
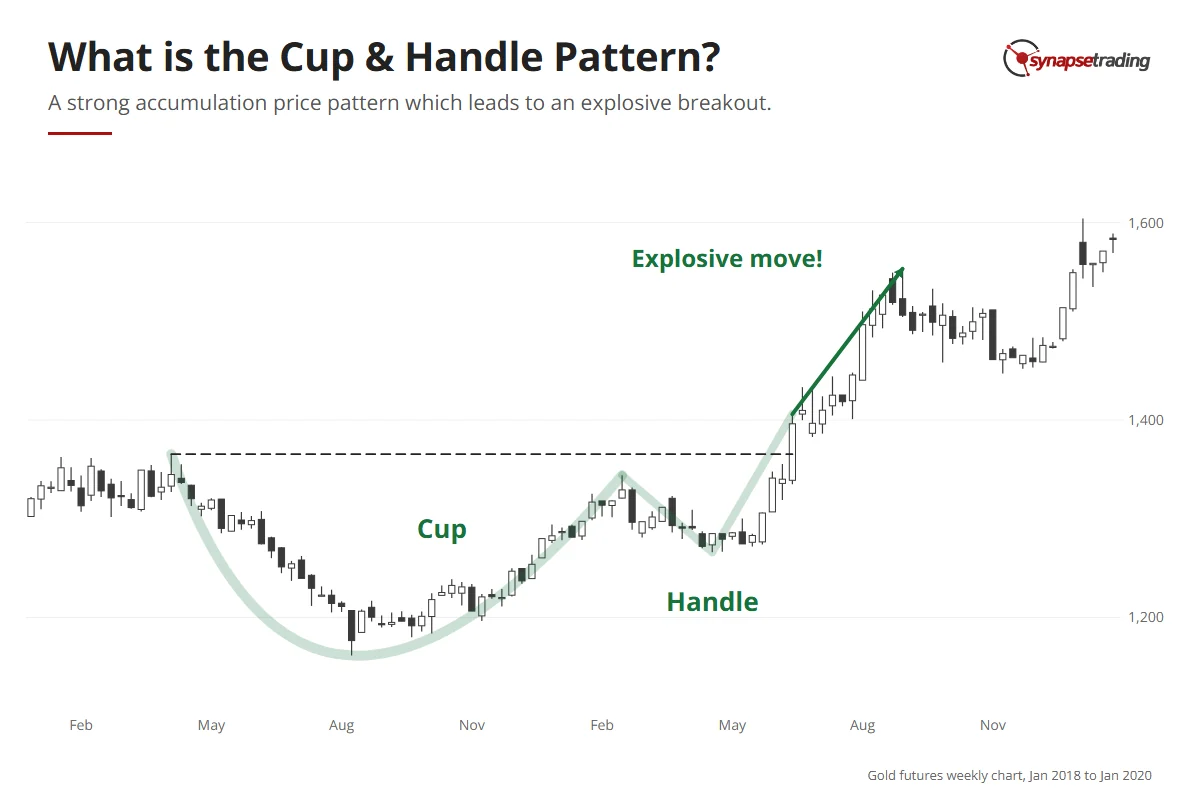
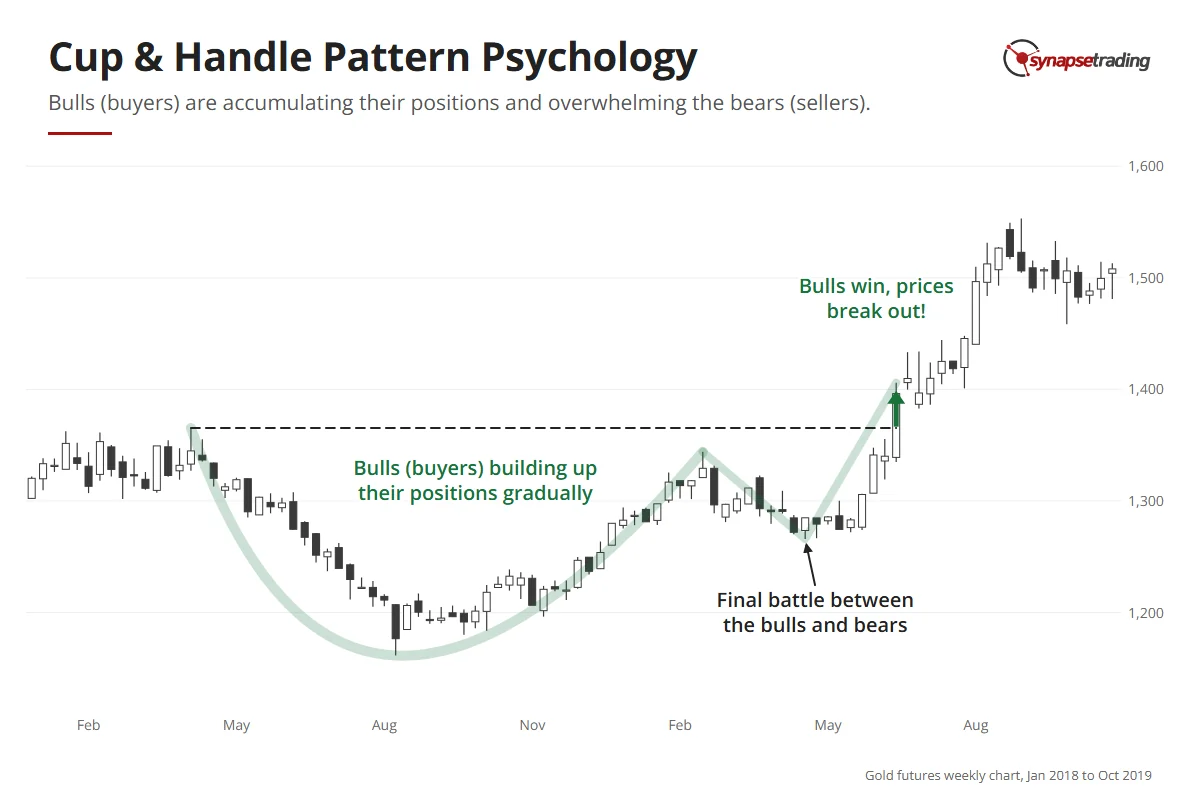
The cup and handle is an accumulation pattern, which means buyers are quietly building positions through a long stretch of sideways trading. You usually notice it only once the cup is well underway. O’Neil’s test is that the bottom should round into a U rather than a narrow V.
The handle confirms it. It is a short dip just under resistance, the level where sellers have turned the market back before, and I think of it as pushing down on a loaded spring to build a little more pressure right before the release.
Is the cup and handle a reversal or a continuation pattern?
In my weekly outlook on 18 December 2025, I pulled up IWM, the fund that tracks the Russell 2000 index of smaller US companies. While the bigger indices climbed, IWM had spent years carving out a big curve, because small companies suffer more from high interest rates, and only once rates started coming down did they start to move. I said on the video that it looked like “a big sort of cup and handle”, and admitted it was “not a very nice one, but the idea is there”.
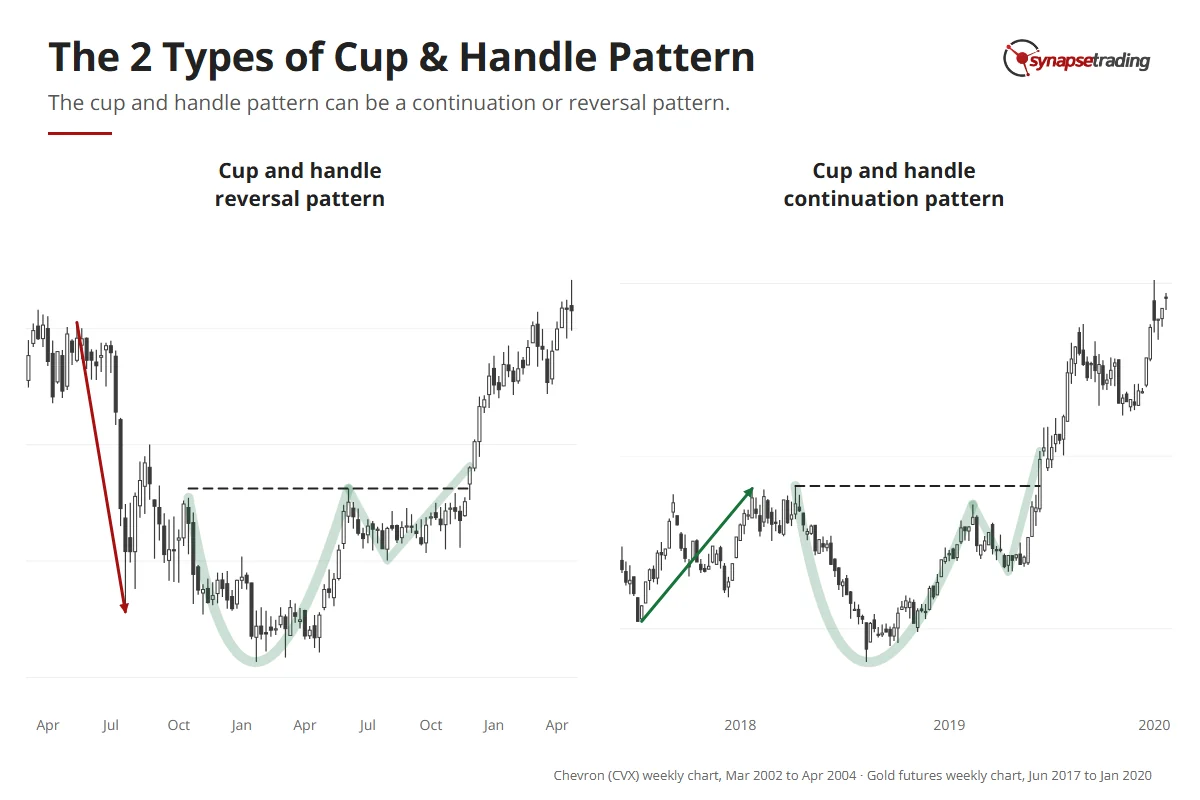
IWM came into that pattern going sideways, with no real trend either way, and that is why I file the cup and handle under reversal patterns. It usually kicks off a new uptrend out of a ranging market, as I describe in my guide to continuation and reversal patterns.
Plenty of traders call it a continuation pattern, and they have a point. O’Neil himself wants a prior uptrend of at least 30% before the cup forms, so in his version the cup is a rest stop partway up an advance that is already running. The shape is the same either way, and so is the trade. It is bullish in both cases, so the whole job is finding a low-risk place to buy.
What is happening inside the cup and the handle?
Why does the pattern look like this at all? Because it is a slow change of control.
As the earlier move fades, sellers thin out and buyers start picking up shares a little at a time. The two sides are almost balanced while this goes on, and that balance draws the wide, flat bottom of the cup. Sellers are no longer in charge. Buyers have not quite taken over.
The handle is the final fight. By then buyers have the upper hand, and every dip that holds attracts a few more of them. O’Neil says a healthy handle drifts slightly lower and ends with a shakeout, where price slips under an earlier low and scares out the last nervous holders, and he notes that volume often dries up near the handle’s lows. Once those last sellers give up, buyers take full control, and the breakout happens.
Watching a handle form takes minutes a day, and my free 15-minute swing trader checklist is the daily routine I run myself.
Why should you avoid buying during the cup?
Imagine you have found a stock halfway through its cup. The price is far below the old high, the curve is turning up, and buying now feels like the bargain of the year.
I would still skip it. Why? During the cup the market is still sideways, so the odds are close to 50-50 and there is no real edge yet. The cup can also outlast your patience. O’Neil’s cups took 7 to 65 weeks, most of them three to six months, while the IWM cup on my chart took three years, from its high in November 2021 to the retest in November 2024. Some cups never grow a handle at all.
Hence, it makes more sense to keep your capital free and only commit when the action is about to start. You give up a little on price, and in return your money is never stuck for months in a pattern that might not finish.
How do you trade the cup and handle?
Both strategies aim at the final fight just before the breakout, where the large moves tend to start. The only difference is whether you take your seat just before it or just after.
| What you do | Best when | Stop | |
|---|---|---|---|
| 1. Pre-breakout entry | Buy during the handle, close to resistance | You can watch the handle form | Below the handle’s low |
| 2. Pullback entry | Buy the first pullback after the breakout | You missed the handle, or the breakout was too fast | Below the low of the pullback |
Strategy 1: the pre-breakout entry
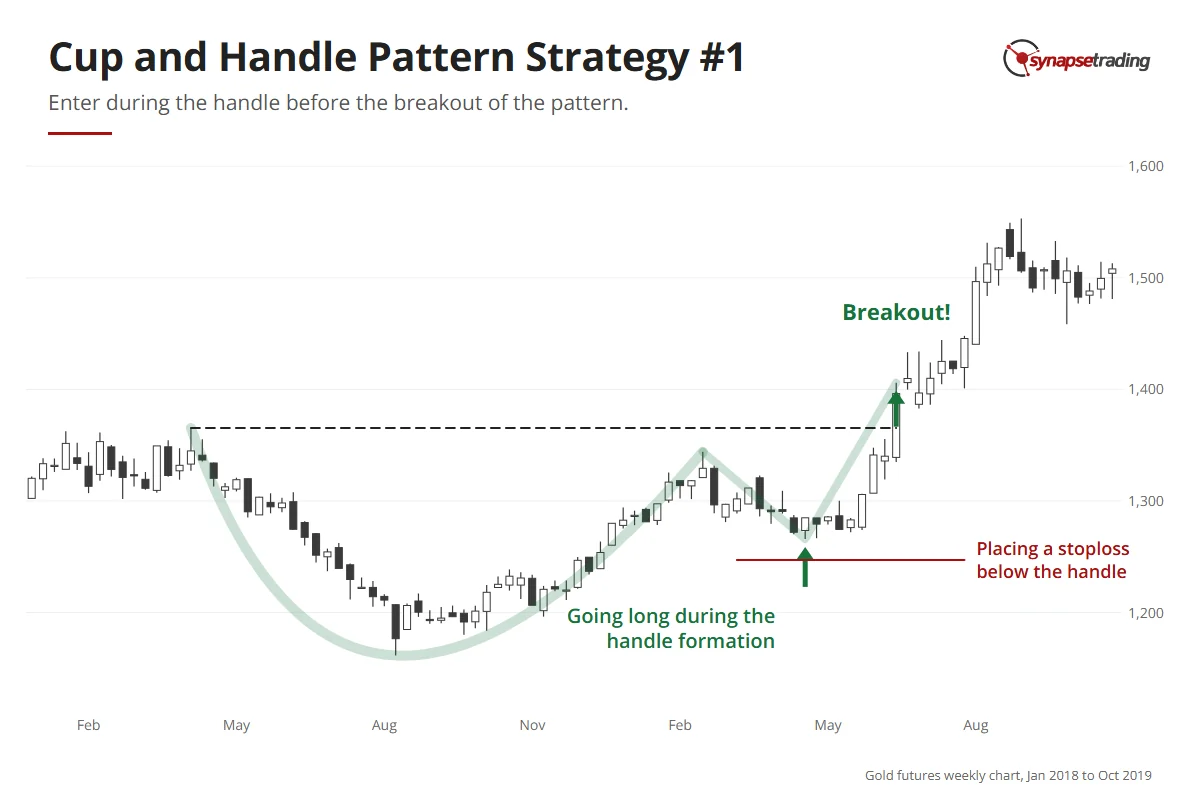
Through the cup, buyers have been building pressure. As the handle forms, the breakout is close. Once it fires, price and volume tend to surge, and a clean entry gets much harder to find.
So you enter during the handle and put your stop below the handle’s low. The handle is usually small next to the cup, so the distance to your stop stays small too. O’Neil puts numbers on this. In a bull market a sound handle stays within 8% to 12% of its peak, sits in the upper half of the base and takes more than a week or two to form. A handle that creeps upward along its lows is what he calls a wedging handle, and he counts it among the patterns most likely to fail.
Strategy 2: the pullback entry
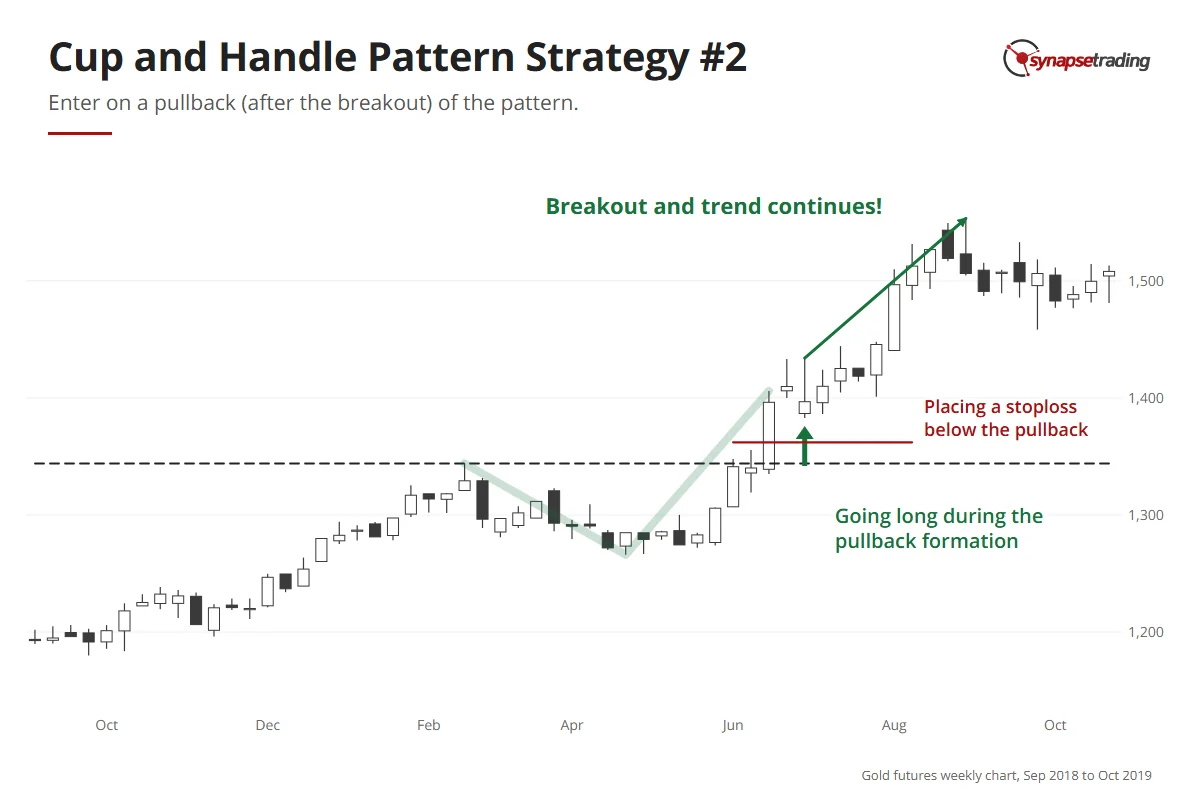
Sometimes the breakout is too fast, or you simply missed it. After such a long build-up, the move usually has more than one leg, so the first pullback after the breakout is a good second chance, and your stop goes at the bottom of that pullback. The pause often looks like a bull flag, a short downward drift after a sharp move.
A second chance works for people who are already in, too. On 9 October 2025, I showed CIBR, a cybersecurity fund, in my weekly outlook. I had held it since 29 September, and it had just pushed out of what I called “kind of like a cup and handle breakout”. So I told viewers who had missed it that this was “a second chance to buy it”, and said I had just added to my own position. If you entered during the handle, this is where you add.
The second chance does not always come, though. On 17 December 2025, I showed UBS, which I said was “not really a cup and handle because there’s no handle”. I had been hoping for a pullback to enter, and then it gapped up about 5% in one session, which I admitted I had not expected. O’Neil notes that cups without a handle fail somewhat more often, although many still work. A breakout that never pauses gives the pullback trader nothing to buy, so you let it go.
Why do some cup and handle breakouts fail?
On 16 November 2025, a trader on Reddit’s r/technicalanalysis asked: “Why would cup and handle confirm but then seemingly fail?” They had bought what looked like a confirmed breakout, and a few weeks later price was back at the bottom of the handle.
Every pattern trader asks this eventually, usually with some regret. Part of the answer is that first attempts often fail, because the whole pattern is one long attempt to clear the same resistance line, and the early pokes above it are mostly probes for weakness.
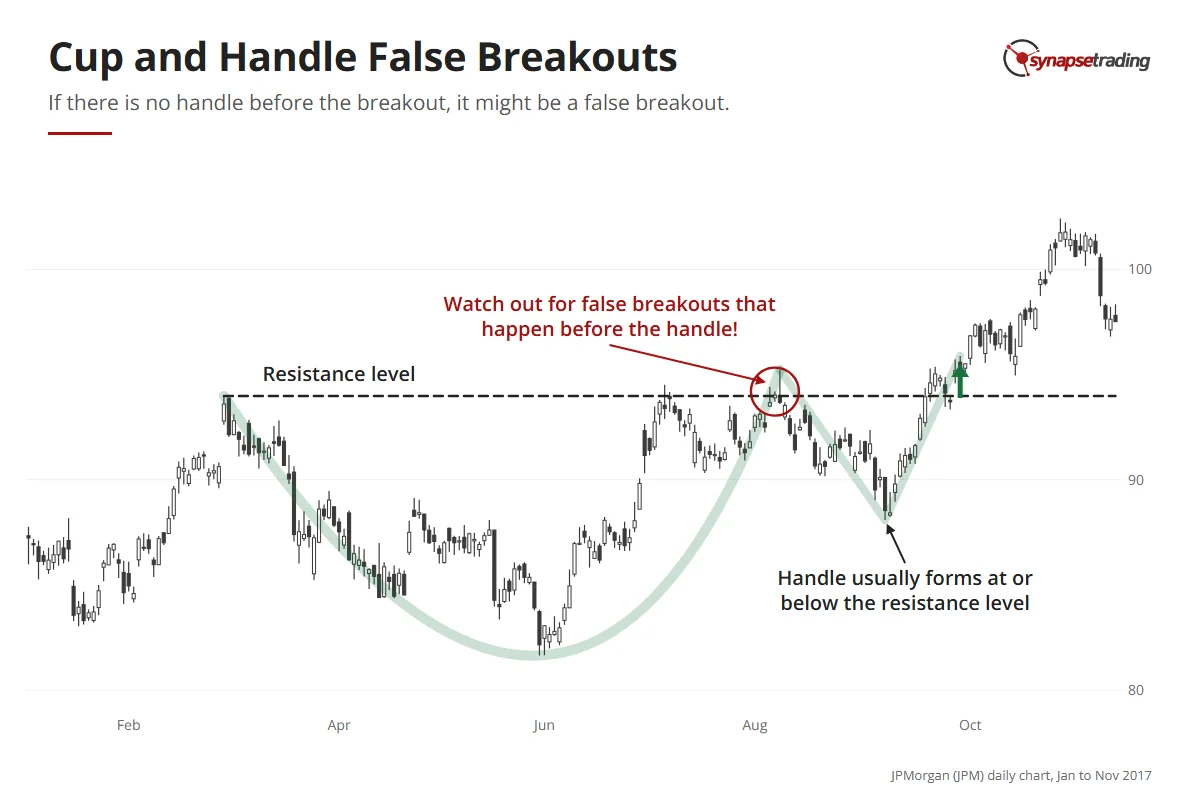
IWM showed this on a big scale. In November 2024 it pushed a fraction above its November 2021 high, and anyone who bought that breakout then watched it fall about 30% by April 2025. That drop became the handle, and a deep one, far past the 8% to 12% that O’Neil likes to see, so price did not close clear of both old highs until early October 2025, nearly four years after the original high.
Do note that some pullback is normal. O’Neil estimates that winning stocks dip back to their buy point 40% to 60% of the time. A drop to the bottom of the handle is different. That is the floor the pattern was built on, and the stop sits there so one bad breakout cannot wipe out the gains from several good ones.
So if that trader’s stop sat below the handle, the pattern still did its job. It told them they were wrong, for a cost they knew in advance. Personally, I would rather take that small loss quickly than hold on and hope. Hope is how a small loss grows into one that blows up an account.
Hence, I like this setup most when price has already been turned back at the same level once or twice, because each failed attempt uses up a few more of the sellers waiting there.
If you want a routine that keeps you waiting for the handle, the free 15-minute swing trader checklist is the one I use.
How do you set a profit target for a cup and handle?
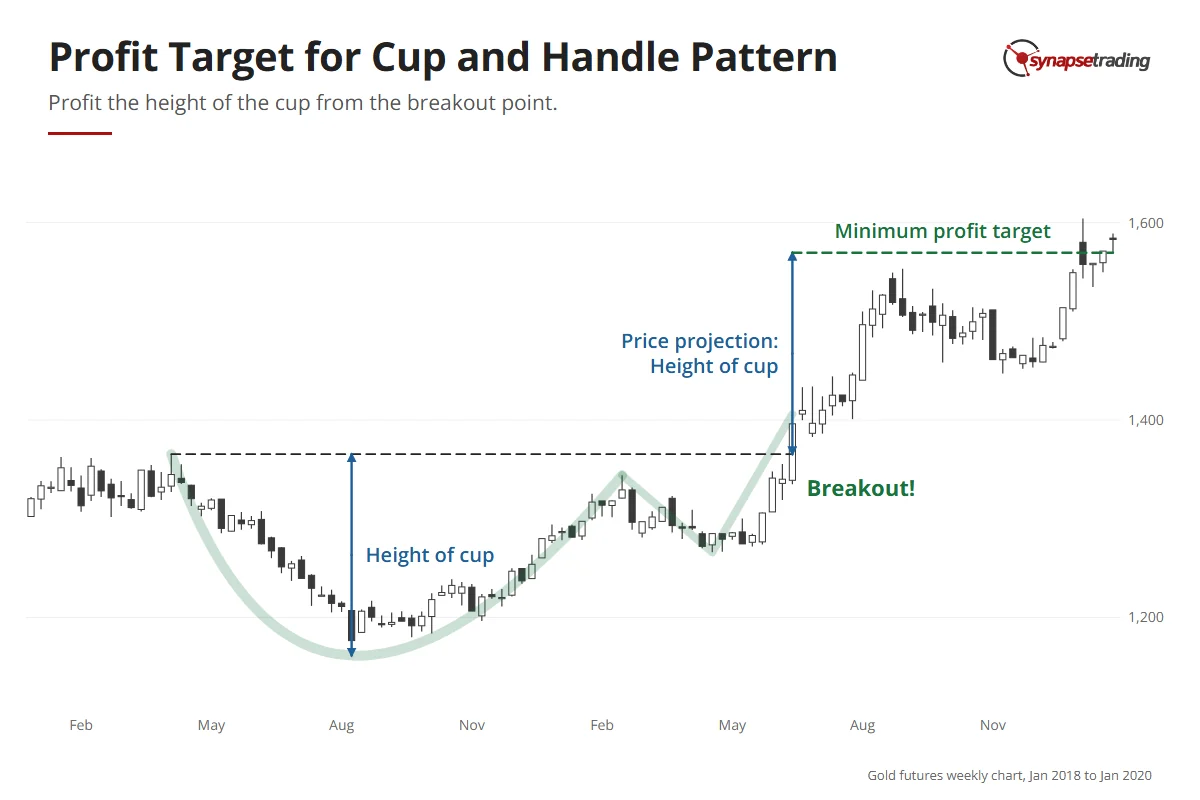
A finished cup and handle hands you its own target. Take the depth of the cup, from the rim down to the lowest point, and project the same distance up from the breakout.
On IWM’s monthly chart, the fall from the November 2021 high to the October 2023 low was about 34%.
So the minimum target sits roughly 34% above the old high.
At its August 2026 high, IWM was about 25% above that old high, roughly three quarters of the way there. By 16 October 2026 it had slipped back to about 11% above it. The target is where you plan your first exit. Price can stop short of it, and so far it has.
For extra confirmation, look for confluence, where the target lines up with an old support or resistance level. Then you have two reasons to expect a reaction there instead of one.
FAQ
Is the cup and handle a bullish or bearish pattern?
It is bullish, which is why “cup and handle” means the bullish version by default.
Is the cup and handle a continuation or a reversal pattern?
It can be either. I class it as a reversal because it usually starts a new uptrend out of a ranging market, but many traders call it a continuation when it forms partway up an uptrend. You trade both the same way.
Where is the best place to enter a cup and handle?
During the handle, just before the breakout, where a stop below the handle keeps the risk small. The first pullback after the breakout is the next best entry.
Where do I put my stop on a cup and handle?
For a pre-breakout entry, just below the handle’s low. For a pullback entry, just below the low of the pullback.
How do I set a profit target for a cup and handle?
Measure the depth of the cup and project that distance up from the breakout. Treat it as a minimum target, and look for an old support or resistance level near it.
Which entry suits you, the seat in the handle or the second chance? And has a cup ever broken out on you, only to sink straight back into the handle? Let me know in the comments.
For every pattern in detail, read my Guide to Trading Price Chart Patterns, or the pages on the triangle, rectangle and expanding triangle. The rest of my free trading guides are in one place.

If you would like to learn all the different price chart patterns, also check out: “The Definitive Guide to Trading Price Chart Patterns”
And if you want a daily routine that does not need hours at the screen, grab the free 15-minute swing trader checklist.
About the author. Spencer Li is The 15-Minute Trader and the founder of Synapse Trading. He is a Certified Financial Technician (CFTe) with 15+ years of trading, run from 70+ countries. He holds a B.Acc and B.BM from SMU. Every trade he takes is public, dated, losses left in. He teaches low-risk swing trading in 15 minutes a day, one system for any market.
Education, not financial advice. Synapse Trading is not licensed by MAS to advise on investment products. Trading carries risk of loss, and past performance is not indicative of future results.
Want the daily routine? Enter your email for the free 15-Minute Swing Trader's Checklist.
Free 5-page PDF, then occasional trading emails. Education only, not financial advice. Unsubscribe anytime. Kit stores your email in the US: see our privacy policy.
Want to learn the full method? The Trading Mastery Program teaches the 4 strategies I have traded since 2011. It suits beginners and experienced traders.
Rather follow the trades as they happen? Daily Trading Signals is our Telegram channel: my trade ideas with entry, stop and exit, and every trade is public.
Questions about this post? Ask in the free Telegram channel →
Educational content only, not personalised financial advice. Trading carries risk, including loss of capital. Past performance is not indicative of future results. Synapse Trading is not licensed or regulated by MAS.

