Will Higher Interest Rates Eventually Lead to a Stock Market Crash?
Weekly AMA on Instagram - Ask me anything about trading & investing, stock picks, market analysis, etc!
 Janet Yellen’s actions come into the spotlight once again.
Source: slate.com
After a slew of unprecedented events (Trump, Brexit), what has been troubling the world financial markets in recent days? As the FOMC announcement approaches, market participants have all eyes fixed on the almost-certain rate-hike that is coming up on Thursday. You probably have started to see Yellen’s photograph in news articles across all major financial newspapers.
Traditional economics theory teaches us that when interest rates rise, they are deflationary; businesses find it harder to borrow and affects interest-sensitive investment, while home owners find it harder to pay their mortgages. It all seems reasonable on the surface, but what actually goes on behind it?
In an economic climate such as ours today, traditional predictions have fallen very flat. There are Fed officials and scholars (not lay-people) who still insist that QE has no impact on the real economy whatsoever. The average wage-labourer probably doesn’t feel much when interest rates change, nor will he care even if rates drop or rise significantly.
However, as traders, our portfolios are at stake and it will bode us well to study this properly. Several macroeconomic indicators have to be understood and analysed to understand what is likely to happen. I’ve broken it down into 4 components for easy reading. Let’s get going:
Table of Contents
INDICATOR #1: Falling GDP?
The body of scholastic material addressing the link between interest rates and GDP is rather depressing. Stephen D. Williamson summarizes this rather aptly:
“There is no work, to my knowledge, that establishes a link from QE to the ultimate goals of the Fed—inflation and real economic activity”
When the cost of borrowing rises, economic activity slows. That has been what the Fed was trying to do when it goes ahead and raises interest rates. They were used as a deflationary tool to keep the economy from expanding too rapidly. What have we seen? I came across this table while researching on this topic:
INDICATOR #2: Lower Stock Prices?
The US stock market has been breaking new highs and with every new high, another analysts comes out and purports that ‘this is the top’.
However, before we all go into doom and gloom, let us remember that the bear markets of the last 50 years have had different causes, to be fair, there had to be some sort of trigger. It could be a political issue, such as the 1973-74 oil crisis, and the 1990 bear market caused by Iraq’s invasion of Kuwait. Furthermore, the Fed could be behind a market crash; in 1982, after raising interest rates relentlessly, the U.S market saw some severe bear moves in that period of time.
Sometimes bear markets happen because of bubbles; such as when the 2001 dot-com bubble and 911 terrorist attacks came about. In 2008, we saw a market crash as a result of a tanking housing market spurred by widespread institutional dishonesty.
Let us not be quick to jump to conclusions about a market crash coming. I’ll be watching the S&P and other indices closely over the next few months.
Interestingly, some quip that the “three steps and a stumble” rule would become a reality. It last happened in 2004, but we didn’t see a stock market crash until 4 years later.
“The ‘three steps and a stumble’ rule states that after three consecutive rate hikes (three steps), the stock market would begin to fall rapidly (stumble).”
I don’t quite buy into this idea. Over the past 30 years, there were only nine occasions where we saw 3 rate hikes in a row. Thrice in the 1970s, four times in the 1980s, and twice in the 1990s, and on average, only the 1970s saw a significant decline (approximately 10%) of the stock market in the next year or so.
 Chart of DJIA price changes after 3 rate hikes
Source: MarketWatch.com
More interestingly, the S&P500 looks like it’s ‘toppish’; the bull run seems rather unsustainable, but something seems to be sustaining this euphoria. On a technical basis, it has simply broken out of an expanding wedge on the daily chart.

The S&P500 has broken out of an expanding wedge pattern. It looks rather unsustainable, but it is happening before our eyes.
Source: MetaTrader 4
We’ll have to watch closely how the S&P behaves near the resistance before deciding if it would continue the rally (which is very possible!).
INDICATOR #3: Volatile Bond Prices?
There are signs that the market has already adjusted to an interest rate hike. Check out what happened to the 30-yr Treasury Bonds over the past year or so:
The 30-yr Treasury Bonds have fallen 15% since its last high in July 2016.
Source: MetaTrader 4
The rude correction has shocked many bulls out of the market, and it seems we have entered bearish territory in the bond market. My opinion is that the rate hike has definitely contributed to this, but it seems that the rate hike is a mere response to the macroeconomic conditions of the world. On the technical side, we see a head and shoulders pattern that has broken down (as a result of election fever), and the downtrend has continued somewhat.
 Short-term yields have risen almost as much as long-term yields.
Source: Bloomberg
If you’ve studied finance in university you would immediately recognize that the yield curve has flattened. Check out the table above; 3-month rates have risen as much as 30-year rates! This means 3-month yields have risen more than 100%, while 30-year yields rose about 10% or so. This is a typical response when the Fed tightens monetary policy. A famous interpretation of the yield curve states that when yield curves get inverted (when short-term bonds yield more than long-term bonds), that’s when the stock market crashes like nobody’s business.
We are still very far off from an inverted yield curve, so a market crash is still some distance away. My guess is that the bond market, as a measure of fear, will be in a state of confusion as there are valid reasons for economic strength as well as economic panic. Volatility in yields is likely to be the norm in the year ahead.
INDICATOR #4: Commodity Prices
Although some pundits claim to be able to predict how interest rates will move commodities, I beg to differ. Oil, for example, is very much output driven (think OPEC), and recently we’ve been having output cuts among producers. As you can see in the image below, when I checked the newsmap yesterday, ‘Oil Surges as More Producers Join Output Cuts’ was the most-read news of the day.

A casual glance at the NewsMap reveals a heightened focus on oil production.
Source: Newsmap.jp
Generally speaking, if you look at the relationship between oil and real interest rates, we see very little correlation even over the very-long-term.
 It’s hard to come to conclusions about how interest rates have affected commodity prices globally.
Source: cobank.com
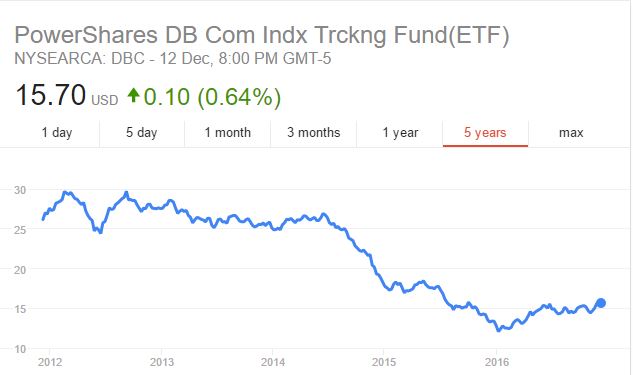
More recently, we’ve seen commodity prices tank over the past 5 years despite interest rates remaining almost constant. I just did a simple google search on the price of DBC (the global commodity price ETF) and this is what happened in the past 5 years.

A quick glance shows that commodity prices have fallen for 5 years.
Source: Google finance
To make an investment decision on commodities solely on interest rates isn’t wise. On a technical basis, commodities look like a good buy and I’ll be watching them closely to spot trading opportunities.
UP NEXT: THURSDAY’S RATE DECISION
If you aren’t already riding the bull market in stocks, it doesn’t make sense to enter now. Heroic bulls would want to enter now with a small profit target, and the world will be watching closely how the new year starts. Moreover, you won’t want to have too much exposure during the final FOMC meeting of 2016. Volatility on all other asset classes are expected, and I’ll be trading currencies, perhaps more regularly on an intra-day basis if I can’t find any good longer-term trends to ride on. All eyes will be on Thursday’s Rate Decision and the price action in the aftermath will be worth watching.
RESEARCH SOURCES & REFERENCES
http://www.cnbc.com/2015/09/15/when-the-fed-raises-rates-heres-what-happens.html
http://www.cnbc.com/2015/08/18/st-louis-fed-official-no-evidence-qe-boosted-economy.html
https://www.thestreet.com/story/13279476/1/what-happens-when-the-fed-hikes-interest-rates.html
http://www.slate.com/content/dam/slate/blogs/moneybox/2015/11/23/janet_yellen_responds_to_ralph_nader_s_sexist_letter/495620136-federal-reserve-chair-janet-yellen-testifies-before-the.jpg.CROP.promo-xlarge2.jpg
http://www.cnbc.com/2015/08/24/8-things-you-need-to-know-about-bear-markets.html
http://www.cnbc.com/2016/12/10/economist-harry-dent-says-dow-could-plunge-17000-points.html
http://www.marketwatch.com/story/edson-goulds-three-steps-and-a-tumble-rule
https://www.thebalance.com/inverted-yield-curve-3305856
http://www.cobank.com/Newsroom-Financials/~/media/Files/Searchable%20PDF%20Files/Newsroom%20Financials/Outlook/Outlook%202012/Outlook_10122.pdf
 Our flagship mentoring program is suitable for both beginners and advanced traders, covering the 4 strategies which I used over the past 15 years to build up my 7-figure personal trading portfolio.
 If you're looking for a reputable brokerage that covers all products (SG stocks, US stocks, global stocks, bonds, ETFs, REITs, forex, futures, crypto) and has one of the lowest commissions, this is what I currently use.
Spencer is an avid globetrotter who achieved financial freedom in his 20s, while trading & teaching across 70+ countries. As a former professional trader in private equity and proprietary funds, he has over 15 years of market experience, and has been featured on more than 20 occasions in the media.


Leave a Reply
Want to join the discussion?Feel free to contribute!