

Stocks on the Move Summary: Andreas Clenow’s Momentum Strategy, Rule by Rule
Want the daily routine? Get the free 15-Minute Swing Trader’s Checklist. Get it free →
How Clenow ranks, sizes and replaces S&P 500 stocks every week, why he uses no stop loss, and what his own tests say about the method
Published: 12 November 2026 · By Spencer Li, CFTe
Between 1999 and 2014, the S&P 500 total return index fell 55% at its worst point. A set of momentum rules, run on the same stocks over the same 16 years, fell 24% at its worst.
That gap is the case Andreas Clenow makes in Stocks on the Move, his 2015 book. It covers one strategy, which he sums up as “buy stocks that move up.” Rank the index by how strongly and how smoothly each stock has risen over 90 days. Size every position to carry the same daily risk. Stop buying while the index sits below its 200-day moving average. Then, every Wednesday, swap out whatever has fallen behind. There is no stop loss anywhere. In his backtest the rules made over 12% a year, against about 5% for the index.
Who is Andreas Clenow?
In the preface, Clenow calls himself a “quantitative hedge fund manager.” He says he had managed institutional portfolios on this concept “for the past decade or so” when he wrote it. His first book, Following the Trend (2013), was about trend following in futures.
How is it different from Following the Trend?
Our summary of Following the Trend covers his futures method: long and short, breakouts, trailing stops, across many markets. In Chapter 4 of this book he runs that same model on S&P 500 stocks from 2000 to 2014. It loses almost 30%, before commissions.
He traces most of the damage to the short side: “Trend following simply doesn’t work for shorting stocks.” Even long only, the model trails the dividend-adjusted index. So the stock book is relative. You rank a universe, own the top slice, and throw out whatever slips.
What are the 10 key ideas at a glance?
| Key idea | What it means in practice |
|---|---|
| 1. Buy stocks that move up | Own the strongest risers in a broad index, nothing else |
| 2. Rank by slope × R² | The 90-day trend, scored by how smoothly price followed it |
| 3. Two disqualifiers | Below its 100-day average, or a move over 15% in one day in the last 90 days |
| 4. The index filter | No new buys while the S&P 500 is below its 200-day average |
| 5. Allocate risk, not cash | Each stock sized to move the account about 0.1% on an average day |
| 6. No stop losses | Sell on relative weakness only |
| 7. Act once a week | Calculate every day, trade only on Wednesday |
| 8. Resize every second week | Volatility drifts, so position sizes drift with it |
| 9. Clean data or nothing | Past index members, delisted stocks and dividends all included |
| 10. Judge the drawdown too | 12% a year at a 24% worst loss, against 5% and 55% for the index |
How does Clenow rank stocks?
Imagine two stocks, both up 30% in 90 days. One climbed steadily. The other sat flat, then jumped on a takeover rumour. A plain percentage ranking scores them the same.
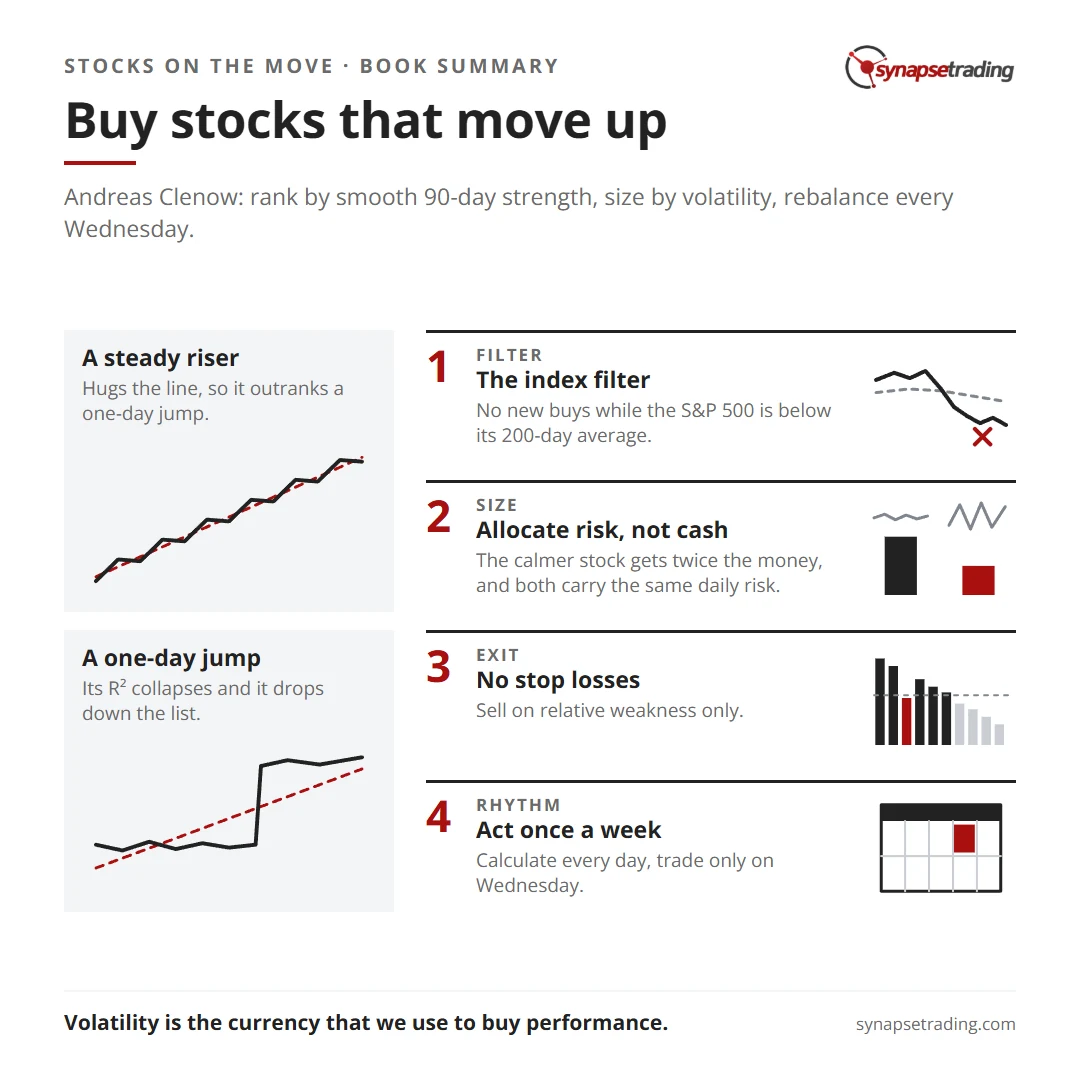
Clenow’s method separates them. Take the log of 90 days of closing prices and fit a straight line through it. The slope, annualised, is the rise in percent per year. Then multiply it by R², a score from 0 to 1 for how closely price hugged that line. The takeover jump fits a straight line badly, so its R² collapses and it drops down the list. In his words: “Never forget that volatility is the currency that we use to buy performance.”
Two filters then remove stocks outright. A stock must close above its 100-day moving average. And it must have no single move of more than 15% in the past 90 days, even one in your favour. “Gaps make me nervous,” he writes. In his sample ranking table, the top stock is skipped because it “had a recent gap of 26%.”
What does the index filter do?
No new position is opened while the S&P 500 closes below its 200-day moving average. That is the whole rule, and Clenow claims that “practically all equity portfolio strategies can be improved significantly by simply adding this one rule.”
It is a buying rule, never a selling rule. Holdings leave through the normal exits and are not replaced, so cash builds week by week. In 2008 the index was already below its average in January. By May the book held no stocks at all, stuck at the 8% loss it took in January. By November the index was down 47% on the year.
He is honest about the price. Most times the index dips below the average, it climbs straight back, leaving you behind. “The latter is much more common,” he writes. Over the whole test, “there were only two periods in 15 years where we really got any significant value from having this trend filter.”
So why keep it? Remove the filter and the strategy takes a hit of over 50% in 2008, and, in his words, “you’re too far behind to ever catch up again.” Our post on momentum trading covers why momentum portfolios crash, and why a filter like this exists.
How does Clenow size each position?
The formula is short. Shares = account value × 0.001 ÷ ATR, where ATR is the 20-day average true range, the size of a stock’s typical daily move. In plain terms, every stock is sized to move the whole account by about 0.1% on an average day.
Say one stock’s ATR is 2% of its price and another’s is 4%:
0.1% ÷ 2% = a 5% position. 0.1% ÷ 4% = a 2.5% position.
The calmer stock gets twice the money, and both carry the same daily risk. You buy from the top of the ranking until the cash runs out, which usually leaves 20 to 30 stocks. “Let the cash allocation land where it may.”
Volatility does not stay put, though. Every second Wednesday he recalculates each position and resets any that have drifted well off target, even trimming a stock that is doing fine. “These sales have nothing to do with market view,” he explains. Our post on risk vs volatility explains the difference this sizing rests on.
Why are there no stop losses?
He announces it with a shrug: “There are no stop losses here.”
A holding is sold on a Wednesday for one of four reasons. It drops out of the top 20% of the ranking. It closes below its 100-day moving average. It has a gap over 15%. Or it leaves the index.
The reason is about relative strength. A trailing stop never sells a stock for rising slowly while better ones run. As he puts it: “In a bull market, it’s not a merit to move up. Almost all stocks do that. We want the best.”
Once a week also means ignoring the noise in between. A stock can fall 20% on a Tuesday, and “unless that’s the day we’re supposed to trade we don’t do a thing.” Our guide on when to sell a stock compares these exits with stops.
What did the backtest show?
The test covers 1999 to 2014 on S&P 500 stocks, using each day’s real index members, the stocks later delisted, and dividends. The strategy made over 12% a year against 5% for the index. Its worst loss was 24% against 55%. Put another way, “the index lost 11 years’ worth of performance while the momentum strategy only lost 2.”
In 2011 the index ended roughly flat, while the strategy finished down almost 10%. He lowers expectations on purpose: “If you can compound in the low double digits over time, you’re beating almost everyone out there.”
The data matters as much as the rules. “The S&P 500 Index is a momentum index,” he writes, since stocks join after rising and leave after falling. Test on today’s members and any strategy looks brilliant, because “most of the delisted stocks had terrible performance.” Our guide on how to backtest a trading strategy covers this survivorship trap.
What does the book not tell you?
Costs. The strategy trades weekly and resizes twice a month, yet the book never says whether the 12% includes commissions or slippage.
A live record. Clenow says he runs the concept for clients, but prints no live return or drawdown. Every number is simulated, on one market, over one period that ends in 2014.
What drives the result. Ranking by plain 90-day percentage change performs about the same as slope × R², a difference he says “merely amounts to a rounding error.” Holding every S&P 500 stock, weighted by volatility, also beats the index, and he concedes that “simply by using a risk parity weighting, we can realize a large part of the momentum effect.” Buying 50 random stocks each month with the same sizing? “Not a single iteration has failed to beat the index.”
So a fair share of the edge may come from equal-risk sizing and the index filter, more than from picking the strongest stocks. The test that would settle it, random stocks plus his sizing plus his filter, is not in the book.
Where the human edge comes in
Every rule in this book can be coded. Clenow even defends his ranking on human grounds rather than on returns. The simpler methods, he says, “will lead you to invest in many dangerous or nonsensical situations.” And if you are uneasy with “the stocks that the system spits out,” you are “unlikely to keep buying them.”
That is the hard part. The filter sells near the bottom, then the market recovers without you. A year like 2011 loses money while the index does not. “If you happen to start off with a bad year though, it’s very easy to throw in the towel.”
His test is plain: “The only way to know if you can do it or not, is to try it with real money.” A computer runs the rules. Running them again the Wednesday after the filter sold the low is a person’s decision.
Concluding thoughts
Stocks on the Move is a full rulebook, with the numbers left in. It also prints the tests that question its own ranking, which few strategy books do.
For his earlier futures method, read our Following the Trend summary. For a buy-strength approach built on earnings and chart bases instead, see our How to Make Money in Stocks summary. The wider shelf is in the best investing and trading books of all time.
So look at your own exits. Do you ever sell a stock for lagging the others, or only for falling?
FAQ
What is Stocks on the Move by Andreas Clenow about?
A 2015 book on one momentum strategy for S&P 500 stocks: rank by smooth 90-day strength, size by volatility, buy only while the index is above its 200-day average, and rebalance every Wednesday.
How does Clenow rank momentum?
He fits a line to the log of 90 days of prices, annualises its slope, and multiplies it by R², so steady risers outrank one-day jumps.
Does Stocks on the Move use stop losses?
No. A stock is sold when it leaves the top 20% of the ranking, closes below its 100-day moving average, gaps over 15%, or leaves the index.
Go deeper
Clenow decides every exit by a rule, checked on a set day. The free 15-Minute Swing Trader’s Checklist builds the same habit into a daily routine: the scan, the questions to ask before you enter, and the five rules that keep you in the game. You can get it at the end of this post.
About the author. Spencer Li is The 15-Minute Trader and the founder of Synapse Trading. He is a Certified Financial Technician (CFTe) with 15+ years of trading, run from 70+ countries. He holds a B.Acc and B.BM from SMU. Every trade he takes is public, dated, losses left in. He teaches rules-based swing trading in 15 minutes a day, one system for any market.
Educational content only, not personalised financial advice. Trading carries risk, including loss of capital. Past performance is not indicative of future results. Synapse Trading is not licensed or regulated by MAS.
Want the daily routine? Enter your email for the free 15-Minute Swing Trader's Checklist.
Free 5-page PDF, then occasional trading emails. Education only, not financial advice. Unsubscribe anytime. Kit stores your email in the US: see our privacy policy.
Want to learn the full method? The Trading Mastery Program teaches the 4 strategies I have traded since 2011. It suits beginners and experienced traders.
Rather follow the trades as they happen? Daily Trading Signals is our Telegram channel: my trade ideas with entry, stop and exit, and every trade is public.
Questions about this post? Ask in the free Telegram channel →
Educational content only, not personalised financial advice. Trading carries risk, including loss of capital. Past performance is not indicative of future results. Synapse Trading is not licensed or regulated by MAS.
