
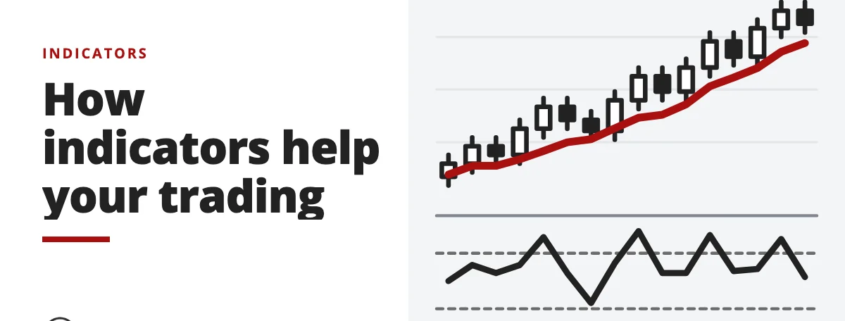
A technical indicator is a signal built from a security's price, volume or open interest. See how traders use popular indicators to anticipate price moves.

Indicators, candlestick patterns, chart patterns and price-action method.
Indicators, candlestick patterns, chart patterns and price-action method.
A technical indicator is a signal built from a security's price, volume or open interest. See how traders use popular indicators to anticipate price moves.
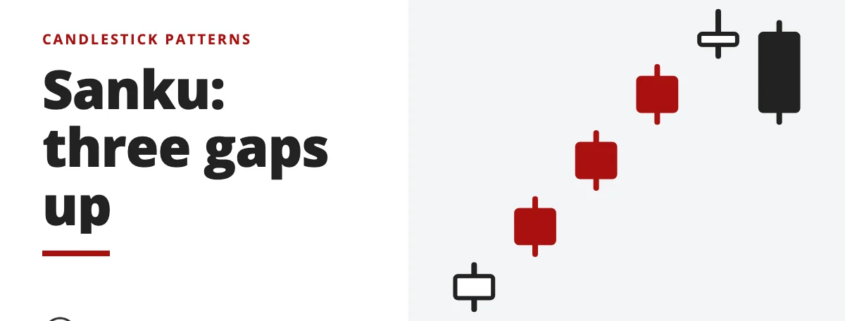
Sanku, the Three Gaps pattern, warns that a trend may be running out of buyers. How to spot it, when the turn is confirmed and where the stop goes.
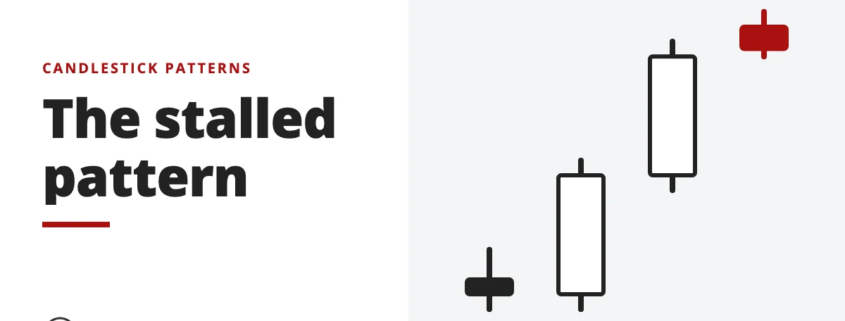
The stalled or deliberation pattern is three white candles with a small third one at the top of an uptrend. What it means, a real chart, and what tests show.
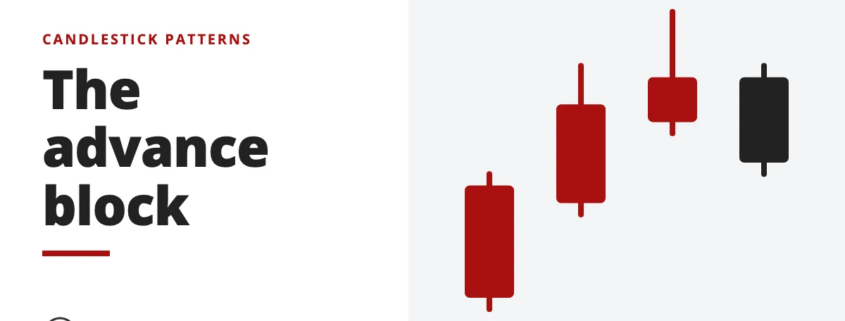
An advance block is three rising candles that often warn an uptrend may reverse lower, though it can also lead to continuation. See how to read it.
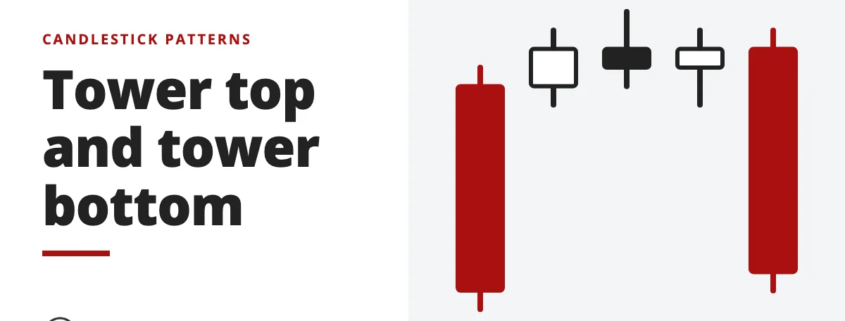
A tower top or bottom is a long candle, a stall of small candles, then a long candle the other way. See why the last candle decides it.