
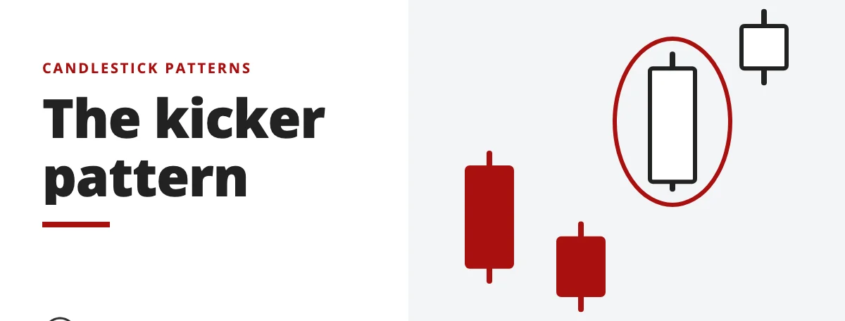
A kicker is a two-candle pattern marking a sharp reversal in price direction. See how to read it and what it says about whether buyers or sellers lead.

Indicators, candlestick patterns, chart patterns and price-action method.
Indicators, candlestick patterns, chart patterns and price-action method.
A kicker is a two-candle pattern marking a sharp reversal in price direction. See how to read it and what it says about whether buyers or sellers lead.
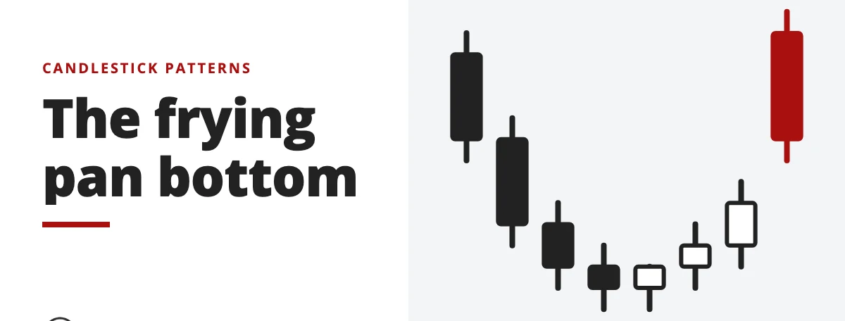
A frying pan bottom is a slow rounded base of small candles, completed by a gap up. What it shows, why to wait for the gap, and where it misleads.
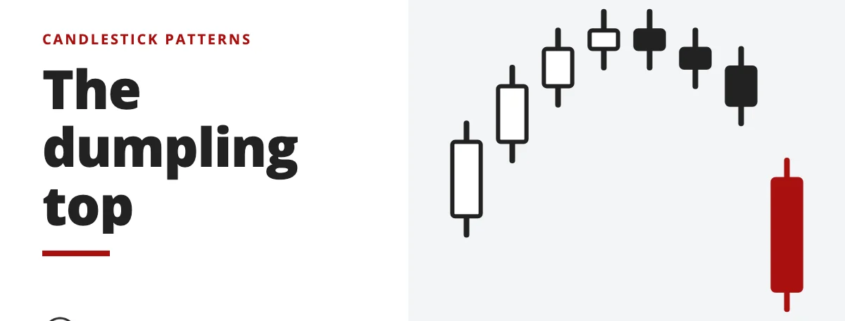
A dumpling top is a rounded top of small candles confirmed by a gap down. How to read it, why the gap matters, and why calling it early hurts.
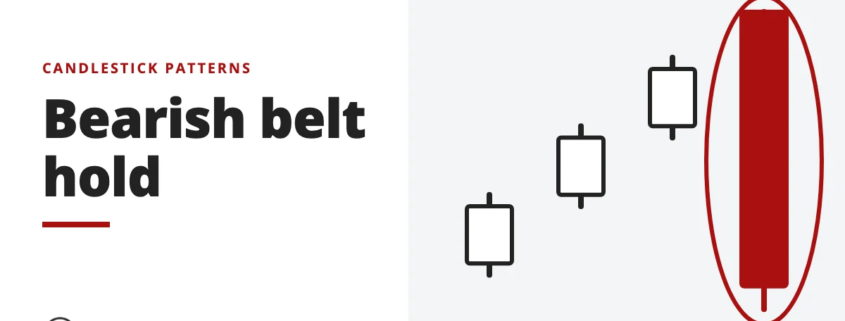
A bearish belt hold forms in an uptrend when a candle opens above the prior close at its high, then falls through the day. See how to read the signal.
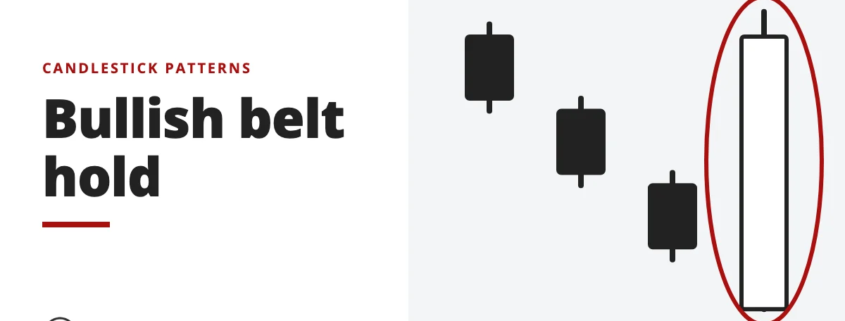
A bullish belt hold is a single candle that opens at its low, below the prior close, after a downtrend, hinting at a reversal. See how to read it.