
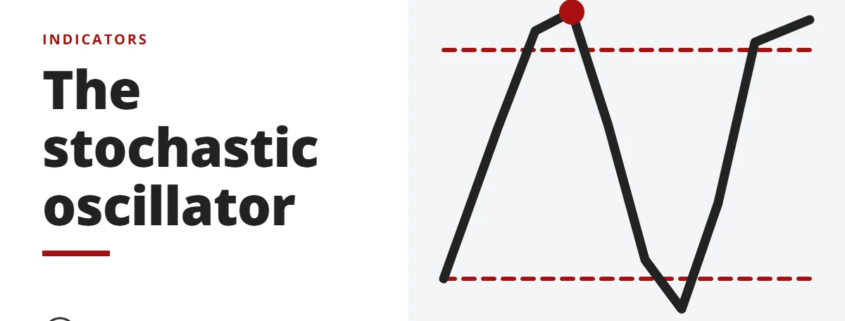
The stochastic oscillator compares a closing price with its recent range on a 0 to 100 scale to flag overbought and oversold markets. See how to read it.

Indicators, candlestick patterns, chart patterns and price-action method.
Indicators, candlestick patterns, chart patterns and price-action method.
The stochastic oscillator compares a closing price with its recent range on a 0 to 100 scale to flag overbought and oversold markets. See how to read it.
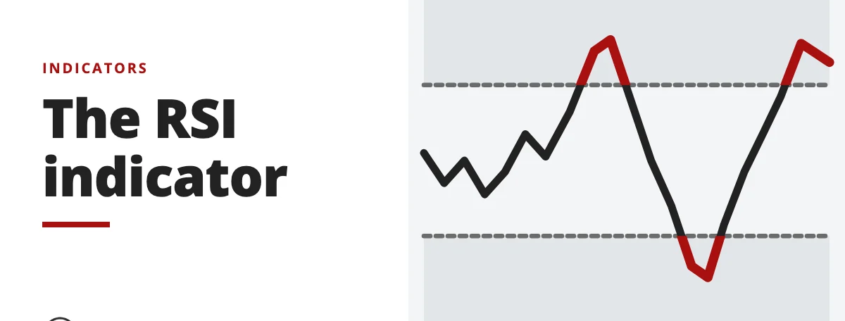
RSI, developed by J. Welles Wilder Jr., measures the speed and size of recent price moves to flag overbought or oversold conditions. See how to read it.
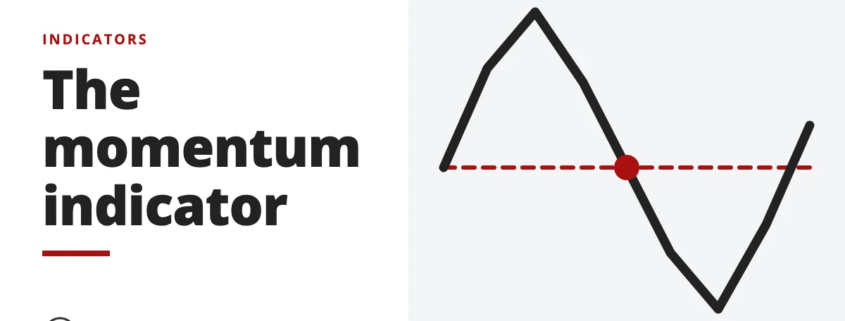
The momentum indicator measures the rate of price change over a set period and oscillates around a centreline of 100. See how to read this leading signal.
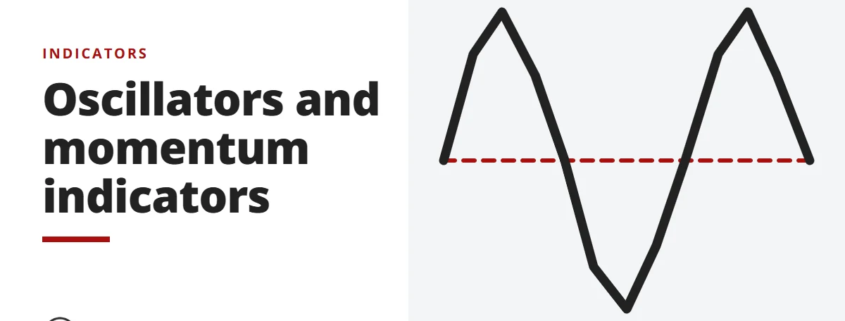
An oscillator swings between two extremes to flag short-term overbought or oversold markets. See how oscillators help find turning points in a range.
Price rate of change measures the percentage change between today's price and the price a set number of periods ago. See how ROC shows trend strength.