
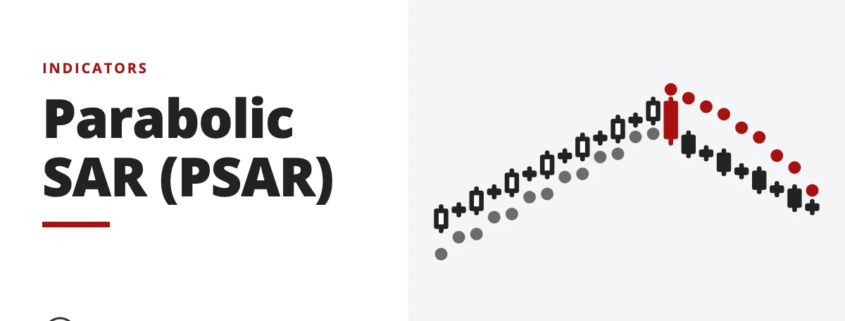
Parabolic SAR, from J. Welles Wilder, plots dots above or below price to flag possible trend reversals. See how traders use it for entries and exits.

Indicators, candlestick patterns, chart patterns and price-action method.
Indicators, candlestick patterns, chart patterns and price-action method.
Parabolic SAR, from J. Welles Wilder, plots dots above or below price to flag possible trend reversals. See how traders use it for entries and exits.
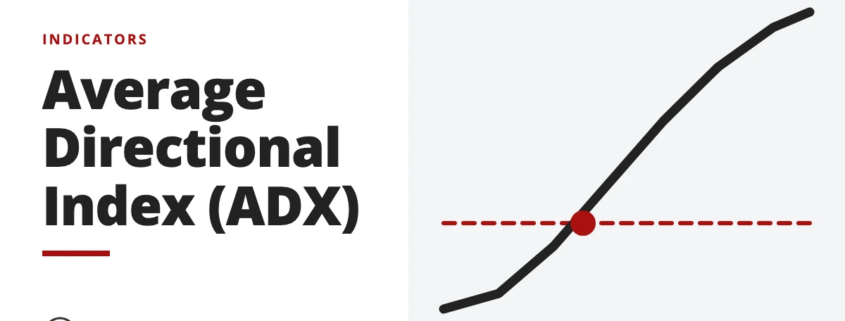
ADX gauges how strong a trend is, whatever its direction. Paired with +DI and -DI, it helps you decide whether to go long or short. See how it works.
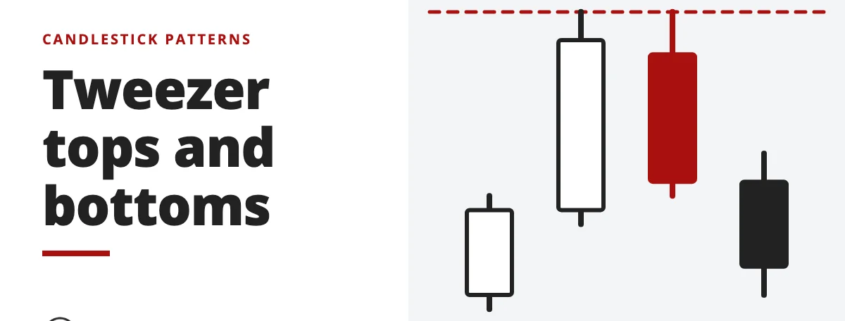
A tweezer is a reversal pattern where candles touch the same high at a top or the same low at a bottom. See how to spot and read tweezer patterns.
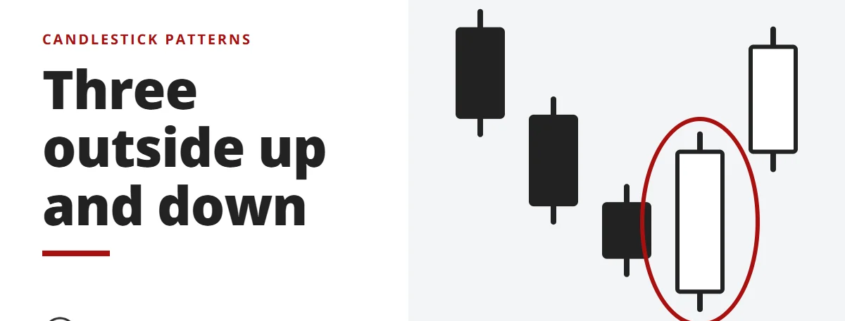
Three outside up and down are three-candle reversal patterns that show a trend has lost momentum. See the exact candle sequence and how to read each one.
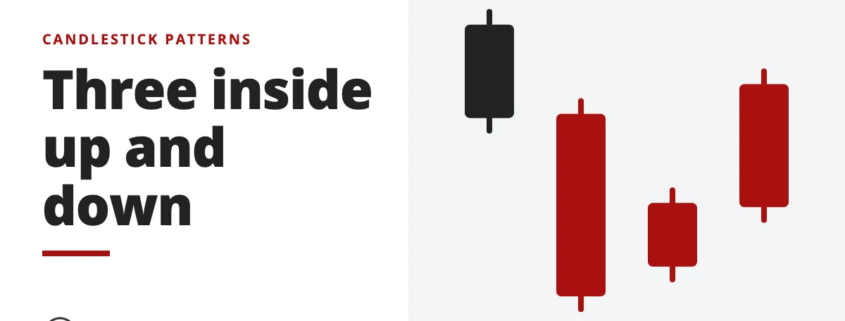
Three inside up and three inside down are three-candle reversal patterns that form when a trend loses momentum. See how each one forms on a chart.