
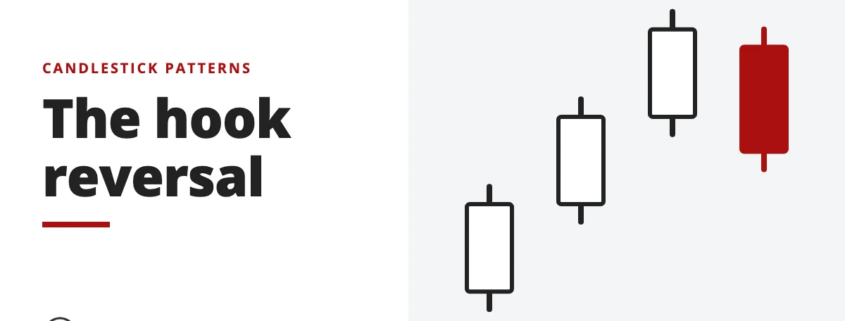
A hook reversal is a candle inside the last one that opens near one end and closes near the other. How to spot it, how it differs from a harami.

Indicators, candlestick patterns, chart patterns and price-action method.
Indicators, candlestick patterns, chart patterns and price-action method.
A hook reversal is a candle inside the last one that opens near one end and closes near the other. How to spot it, how it differs from a harami.
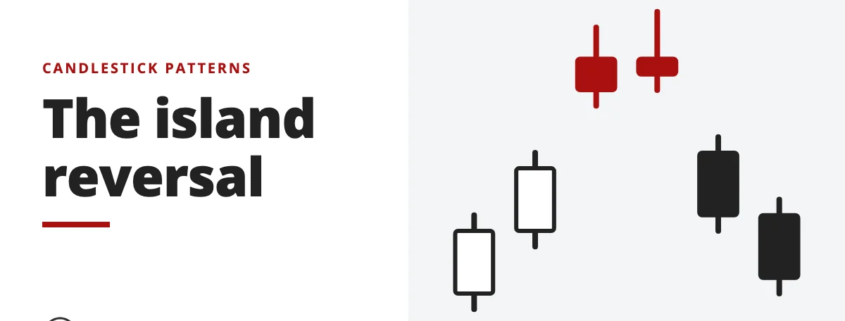
An island reversal is a group of days set apart by price gaps on either side. Analysts read it as a sign the trend may reverse. See how to spot…
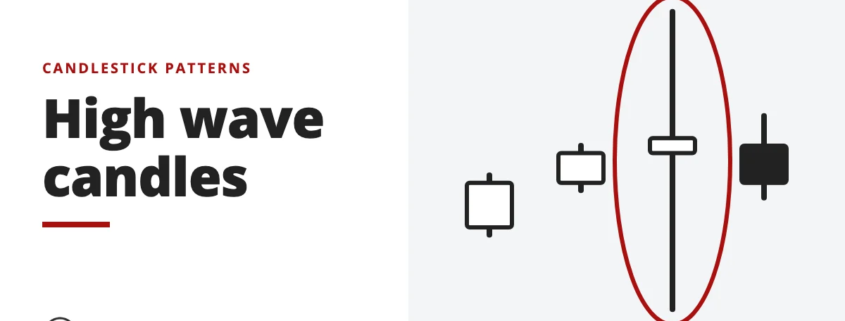
A high wave candle has long upper and lower shadows and shows neither bulls nor bears in control. It often forms near support and resistance levels.
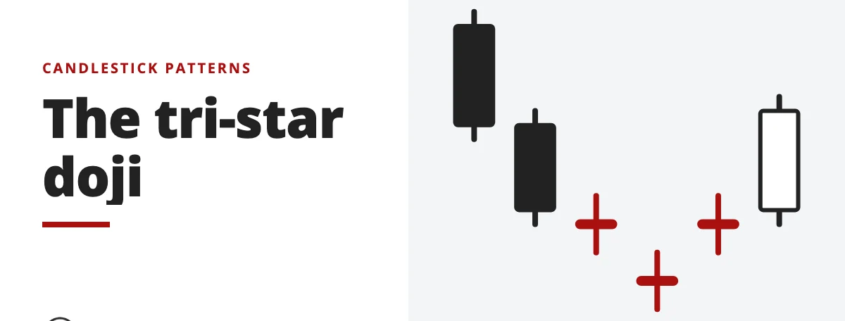
A tri-star is three doji candles in a row at the end of a long trend, signalling a possible reversal. See how to read the bullish and bearish tri-star.
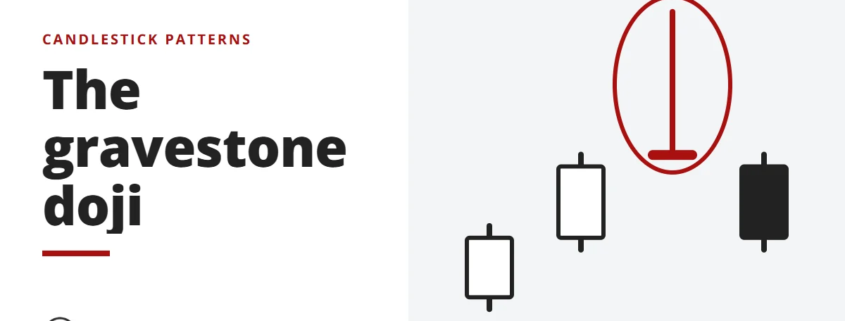
A gravestone doji is a bearish reversal candle where the open, low and close sit close together under a long upper shadow. See what it signals.