
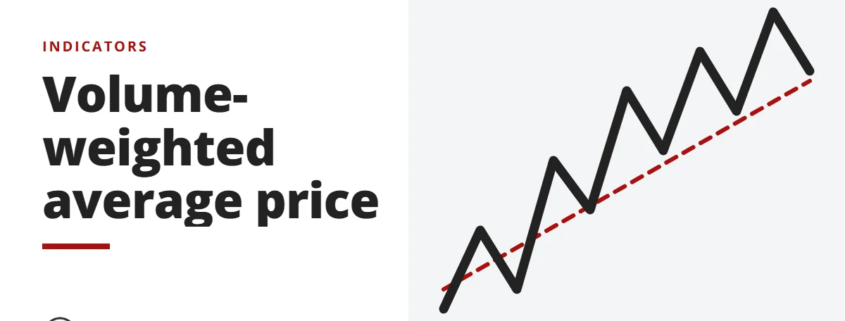
VWAP is the average price a security has traded at through the day, weighted by volume, and it resets each session. See why intraday traders watch it.

Indicators, candlestick patterns, chart patterns and price-action method.
Indicators, candlestick patterns, chart patterns and price-action method.
VWAP is the average price a security has traded at through the day, weighted by volume, and it resets each session. See why intraday traders watch it.
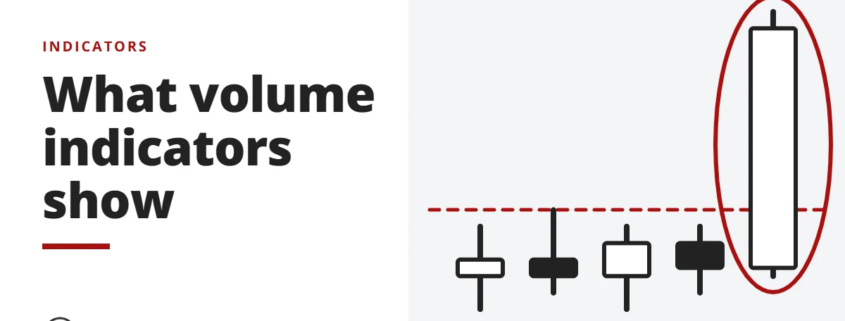
Volume indicators track how much of a security trades over time and how that changes. See the main volume indicators and what they tell you about price.
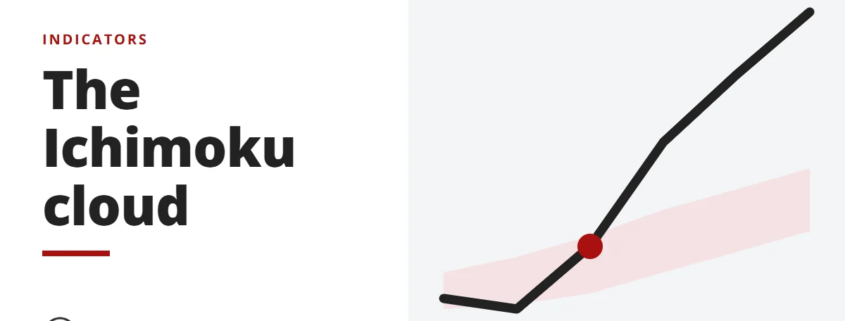
The Ichimoku Cloud combines several averages to show support, resistance, momentum and trend in one view. See how each line and the cloud are read.
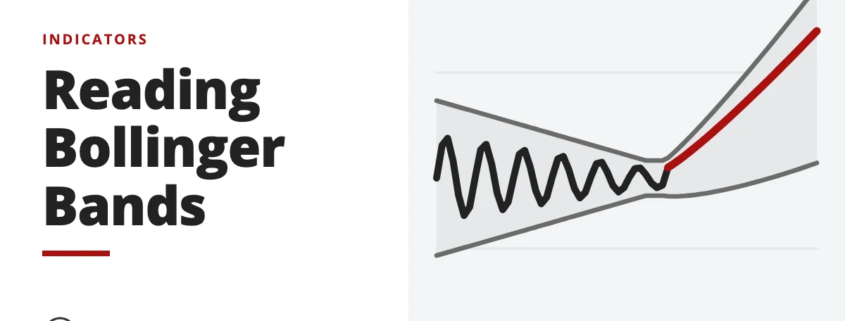
Bollinger Bands, developed by John Bollinger in the 1980s, plot three lines that move with price to gauge volatility. See how to read the bands on a chart.
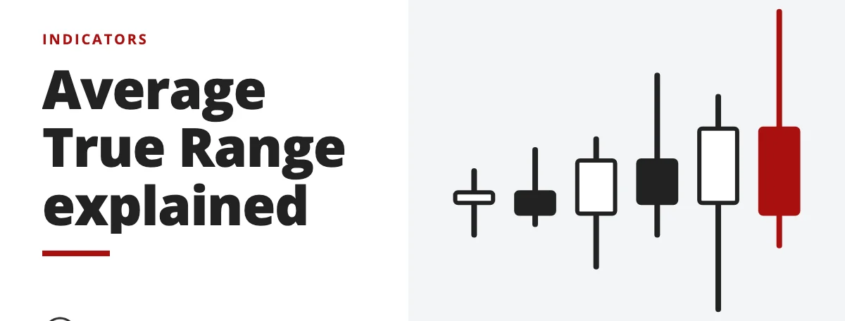
The average true range, from J. Welles Wilder Jr., measures market volatility from an asset's full price range. See how ATR is calculated and used.