
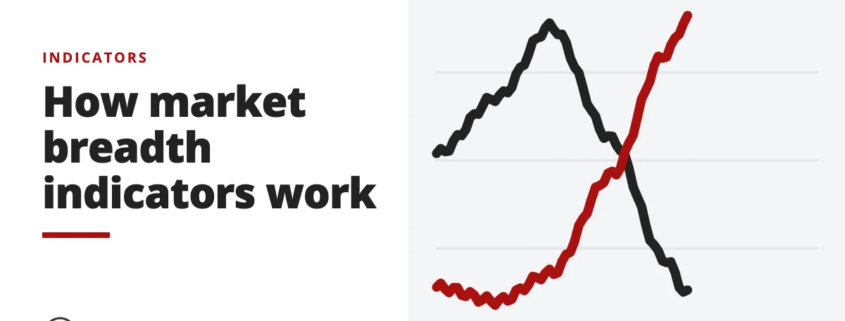
Breadth indicators measure how many stocks are rising or falling, and their volume, to confirm index trends or warn of reversals. See how they work.

Indicators, candlestick patterns, chart patterns and price-action method.
Indicators, candlestick patterns, chart patterns and price-action method.
Breadth indicators measure how many stocks are rising or falling, and their volume, to confirm index trends or warn of reversals. See how they work.
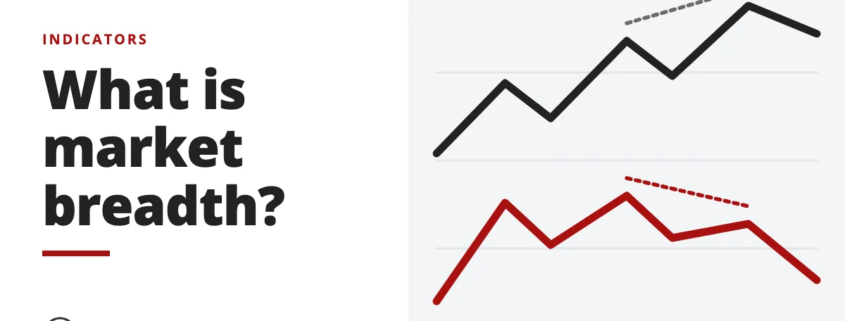
Market breadth compares advancing stocks with declining ones on an index or exchange. Positive breadth suggests bulls are in control of momentum.
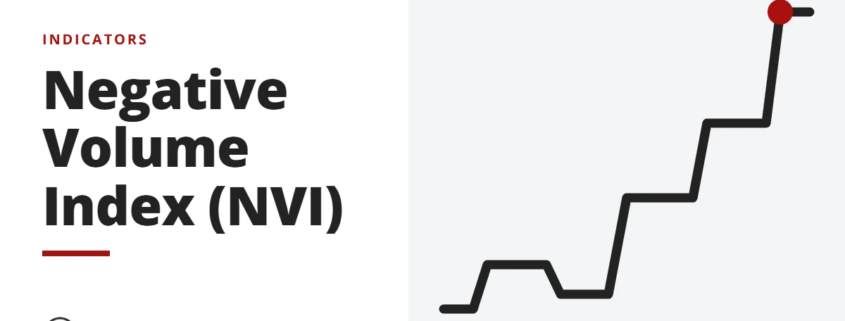
The negative volume index tracks price moves on days when volume is lower than the day before, to follow smart money. See how the NVI works.
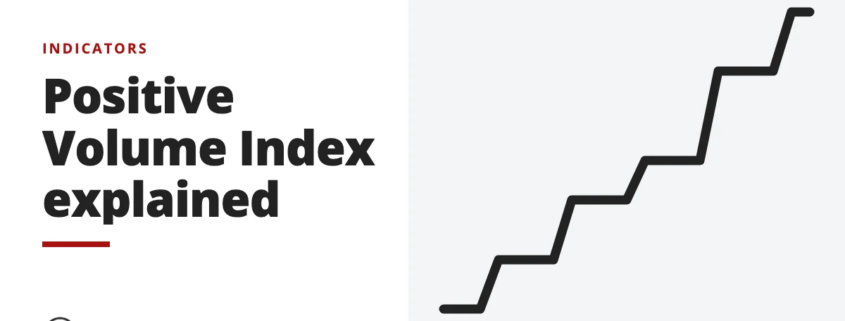
The positive volume index tracks price changes on days when volume rises. See how the PVI helps assess trend strength and confirm possible reversals.
The accumulation/distribution indicator uses price and volume to show whether a stock is being accumulated or distributed. See how to spot divergences.