
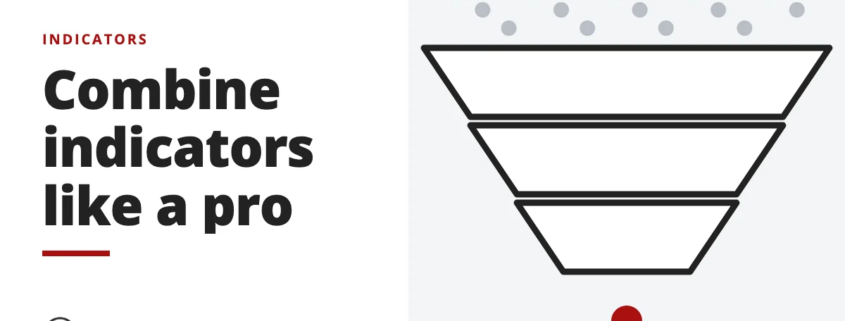
Combining indicators can seem complicated at first, but it gets easier once you see how they work. Here are the three main principles to follow.

Indicators, candlestick patterns, chart patterns and price-action method.
Indicators, candlestick patterns, chart patterns and price-action method.
Combining indicators can seem complicated at first, but it gets easier once you see how they work. Here are the three main principles to follow.
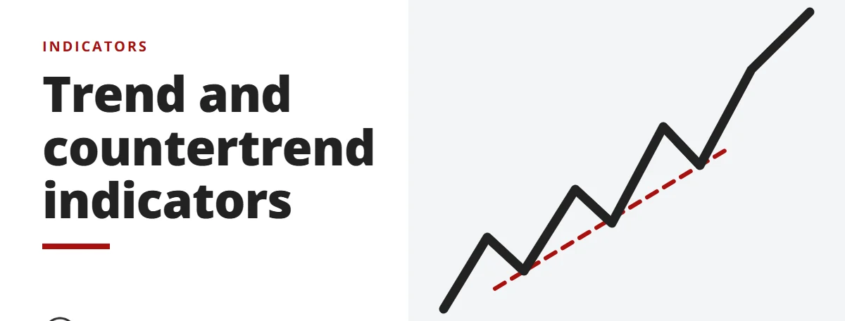
The trend is your friend, yet many traders also use countertrend tools. See how to combine trend and countertrend indicators in one trading approach.
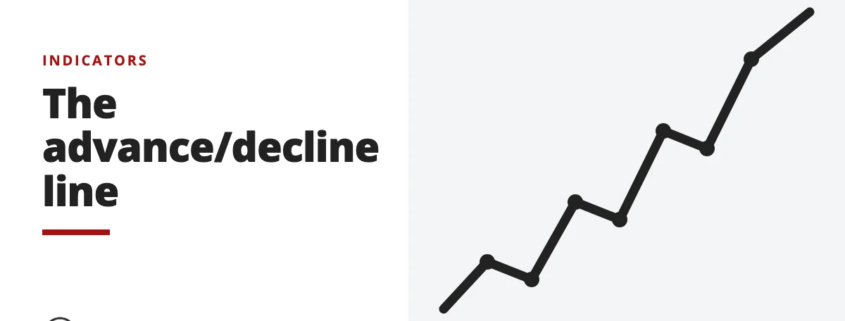
The A/D line is a cumulative running total of advancing minus declining stocks each day. See what it says about market sentiment and how to read it.
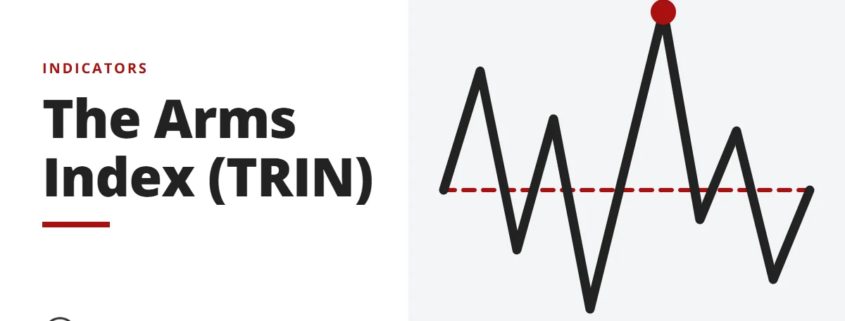
The Arms Index, or TRIN, compares the advance/decline ratio with advancing and declining volume. See how Richard Arms' indicator gauges market sentiment.
The McClellan Summation Index is a cumulative version of the McClellan Oscillator. See how it tracks intermediate to major market trends and reversals.