• Link to Facebook
  • Link to X
  • Link to Instagram
  • Link to Youtube
  • Link to LinkedIn
  • Link to Mail
Free PDF: The 15-Minute Swing Trader's Checklist, the daily routine of a trader since 2007
Synapse Trading
  • Mentoring
    • Trading Mastery Program
    • All mentoring options
  • Signals
    • Daily trading signals
    • Signals trade log
  • Results
    • Student results and testimonials
    • Public trade log, losses left in
  • Free guides
    • Start here
    • Trading foundations
    • Technical analysis
    • Strategies and systems
    • Risk and money
    • Trading psychology
    • Markets and products
    • Free trading guides
    • Tools and resources
    • Blog
  • About
    • My background
    • My trading journey
    • Media and interviews
    • Travel log
  • Contact
    • Contact me
    • Partnerships
  • Start free
  • Click to open the search input field Click to open the search input field Search
  • Menu Menu

Indicators, candlestick patterns, chart patterns and price-action method.

Spencer Li

Stop Hunting in Trading: Is It Real, and How Do You Protect Your Stop Loss?

Technical Analysis & Price Action
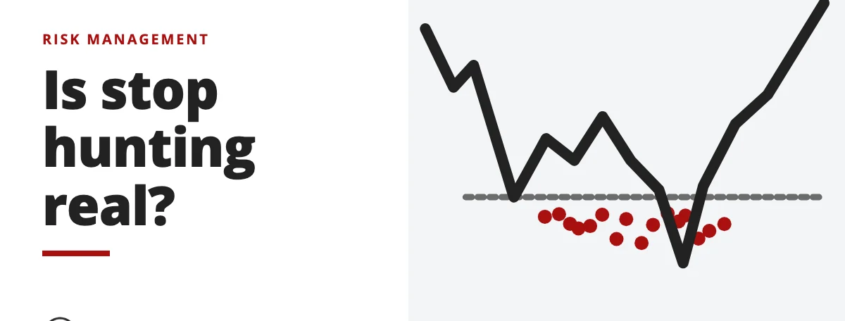
Is stop hunting real? - risk management

A regulator has caught bank traders trying it. But the stop hunt most traders feel has a far more ordinary cause

Published: 17 October 2026 · Last updated: 5 September 2026 · By Spencer Li, CFTe


You place a stop just under the obvious low. Two days later, price dips a few cents below it, fills your stop, and then rips higher without you. It feels personal. It feels like someone saw your order and went after it.

So is stop hunting real? Yes, in two very different forms. The first is misconduct that regulators punish. Banks have been fined after a regulator found their traders tried to trigger clients’ stop orders. The second is everyday market mechanics: stops pile up at the same obvious levels, and that pile of orders attracts price like a magnet, without anyone knowing or caring where your stop is.

The difference is between being hunted and being herded. Being hunted needs someone who can see your order. Being herded only needs you to put your stop where everyone else put theirs. For most traders in liquid stocks, the second is what is happening.
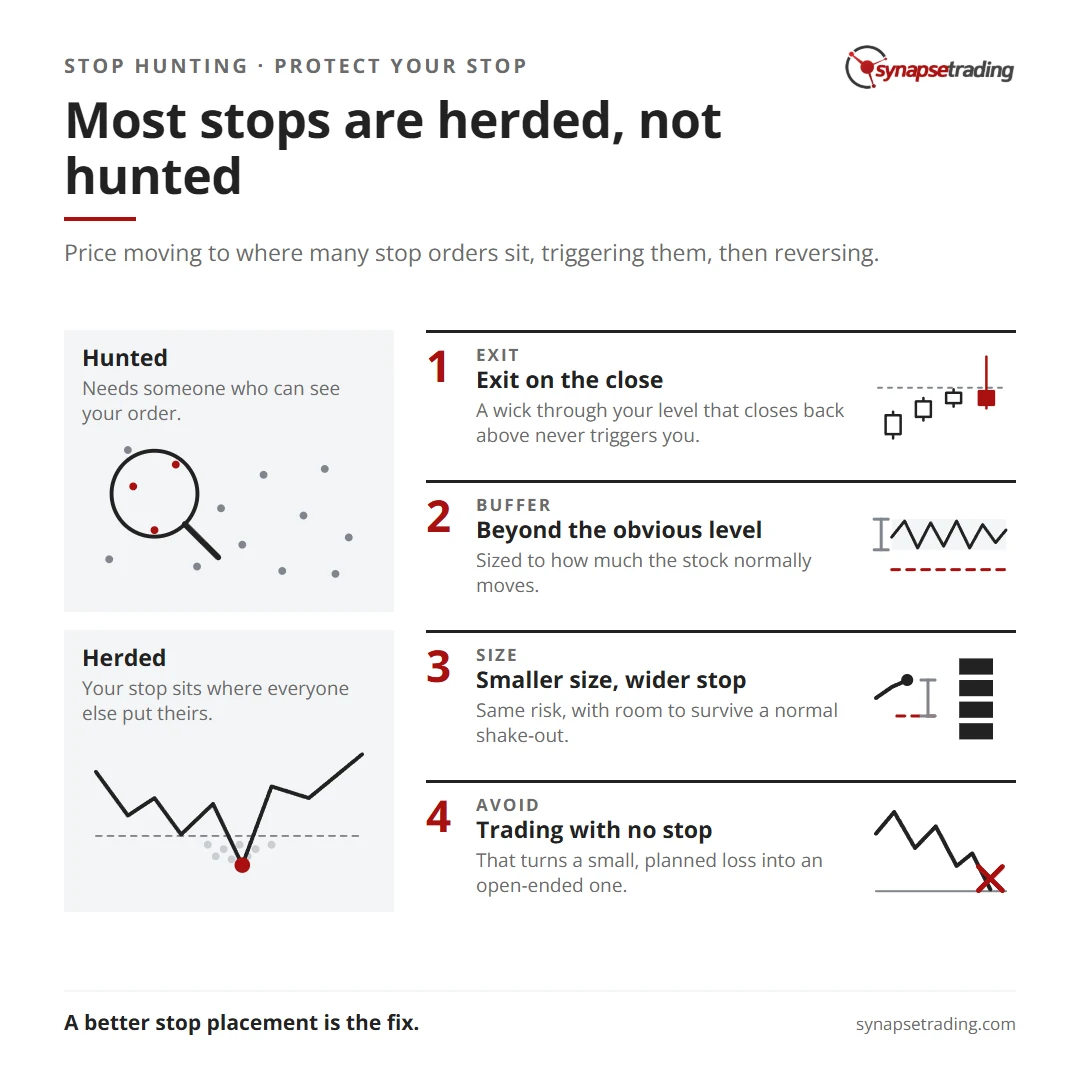
Most stops are herded, not hunted. Summary card for the post: Stop Hunting in Trading: Is It Real, and How Do You Protect Your Stop Loss?.

Has stop hunting ever been proven?

Yes. And it is worth being clear about this, because people who say “it is all in your head” are wrong about the history.

In November 2014, the UK’s Financial Conduct Authority imposed “fines totalling £1,114,918,000 ($1.7 billion) on five banks” over their foreign exchange trading. Among its findings, traders “attempted to manipulate fix rates and trigger client “stop loss” orders.” In plain words, a bank that held a client’s stop order could push the price to that level, fill the stop, and profit from the difference.

A different case shows how big players can fake the order book. In September 2020, the US Commodity Futures Trading Commission ordered JPMorgan to pay USD 920.2 million, which it called “the largest amount of monetary relief ever imposed by the CFTC.” Its traders had “placed hundreds of thousands of orders” with “the intent to cancel those orders prior to execution,” which created false signals of supply and demand.

Do note what both cases have in common. In each one, the firm could see the orders, or was placing them itself. That is what makes the hunted version possible.

Why does it feel like your stop always gets hit?

Because stops cluster, and a cluster of stops is a pool of guaranteed orders.

Think about where most traders put their stop. Just below the obvious swing low. Under a round number. Below yesterday’s low. Every textbook teaches the same levels, so a lot of stops end up in the same small area.

Now think about what a sell stop actually is. It is an order to sell at whatever price is available once a level is touched. A hundred of them under one low is a hundred sellers who will sell at almost any price. For a large buyer who needs to fill a big order without pushing the price up, that is the best place on the chart to buy.

So price reaches the level, sometimes on its own and sometimes with a nudge. The stops fire. That burst of selling pushes the price lower for a moment, which triggers the next layer of stops. Then the forced selling runs out, the buyers have their shares, and price snaps back.
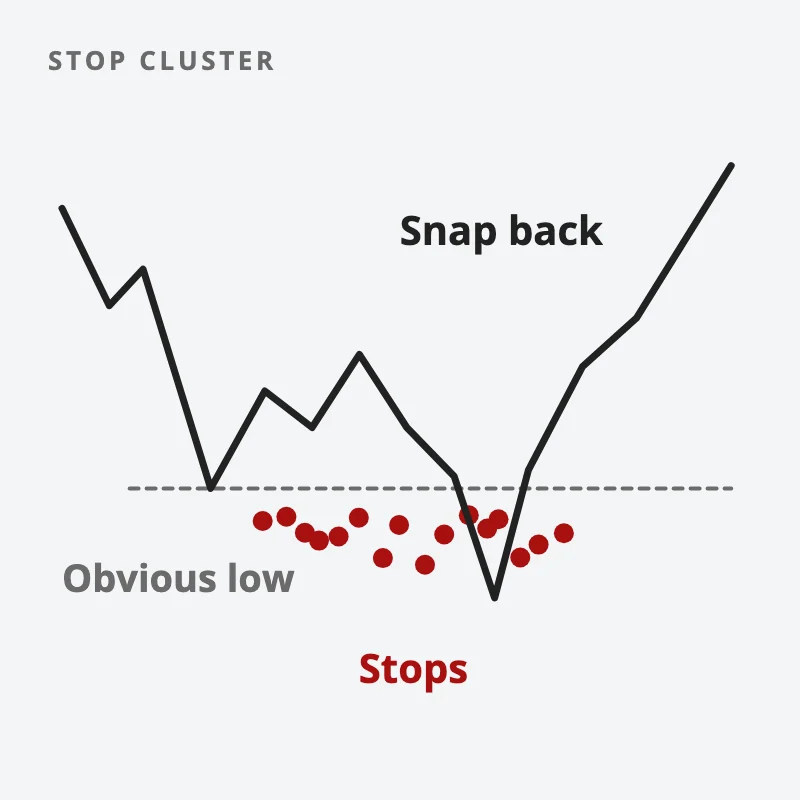
Price dips just below an obvious low where many stop orders sit, fills them, then snaps back higher
Stops pile up under the obvious low, so price often flushes them and snaps back.

Nobody in that story knows your stop. The same thing would have happened if you had no position at all. You joined the crowd by putting your stop where the crowd put theirs. That is the herded version, and it is by far the more common one. Our post on false breakouts shows the same mechanics from the other side.

A trader asked on a day-trading forum: “Is stop hunting/stop run real or just paranoia?” The honest answer is that it is real mechanics, and paranoia about the motive.

Where is stop hunting most likely to happen?

It depends a lot on what you trade and who holds your stop.

What you tradeWho can see your stopHow exposed you are
Forex or CFDs with a dealing-desk brokerThe broker, who may also be on the other side of your tradeHighest
Leveraged crypto futuresLiquidation levels are widely estimated and publishedVery high
Futures and very short intraday chartsNobody sees your order, but stops are easy to guess from the chartHigh
Thin, small-cap stocksNobody sees it, but price is cheap to pushMedium to high
Liquid large-cap stocks, held for daysNobody, if the broker keeps the stop on its own serverLowest

That last row is worth explaining. A standard stop order held by many brokers is not shown on the exchange’s order book. It waits at the broker and only becomes a real order when its price is hit. So in a liquid stock, nobody scanning the book can see it. The level may be obvious, but your order is not.

The first row is where you need the most care. With a dealing-desk broker, the firm sees your stop and may be your counterparty as well. That is the same structure the 2014 case was about, on a smaller scale. Our guide on how to choose a forex broker explains what to check, and if you trade with leverage, what happens in a CFD margin call is worth reading first.

If you want a routine that keeps your stops planned instead of rushed, our free 15-Minute Swing Trader’s Checklist covers the questions to ask before every trade. Get the free checklist →

How do you protect your stop loss from being hunted?

You cannot stop the market from visiting obvious levels. But you can stop being part of the crowd that gets flushed out there.

  1. Exit on the close, rather than intraday. For swing trades, decide your exit on the daily close. A wick that pokes through your level during the day and closes back above it never triggers you. This one rule removes most of the “hunted to the tick” pain.
  2. Put a buffer beyond the obvious level. Go a little further than everyone else, sized to how much the stock normally moves. The ATR, the average daily range, is a common way to size that buffer.
  3. Use odd numbers. Stops pile up at round numbers. Placing yours a little away from them costs nothing.
  4. Trade smaller with a wider stop. A wider stop with a smaller position risks the same amount as a tight stop with a big one. But it gives the trade room to survive a normal shake-out. Where to put your stop loss goes through how to pick the level.
  5. Know your order type. A stop-market order fills at the next available price. A stop-limit order may not fill at all in a fast drop, which can leave you holding the whole move down. Order types in trading explains the difference.
  6. Trade the failed move. When price flushes through a level and closes back above it, the trapped sellers have just left. That reversal is a well-known entry in its own right.

What is the real risk with stop hunting?

The real risk is the belief.

A post on a day-trading forum this year was titled “The Market Knows My Stop Losses.” The feeling is easy to understand. But once you believe the market is out to get you, every loss has someone else to blame. That makes it very hard to fix the things you control, like where you placed the stop, how big the position was, and whether the setup was any good.

The belief also tempts traders into the worst possible fix, which is trading with no stop at all. That turns a small, planned loss into an open-ended one. And when everyone around you is blaming the same villain, it is worth asking whether you have just joined another crowd. Our post on herd mentality in trading looks at how that happens.

There is a deeper point too. Research by Kaminski and Lo, published in 2014, found that whether a stop helps depends on how the market you trade behaves. In markets that tend to keep trending, stops can add value. In markets that tend to snap back, they can cost you, with or without anyone hunting them.

So, on your last stop-out that felt hunted, was your stop where everyone else’s was? And did the price close through your level, or just poke through it during the day? For more on managing risk, see the guide to money and risk management.

FAQ

Is stop hunting real?

Yes, in two forms. A regulator fined banks after finding their traders tried to trigger client stop orders. The everyday version is stops clustering at obvious levels, which attracts price without anyone targeting your order.

What does stop hunting mean in trading?

It means price moving to a level where many stop orders sit, triggering them, and then reversing. Sometimes it is deliberate. More often it is the natural pull of a large pool of orders.

Can brokers see your stop loss?

Your own broker can. With a dealing-desk forex or CFD broker, the firm may also be on the other side of your trade, which is where the risk is highest. On a stock exchange, a standard stop order held at the broker is not shown on the public order book.

How do you avoid stop hunting?

Exit on the daily close, put your stop a buffer beyond the obvious level, avoid round numbers, and use a smaller position with a wider stop. Trading liquid markets through a broker that is not your counterparty also helps.

Should you trade without a stop loss to avoid stop hunting?

No. Removing the stop swaps a small, planned loss for an open-ended one. A better stop placement is the fix.

Go deeper

Most stop-loss pain comes from decisions made in a hurry. The free 15-Minute Swing Trader’s Checklist has the daily routine, the questions to ask before every trade, and the five rules that protect your account.


About the author. Spencer Li is The 15-Minute Trader and the founder of Synapse Trading. He is a Certified Financial Technician (CFTe) with 15+ years of trading, run from 70+ countries. He holds a B.Acc and B.BM from SMU. Every trade he takes is public, dated, losses left in. He teaches low-risk swing trading in 15 minutes a day, one system for any market.

Educational content only, not personalised financial advice. Trading carries risk, including loss of capital. Past performance is not indicative of future results. Synapse Trading is not licensed or regulated by MAS.
by Spencer Li
https://synapsetrading.com/wp-content/uploads/2026/10/stop-hunting-trading-card.webp 630 1200 Spencer Li https://synapsetrading.com/wp-content/uploads/2026/10/synapse-logo-horizontal-light.png Spencer Li2026-05-29 13:35:182026-09-05 16:04:57Stop Hunting in Trading: Is It Real, and How Do You Protect Your Stop Loss?
Spencer Li

When Resistance Becomes Support: How Role Reversal Works, and When It Fails

Technical Analysis & Price Action
Resistance becomes support - price action

Last updated: 6 October 2026 · By Spencer Li, CFTe


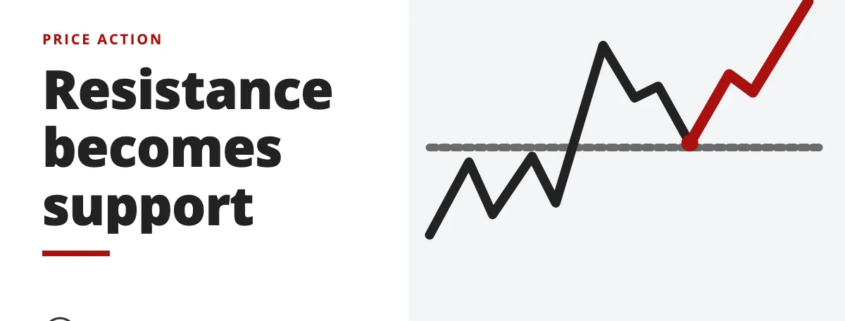
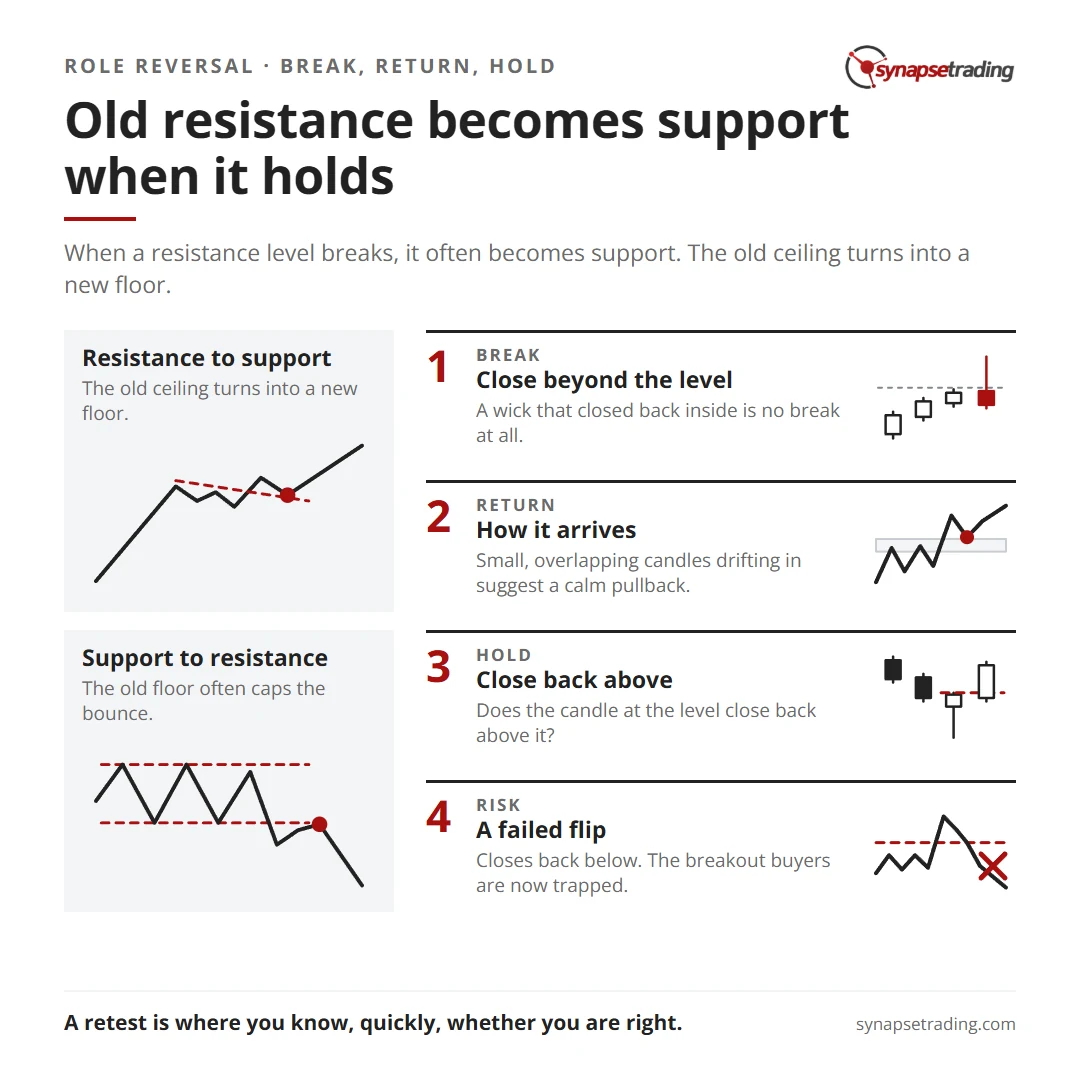
When a resistance level breaks, it often becomes support. Traders call this role reversal. The old ceiling turns into a new floor, because the people who traded at that price remember it, and many of them are glad to buy there when price comes back.

It works in the other direction too. Broken support often becomes resistance.

But “often” is doing a lot of work in that sentence. I measured it on 26 years of daily data. Price came back to the broken level most of the time, yet it only held there about 2 times in 3 on the S&P 500, and a little over half the time on gold. So role reversal is a tendency you can use, and in this post I’ll show you why it happens, how to check it, and how it fails.

Old resistance becomes support when it holds. Summary card for the post: When Resistance Becomes Support: How Role Reversal Works, and When It Fails.

Why does old resistance become new support?

Imagine a stock that has failed at the same price 3 times over 2 months. Every time it got there, sellers showed up and pushed it back down. Then one week it breaks through and closes well above that ceiling.

Now think about the 3 groups of people who remember that price.

  1. The sellers who were wrong. They sold or shorted at the ceiling, watched price run away from them, and felt the regret. Many of them would happily buy back at the price where they sold, just to get out even.
  2. The buyers who missed it. They watched the breakout happen without them. If price comes back to the old ceiling, they get a second chance, and plenty of them take it.
  3. The buyers who bought the break. They want the level to hold, and some will add to their position there.

All 3 groups want to buy at the same place. That is the usual explanation for why a broken level keeps its memory, and our post on how to draw support and resistance levels covers how those levels form in the first place.

This is Layer 2 of the price action trading guide: mark the few levels the market keeps reacting to, and watch what happens when one breaks.

How often does a broken level actually hold?

I wanted a number rather than a slogan, so I ran a simple test on 2 markets, using daily data from 2000 to 2025.

The rule was mechanical. A breakout was the first daily close above the highest high of the previous 20 sessions. Then I checked 2 things over the next 20 sessions: did price come back to within a quarter of a percent of the old level, and on the day it first got there, did it close back above?

Market, 2000 to 2025BreakoutsCame back to the old level within 20 sessionsClosed back above it on the first touch
S&P 500 index501about 93%about 68%
Gold388about 88%about 57%

2 things stand out.

First, the return trip is normal. Roughly 9 breakouts in 10 came back to the level they broke within about a month. So if you buy a breakout and price drifts back to the old ceiling, that by itself tells you very little. It is what usually happens.

Second, the hold is a tendency. About 1 time in 3 on the index, and more than 4 times in 10 on gold, the first touch closed back below the old level. Those are the failures, and some of them become the false breakouts that trap people.

Do note the limits. This is 2 markets, 1 breakout rule and daily candles, and the 20-session window is a choice. Different settings would give different percentages. What I would expect to survive any setting is the shape. Price usually comes back, the level holds more times than it fails, and it fails in enough cases that you must plan for it.

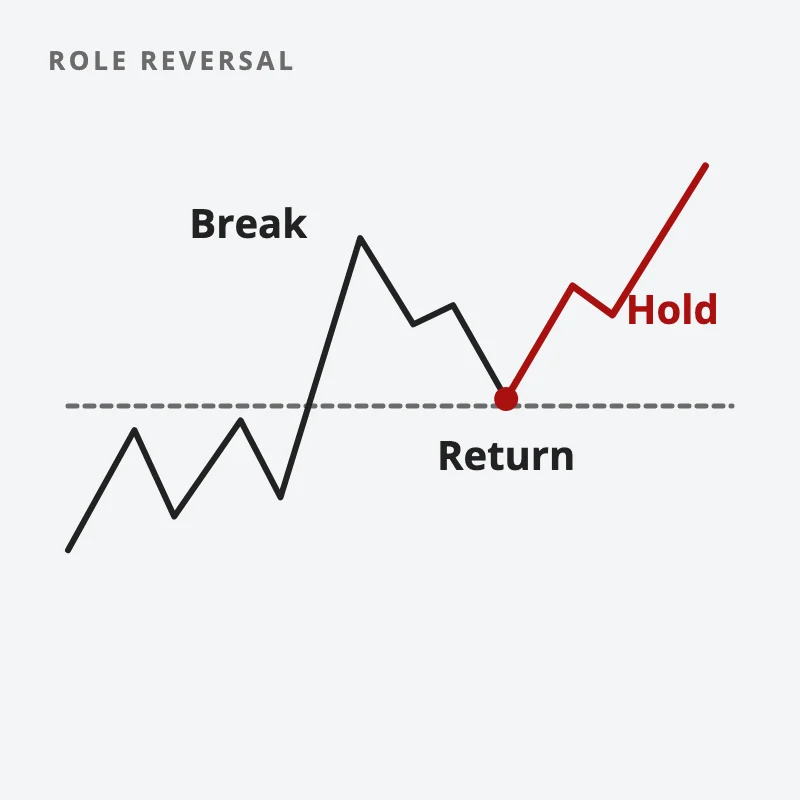
How do you check a role reversal? Break, Return, Hold

So how do you tell a flip worth trusting from one about to fail? I use 3 checks, in order, and I call them Break, Return, Hold.

  1. Break. Did price close convincingly beyond the level? A wick that poked through during the session and closed back inside is no break at all. The close is the vote, which is why we decide on the closing candle.
  2. Return. When price comes back, how does it arrive? Small, overlapping candles drifting into the level suggest a calm pullback. A long, heavy candle slicing straight through suggests the buyers were never there.
  3. Hold. Does the candle at the level close back above it? Lower wicks that dip into the zone and get pushed back up are the picture you want. A close below the zone is the level failing.

Each check filters the next one. A level that passed all 3 has shown you, in public, that buyers are defending it. A level that failed any of them is telling you the breakout may have been a fake.

Price breaks up through a resistance line, comes back down to it, and holds above it as the old ceiling becomes a floor
Old resistance becomes support when price breaks it, returns to it, and holds above it.

If you want this as a daily habit, the 15-minute routine I run after the close is in the free checklist at the end of this post.

What does a failed role reversal look like?

Suppose price breaks above a ceiling, comes back to it a week later, and the candle at the level closes well below it. Then the next day closes lower again, back inside the old range.

That is a failed flip. The old ceiling did not become a floor, and the people who bought the breakout are now trapped above the market. Their selling, as they give up, can push price down quickly, which is why a failed breakout can move hard in the opposite direction. Our post on breakouts and how to avoid the false ones is the other half of this one.

A failed flip also tells you about structure. If the level you expected to hold was the last higher low in an uptrend, its failure is the first warning in market structure.

Where does role reversal show up in chart patterns?

Almost everywhere a range breaks. The top of a rectangle pattern, the neckline of a head and shoulders, the flat top of an ascending triangle: each is a level that switches roles after the break, and each is often retested.

It also explains why continuation patterns work at all. A pause in a trend often forms just above a level that was resistance on the way up. Our post on continuation versus reversal patterns shows how narrow pauses differ from wide turns.

How should you use it?

Use it as location. A retest of a broken level is a place where you know, quickly, whether you are right. If the level holds, the breakout is behaving. If it closes back through, you have your answer at a small cost.

Where exactly the stop goes, and how big the position is, are separate decisions with their own rules. Read where to put your stop loss and take profit for that part.

Personally, I like role reversal because it hands you a second look. The breakout itself is often fast and emotional. The retest is slower, and it gives you a candle to read before you commit. That is also why it suits people with jobs, since you can read it on a daily chart after the close.

Think back to the seller who sold at the old ceiling and watched price run away. He is still out there, and when price comes back to his price, he is one of the reasons it holds. When it does not hold, he was right all along.

FAQ

Why does resistance become support?

Because traders remember the price. Those who sold there and were wrong, those who missed the breakout, and those who bought it all tend to buy if price returns, so the old ceiling attracts demand.

Does support become resistance too?

Yes. When support breaks, the buyers who were wrong and want to get out even tend to sell when price comes back up, so the old floor often caps the bounce.

How often does a broken level hold?

In a test on daily data from 2000 to 2025, price returned to the broken level within 20 sessions about 9 times in 10. It closed back above it on the first touch about 68% of the time on the S&P 500 and about 57% on gold.

What is a retest in trading?

A retest is price coming back to a level it just broke, to see whether the level now acts in its new role. A retest that holds on the close supports the breakout, and one that closes back through it suggests a false breakout.

Should I wait for a retest before entering a breakout?

It is a trade-off. Waiting gives you a second look and a clear level to be wrong at. But in the test above, price never came back in about 7% of cases on the S&P 500 and about 12% on gold, and a trader waiting for the retest missed those moves.

Go deeper

The free 15-Minute Swing Trader’s Checklist has the daily routine, the questions to ask before every trade, and the five rules that keep you in the game.


About the author. Spencer Li is The 15-Minute Trader and the founder of Synapse Trading. He is a Certified Financial Technician (CFTe) with 15+ years of trading, run from 70+ countries. He holds a B.Acc and B.BM from SMU. Every trade he takes is public, dated, losses left in. He teaches low-risk swing trading in 15 minutes a day, one system for any market.

Educational content only, not personalised financial advice. Trading carries risk, including loss of capital. Past performance is not indicative of future results. Synapse Trading is not licensed or regulated by MAS.
by Spencer Li
https://synapsetrading.com/wp-content/uploads/2026/10/resistance-becomes-support-card.webp 630 1200 Spencer Li https://synapsetrading.com/wp-content/uploads/2026/10/synapse-logo-horizontal-light.png Spencer Li2026-05-21 20:21:262026-10-06 19:42:07When Resistance Becomes Support: How Role Reversal Works, and When It Fails
Spencer Li

How to Draw Trendlines and Trade Channels: Touch, Close, Hold

Technical Analysis & Price Action
Draw trendlines that hold - technical analysis

The classic trading books, one simple drawing method, and the one rule they all agree on

Published: 17 October 2026 · Last updated: 22 June 2026 · By Spencer Li, CFTe


Open any daily chart of a stock in a clear uptrend. Find two higher lows, a few weeks apart, and connect them with a straight line. Extend the line to the right. That is a trendline.

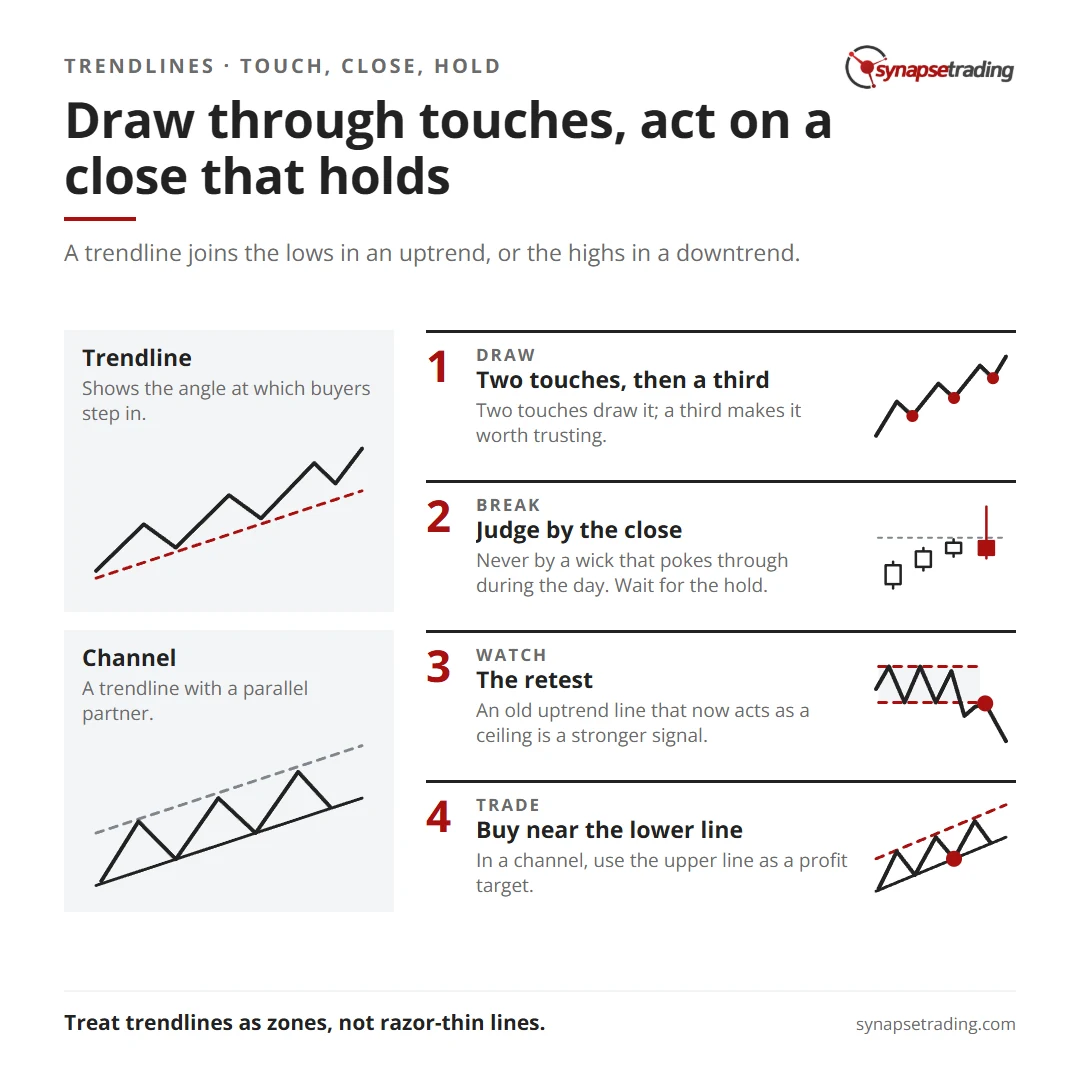
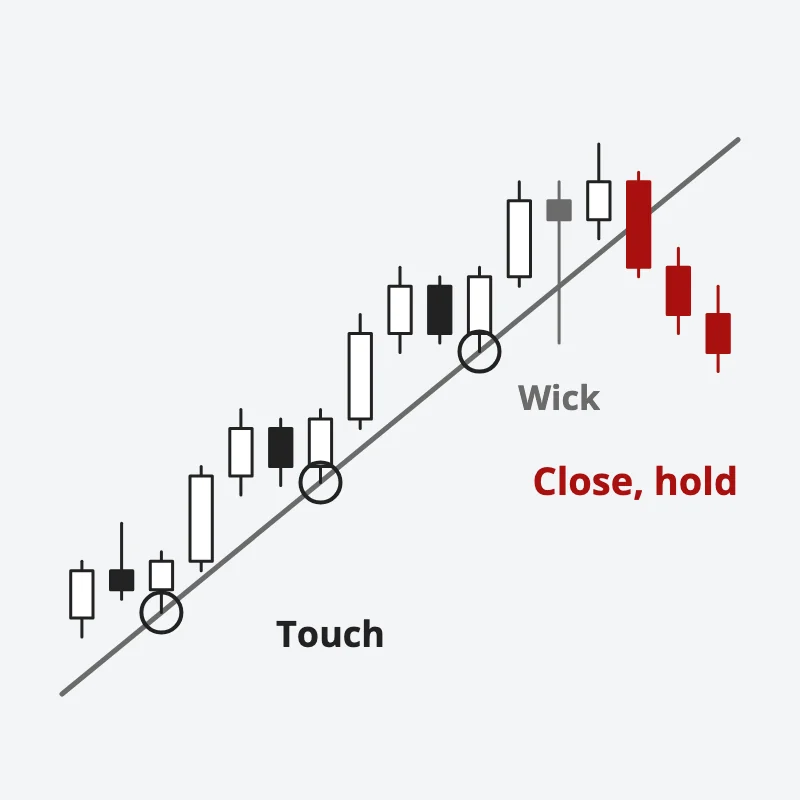
The hard part is everything after that. Which lows count, when is a line broken, and what do you do when it is? Here is the short answer. Draw the line through the lows that price has actually touched, and the more touches the better. Judge a break by the close, never by a wick that pokes through during the day. Then wait to see whether the break holds before you act on it.

The sections below cover each step, how channels work, and where the classic books disagree with each other.

Draw through touches, act on a close that holds. Summary card for the post: How to Draw Trendlines and Trade Channels: Touch, Close, Hold.

What is a trendline, and why does it work?

A trendline joins the lows in an uptrend, or the highs in a downtrend. It shows the angle at which buyers have been willing to step in.

Edwards and Magee, whose book is still the classic on chart patterns, observed that “nearly all Minor and most Intermediate Trends follow nearly straight lines.” They also admitted they did not know why prices so often pull back to the line before carrying on. In their words: “NO ONE KNOWS WHY.”

One likely reason is less mysterious. Plenty of traders draw the same obvious line and place their orders near it, so a line that thousands of people watch ends up mattering because of all the orders sitting around it. It keeps working for as long as they keep watching.

How do you draw a trendline correctly?

Here are the drawing rules most of the classic books share.

  1. Use at least two touches to draw it and a third to trust it. The more times price has touched the line and turned, the more it matters. Touches count for more than length.
  2. Never draw the line through price. If you have to cut through candles to make it fit, it is the wrong line. Adjust it or drop it.
  3. Expect the flatter line to last longer. A very steep line breaks sooner, and when it does, the trend tends to pause and drift sideways for a while, whereas a gentler line can carry a trend for many months.
  4. Use log scale for long, strong trends. On a chart covering years, a stock that doubled several times will curve away from a straight line on a normal scale.
  5. Draw on the daily or weekly chart. Lines on short intraday charts get broken all the time and mean far less.

That fourth rule trips up a lot of people. A trader asked on Reddit, “Trendlines on log charts or normal charts?” Their line had held on a normal chart and broken on a log chart, and they wrote, “Now this makes me question my entire thought process!” It is a fair reaction. For a few months of data, the scale barely matters. Over several years, Edwards and Magee noted the gap “may become MARKED,” and most of the books prefer log scale for long trends.

When is a trendline really broken?

This is where the books disagree, and it is worth seeing exactly how.

BookWhat counts as a real break
Edwards and MageeA close beyond the line “by a margin equal to about 3% OF THE STOCK’S PRICE”
John Murphy3% for major long-term lines, 1% for shorter ones, plus a two-day rule
Martin PringThe 3% rule is “useless intraday”. A valid breakout “should hold for several periods”
Singapore Polytechnic course text“a penetration has to last for more than two (or three) days”
Al BrooksMost breakouts fail, so the first break is often a trap

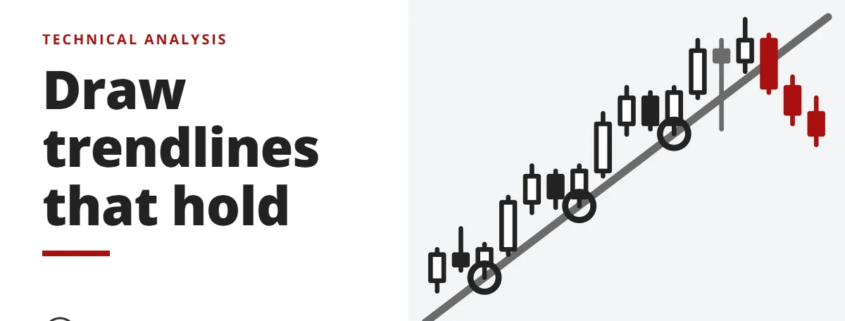
Do note what they all agree on. Every one of them wants more than a quick poke through the line during the day. A close beyond the line counts for more than a wick, and a break that holds for a few days counts for more than a single close.

An uptrend line drawn through three touches; a wick through it is ignored, and the break is a close below the line that holds
Draw the line through the touches, ignore wicks, and act only on a close that holds.

So a sensible rule is to judge on the daily close, and then wait for the hold. Which of the filters is best is still an open question, because the books argue for their own filters with examples rather than with counted results. If you want to see why so many breaks fail, our post on false breakouts goes through how to spot them.

Want a simple way to check a chart in minutes each day? Our free 15-Minute Swing Trader’s Checklist has the routine and the questions to ask before every trade. Get the free checklist →

What should you do when a trendline breaks?

Usually, nothing yet. Pring wrote that “Whenever a trendline is violated, the odds strongly favor a change in trend.” But a change in trend can mean a pause or a sideways range just as easily as a reversal.

The thing to watch for is the retest. After a clean break, price often comes back to the broken line from the other side. If an old uptrend line now acts as a ceiling and price turns away from it, that is a much stronger signal than the break itself. Our post on how resistance becomes support explains why old lines flip their role.

And if price breaks the line, then closes back above it within a bar or two, treat that as a failed break. The trend you thought had ended is often still alive.

The break of a long-term trendline, one that has held for many months, is rare. It is one of the strongest reversal clues on a chart, and even then the retest is worth waiting for.

Edwards and Magee added one useful warning. “In cases of speculative BLOW-OFF, TRENDLINES ARE OF LITTLE USE.” When a stock goes nearly vertical, there is no sensible line to draw, so do not force one.

How do you draw and trade a channel?

A channel is just a trendline with a parallel partner. In an uptrend, draw the trendline under the lows. Then copy it and move the copy up so it touches the highs. The upper line is often called the return line.

Here is how traders tend to use one.

  • Buy near the lower line, in the direction of the trend. That is where the risk is smallest, because the line is close and the reason for the trade is clear.
  • Use the return line as a target. Many traders take some profit when price reaches the upper line of an uptrend channel.
  • Be careful with breaks of the return line. Al Brooks, writing about intraday charts, found that a break above the top line of a channel fails within about 5 bars more often than it carries on. A sudden spurt above the channel is more often a sign of a tired trend than the start of a faster one.

Do note that this kind of channel is drawn by hand from price. Keltner channels and other indicator bands are calculated, which is a different tool, covered in our post on channels, bands and overlays. Two common chart patterns are built from channels too. A flag is a short channel sloping against the trend, and a wedge is a channel whose lines are converging.

How do trendlines fit with market structure?

Think of a trendline as a quick sketch of the trend, and market structure as the full picture. A trendline tells you the angle. The sequence of higher highs and higher lows tells you whether the trend is still intact. When both break together, the case is much stronger than when only the line goes.

Market structure trading covers how to read those highs and lows.

Trendlines are among the most useful tools on a chart, as long as you treat them as zones rather than razor-thin lines. Price is not a ruler. A line that price respects within a small margin is doing its job.

So go back to the chart you opened at the start and count the touches on your line. Then look at the last time price broke through it, and ask yourself honestly whether you would have jumped on that break straight away, or waited for the close and the hold. For more on reading price directly, see the guide to price action trading.

FAQ

How do you draw a trendline correctly?

Connect at least two lows in an uptrend, or two highs in a downtrend, without cutting through any candles. A third touch confirms it, and more touches make it stronger.

How many touches make a valid trendline?

Two touches draw it, and a third makes it worth trusting. The classic books agree that the number of touches matters more than the length of the line.

What is the 3% rule for trendline breaks?

It is Edwards and Magee’s filter: a close beyond the line by about 3% of the stock’s price. John Murphy uses 3% for major lines and 1% for shorter ones, and Martin Pring calls the rule useless on intraday charts.

Should trendlines be drawn on log or linear charts?

Use log scale for long, strong trends covering years. For a few months of data, the scale makes little difference.

How do you trade a trend channel?

Buy near the lower line in an uptrend, use the upper line as a profit target, and be wary of breaks above the upper line, which often fail.

Go deeper

A good line only helps if you check it the same way every day. The free 15-Minute Swing Trader’s Checklist has the daily routine, the questions to ask before every trade, and the five rules that protect your account.


About the author. Spencer Li is The 15-Minute Trader and the founder of Synapse Trading. He is a Certified Financial Technician (CFTe) with 15+ years of trading, run from 70+ countries. He holds a B.Acc and B.BM from SMU. Every trade he takes is public, dated, losses left in. He teaches low-risk swing trading in 15 minutes a day, one system for any market.

Educational content only, not personalised financial advice. Trading carries risk, including loss of capital. Past performance is not indicative of future results. Synapse Trading is not licensed or regulated by MAS.
by Spencer Li
https://synapsetrading.com/wp-content/uploads/2026/10/how-to-draw-trendlines-card.webp 630 1200 Spencer Li https://synapsetrading.com/wp-content/uploads/2026/10/synapse-logo-horizontal-light.png Spencer Li2026-05-14 13:20:522026-06-22 16:58:33How to Draw Trendlines and Trade Channels: Touch, Close, Hold
Spencer Li

What Is a Flag Pattern in Trading? How to Spot One, and When It Fails

Technical Analysis & Price Action
The flag pattern - chart patterns

Last updated: 22 September 2026 · By Spencer Li, CFTe


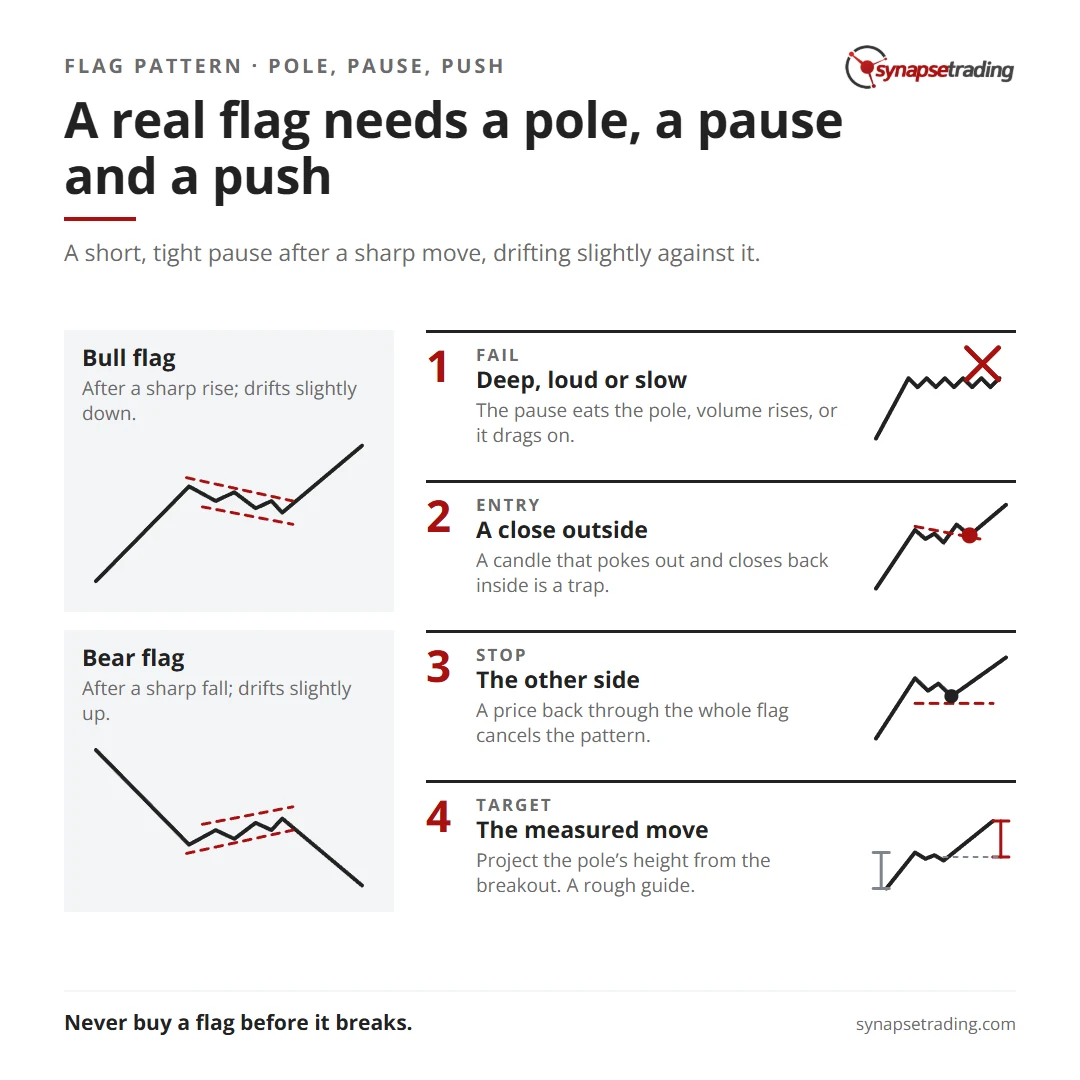
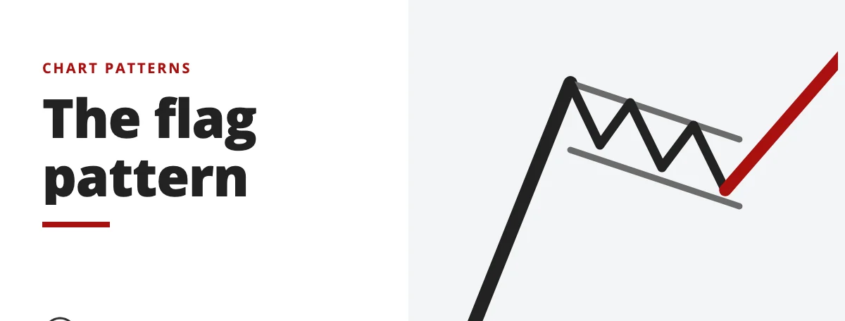
A flag pattern is a short, tight pause after a sharp price move. The sharp move is called the flagpole. The pause is the flag: a small channel that drifts slightly against the move. It is a continuation pattern, which means that when the price breaks out of the flag in the direction of the pole, the trend usually resumes.

So is a flag pattern bullish or bearish? It can be either. A bull flag forms after a sharp rise and drifts slightly down. A bear flag forms after a sharp fall and drifts slightly up. Either way, the pattern only counts once the price breaks out in the pole’s direction, ideally with volume coming back in.

The hard part is that plenty of pauses look like flags until they fail. Below is how to spot a real one, the 4 signs that it is breaking down, and how the price target works.

A real flag needs a pole, a pause and a push. Summary card for the post: What Is a Flag Pattern in Trading? How to Spot One, and When It Fails.

What does a flag pattern look like?

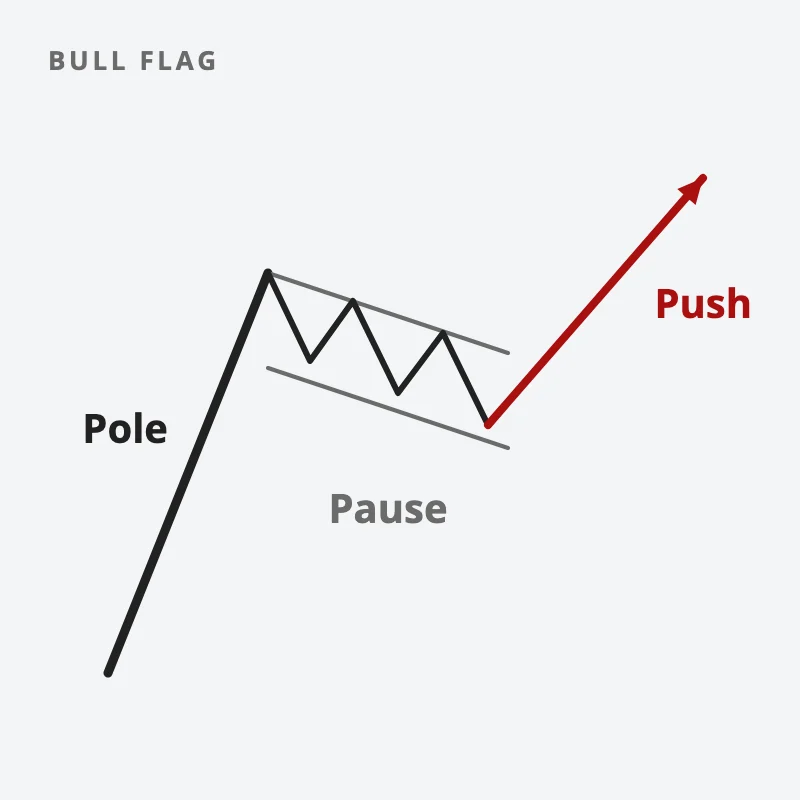
Think of it in 3 parts. I call this the pole, pause, push check:

  1. The pole. A fast, almost vertical move over a handful of bars, usually on heavy volume. Something changed, whether it was news, results or a breakout from a bigger range.
  2. The pause. The price drifts sideways or slightly against the move, inside 2 roughly parallel lines. The bars get smaller and the volume dries up, because the traders who drove the pole are mostly sitting tight and the few who sell are taking profits in a calm, unhurried way.
  3. The push. The price breaks out of the flag in the pole’s direction, and volume picks up again.

If any one of the 3 is missing, you are probably looking at something else. No pole means there is nothing for the flag to fly from. A loud, messy pause means real selling. And with no push, all you have is a pause.

A bull flag in three parts: a steep pole, a quiet pause drifting slightly down between parallel lines, and a push out in the pole's direction
A real flag needs a sharp pole, a quiet pause and a push.

Why do flags form at all?

Imagine a stock that has rallied hard for 5 days after strong results. The early buyers are sitting on a quick gain, and some of them get nervous and take it. That selling nudges the price down a little. But the traders who missed the first move have been watching with some frustration, waiting for a cheaper price, and they quietly absorb the selling.

Nobody is panicking. The sellers are banking profits, not running for the exit, so the volume drops. That is the flag: a short rest while the market catches its breath. Classic chart books describe flags as flying “at half-mast”, because they tend to appear around the middle of a sharp move. When the pause ends and the buyers return, the trend resumes.

A bear flag is the mirror image. After a sharp fall, short sellers take some profits and bargain hunters buy a little, so the price drifts up on light volume. Then the selling resumes.

The psychology is what makes the pattern useful. A flag is a market saying “I am resting, not changing my mind.” The 4 failure signs below are the market changing its mind.

How is a flag different from other chart patterns?

Flags belong to a family of continuation patterns, and the family resemblance causes most of the confusion. Here is the short version:

PatternShapeWhere it usually formsUsual lean
Flag2 parallel lines, sloping gently against the moveright after a sharp movecontinuation
Pennant2 converging lines, a tiny triangleright after a sharp movecontinuation
Rectangle2 flat parallel lines, wider and longermid-trend or laterbreaks either way
Wedge2 converging lines sloping the same waylate in a move, or as a correctionrising leans bearish, falling leans bullish

Length matters too. A flag is a brief pause. Small patterns like flags and pennants tend to show up early in a trend, while bigger ones like rectangles and triangles tend to come later, which our post on continuation and reversal patterns explains. If a “flag” drags on far longer than the pole took to build, it is probably turning into one of those bigger shapes.

The flag’s closest cousin gets its own post: pennant vs flag vs triangle.

If you want a daily routine for checking setups like this in 15 minutes, the free 15-Minute Swing Trader’s Checklist is at the end of this post.

When does a flag pattern fail?

Most of the money lost on flags is lost on things that were never flags. Here are the 4 signs a flag is breaking down:

  1. The pause is too deep. A flag drifts gently. If the pullback eats most of the pole, the buyers who drove the pole are not defending it, and the “rest” is starting to look like a reversal.
  2. Volume rises inside the flag. In a healthy flag, volume dries up. Heavy volume on the drift against the move means real sellers have turned up, and profit-takers rarely trade that loudly.
  3. The breakout is only a wick. A real breakout closes outside the flag. A candle that pokes out and then closes back inside is a trap for anyone who bought the poke.
  4. It takes too long. The longer the pause, the more the urgency behind the pole has faded. A flag that keeps going sideways is losing its reason to exist.

Then there is the plain failure: a bull flag that breaks down through its lower line, or a bear flag that breaks up through its upper one. At that point it is no longer a flag. Do note that failed patterns can move fast, because everyone who bought the “flag” is suddenly trapped on the wrong side, and their exits add fuel.

When I had an AI sort through 734 of my own trade charts, flags turned up in 2 places: as the pullback inside a strong trend, and as a breakout setup. My rule for both was the same. I wait for a candle to close outside the flag with volume behind it, and most of the time I wait again for the price to come back and retest the breakout. I never buy a flag before it breaks, because a flag that has not broken out is just a pause, and pauses can end either way.

What is the price target for a flag pattern?

The traditional method is the measured move. You take the height of the pole and project it from the point where the price breaks out of the flag. The idea is that the second leg of the move tends to roughly echo the first, which is why the flag sits at “half-mast”.

Suppose a stock rises from 10 to 14, so the pole is 4 points tall. It drifts in a flag, then breaks out at 13.50. The measured target is 13.50 plus 4, which is 17.50.

Treat that number as a rough guide that tells you whether the trade is worth taking at all, since a target that sits only a little above your entry rarely pays for the risk of being wrong. Markets do not owe anyone the second half of a move, and a measured target that runs straight into an old resistance level is less likely to be reached. For how to combine pattern targets with support and resistance, see where to put your stop loss and take profit.

How do you trade a flag pattern?

The logic is simple, even if the execution takes practice. The breakout tells you the pause is over. The other side of the flag tells you where the idea is wrong, because a price that falls back through the whole flag has cancelled the pattern. That gap between the two is your risk, and it has to be small enough to size the trade sensibly.

The full step-by-step, with entries, stops and examples, is in our bull flag and bear flag trading strategy guide. For the rest of the pattern family, the price chart patterns guide is the hub, and the triangle pattern post covers the flag’s larger relative.

Personally, I think the flag is the most honest pattern on the chart. It only appears after the market has already shown its hand with the pole, so you are not guessing at a new trend. You are waiting to see whether an existing one has the energy to continue. Most of the skill is in the waiting.

That stock resting after its 5-day rally is not telling you what it will do next. It is telling you to watch. If the pole, the pause and the push all show up, the flag has earned your attention, and if they do not, you have lost nothing but a little time.

FAQ

What is a flag pattern in trading?

A flag is a short, tight consolidation that forms after a sharp price move, called the flagpole. It drifts slightly against the move inside 2 roughly parallel lines, then usually breaks out in the direction of the pole.

Is a flag pattern bullish or bearish?

Either. A bull flag follows a sharp rise and signals the uptrend may continue. A bear flag follows a sharp fall and signals the downtrend may continue. Neither counts until the price breaks out in the pole’s direction.

How long does a flag pattern last?

It is short compared with the move before it. If the pause drags on much longer than the pole took to form, it is probably turning into a bigger pattern, such as a rectangle or a triangle.

What is the difference between a flag and a pennant?

A flag has 2 parallel lines that slope slightly against the move. A pennant has 2 converging lines that form a tiny triangle. Both follow a sharp move and both are usually continuation patterns.

How do you calculate a flag pattern target?

Measure the height of the flagpole and add it to the breakout point for a bull flag, or subtract it for a bear flag. It is a rough guide only, and it is worth checking against nearby support and resistance.

Go deeper

The free 15-Minute Swing Trader’s Checklist has the daily routine, the questions to ask before every trade, and the five rules that keep you in the game.


About the author. Spencer Li is The 15-Minute Trader and the founder of Synapse Trading. He is a Certified Financial Technician (CFTe) with 15+ years of trading, run from 70+ countries. He holds a B.Acc and B.BM from SMU. Every trade he takes is public, dated, losses left in. He teaches low-risk swing trading in 15 minutes a day, one system for any market.

Educational content only, not personalised financial advice. Trading carries risk, including loss of capital. Past performance is not indicative of future results. Synapse Trading is not licensed or regulated by MAS.
by Spencer Li
https://synapsetrading.com/wp-content/uploads/2026/10/flag-pattern-card.webp 630 1200 Spencer Li https://synapsetrading.com/wp-content/uploads/2026/10/synapse-logo-horizontal-light.png Spencer Li2026-05-06 20:13:262026-09-22 07:24:12What Is a Flag Pattern in Trading? How to Spot One, and When It Fails
Spencer Li

Rising and Falling Wedge Patterns: Bullish or Bearish, and Why?

Technical Analysis & Price Action
Rising and falling wedges - chart patterns

Last updated: 11 July 2026 · By Spencer Li, CFTe


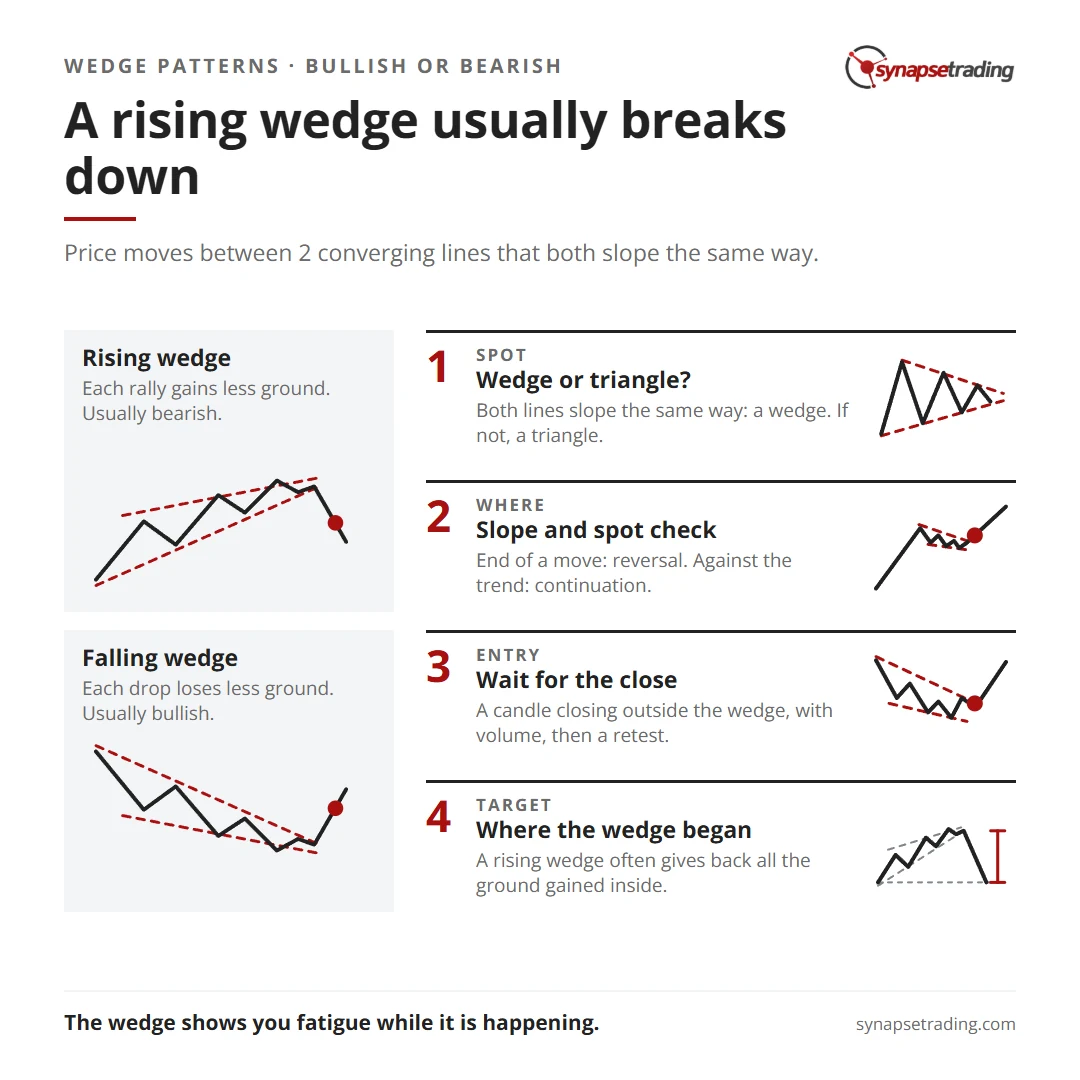
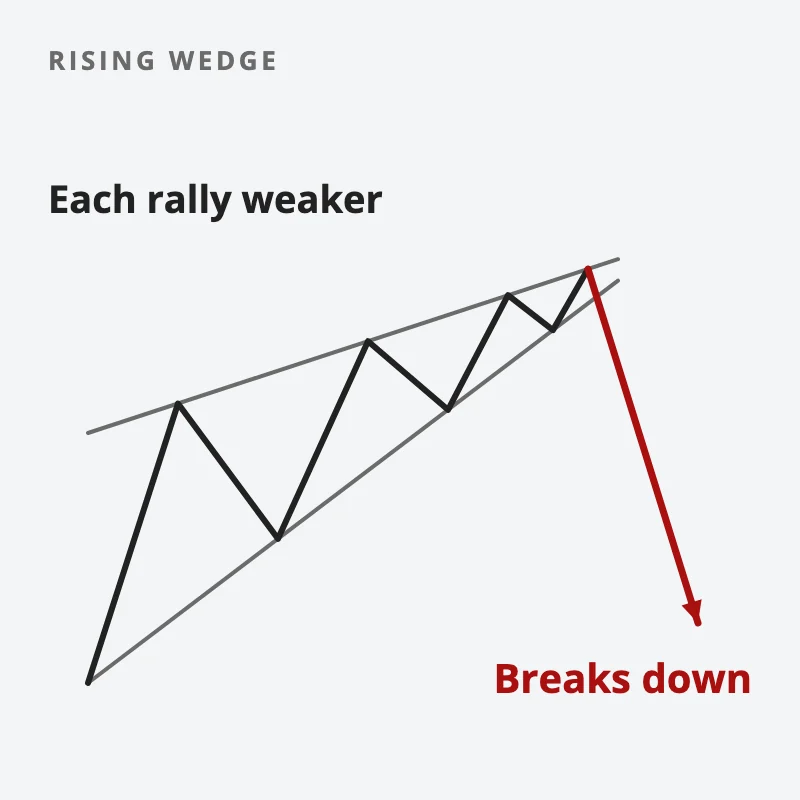
A wedge is a chart pattern where the price moves between 2 converging lines that both slope the same way. A rising wedge slopes up and is usually bearish: the price tends to break down out of it. A falling wedge slopes down and is usually bullish: the price tends to break up out of it.

That sounds backwards. It is also the reason the pattern trips up so many traders, who see a price that keeps making new highs and assume the buyers must still be firmly in control. The answer lies in the shape. In a rising wedge, the price is still climbing, but each push higher gains less ground than the one before. The buyers are tiring, and the narrowing lines show it.

So the slope tells you where the price has been. The squeeze tells you how much energy is left. Below is how to read both, where wedges tend to appear, and how to tell one from a triangle.

A rising wedge usually breaks down. Summary card for the post: Rising and Falling Wedge Patterns: Bullish or Bearish, and Why?.

What does a wedge pattern look like?

Draw a line along the highs and another along the lows. In a triangle, the 2 lines point towards each other from opposite directions, one down and one up, or one flat. In a wedge, both lines point the same way, up or down, and they still meet at a point.

Edwards and Magee, whose 1948 textbook defined most classic chart patterns, put it simply: in a wedge, both boundary lines “either slope up or slope down”. In a rising wedge, the lower line has to be steeper than the upper one, which is why they converge. In a falling wedge, the upper line is the steeper one.

Rising wedgeFalling wedge
Both lines slopeupdown
What the squeeze showseach rally gains less groundeach drop loses less ground
Usual breakoutdownup
Usual leanbearishbullish
After the breakthe drop is often fastthe rise often starts slowly

Why is a rising wedge bearish?

Imagine a stock climbing in a steady channel. Each rally makes a new high, and each dip makes a higher low. That looks healthy, and if you only glance at the latest price you would think nothing is wrong, because every high on the screen is still higher than the one before it. But now suppose the rallies keep getting shorter while the dips keep catching up. The highs are rising by less and less, while the lows are rising faster.

That is a rising wedge, and Edwards and Magee describe exactly what it means: “a gradual petering out of investment interest. Prices advance, but each new up-wave is feebler than the last.” The price is still going up, which keeps the late buyers hopeful. But every push is buying less, and eventually demand runs out and the trend gives way.

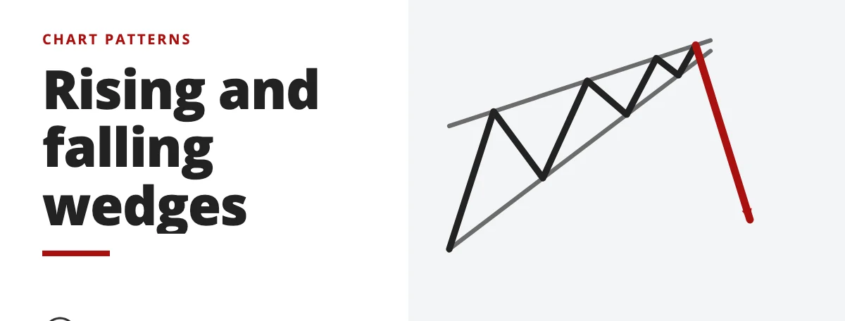
A rising wedge: the price climbs between two upward lines that converge, each rally weaker than the last, then breaks down
In a rising wedge each rally gains less ground, so the price usually breaks down.

They also make a point that surprises most traders. You might think a rising wedge should be even more bullish than an ascending triangle, since both lines point up. It is the opposite. Here is why. An ascending triangle has a flat ceiling, a fixed level where sellers are waiting, and once that supply is absorbed the price can leap. A rising wedge has no such ceiling to break, just a market that is slowly losing interest.

A falling wedge is the mirror. The price is still falling, but each drop loses less ground than the last. The sellers are tiring, and when they run out, the price tends to turn up.

Where do wedges form, and does that change the meaning?

Wedges show up in 2 places, and the place matters as much as the shape. I call this the slope and spot check: first read which way both lines slope, then check where in the trend the wedge sits.

  1. At the end of a move, as a reversal. A rising wedge after a long rise warns that the uptrend is tiring. A falling wedge after a long fall warns that the downtrend is tiring.
  2. Against the trend, as a continuation. A falling wedge inside a bigger uptrend is often just a pullback, and the uptrend resumes when it breaks up. A rising wedge inside a bigger downtrend is often just a rally that fades. Edwards and Magee call the rising wedge “quite characteristic” of bear-market rallies.

Either way, the lean stays the same. A rising wedge leans bearish and a falling wedge leans bullish, which is how our post on continuation and reversal patterns lists them too. What changes is how big the move might be. A wedge that reverses a long trend has more to undo than one that ends a short pullback.

Do note one myth. Wedges are often drawn on the very top of a market, but Edwards and Magee wrote that “wedges seldom appear at major trend reversals”. They are more common as the shape of a correction than as the shape of a grand peak.

If you want a daily routine for checking setups like these, the free 15-Minute Swing Trader’s Checklist is at the end of this post.

How do you tell a wedge from a triangle or a pennant?

Ask which way the lines slope. That is it. If both slope up or both slope down, it is a wedge. If one slopes down and the other up, or one is flat, it is a triangle.

A pennant is the trickier case, because a pennant can also lean against the move before it. The difference is size and setting. A pennant is small and quick, and it hangs off a sharp move called a flagpole. A wedge takes longer, often weeks, and it does not need a flagpole. The full comparison of the short patterns is in pennant vs flag vs triangle, and the bigger cousin has its own post on the triangle pattern.

Edwards and Magee add a useful discipline here. A wedge should be compact, with frequent swings, clearly converging lines and a marked slant. If the slant is mild, or one line is nearly flat, treat it as a triangle, because that is the safer reading.

How do you trade a wedge breakout?

The logic is the same as for any pattern. The breakout tells you the squeeze is over, and a close back inside the wedge tells you the breakout failed.

The 2 wedges behave differently after the break. Know which one you have:

  • Rising wedge. When it breaks down, the drop is often quick. Edwards and Magee say the fall “ordinarily retraces all of the ground gained within the wedge itself, and sometimes more”. So a rough target is the level where the wedge began.
  • Falling wedge. When it breaks up, the price is more likely to drift sideways for a while before rising, which they describe as being “more apt to drift sideways”. Volume often picks up on the upside break. Patience matters more here than speed, and a trader who expects an instant rocket can easily get bored, give up and sell just before the rise finally gets going.

In my own trading, the falling wedge shows up mostly as a pullback inside a strong trend, and sometimes as a breakout setup. The rule is the same one I use for flags. I wait for a candle to close outside the wedge with volume behind it, and most of the time I wait for a retest before acting. For how a pattern target fits with your stop, see where to put your stop loss and take profit.

Is a wedge more reliable than other reversal patterns?

Personally, I rank it below a completed double top or a head and shoulders, because those have a clear neckline to confirm against, while a wedge’s breakout line is sloped and easier to misjudge. If you want the reversal pattern with the clearest confirmation, start with double tops and double bottoms. The wider family is in the price chart patterns guide.

What the wedge does better than almost any other pattern is show you fatigue while it is happening. A stock that is still climbing, with every rally a little weaker than the last, is telling you something the headline price is not. The wedge is simply the 2 lines that make the tiredness visible.

FAQ

Is a rising wedge bullish or bearish?

Usually bearish. Both lines slope up, but they converge because each rally gains less ground, so the price tends to break down out of it.

Is a falling wedge bullish or bearish?

Usually bullish. Both lines slope down, but each drop loses less ground, so the price tends to break up out of it.

What is the difference between a wedge and a triangle?

In a wedge, both lines slope the same way, up or down. In a triangle, the lines slope in opposite directions, or one is flat.

Is a wedge a continuation or a reversal pattern?

It can be either. At the end of a long move it is a reversal. As a pullback against a bigger trend, it is a continuation.

What is the target for a rising wedge?

A common rough guide is the level where the wedge began, since the breakdown often gives back all the ground gained inside the wedge. Treat it as a guide only.

Go deeper

The free 15-Minute Swing Trader’s Checklist has the daily routine, the questions to ask before every trade, and the five rules that keep you in the game.


About the author. Spencer Li is The 15-Minute Trader and the founder of Synapse Trading. He is a Certified Financial Technician (CFTe) with 15+ years of trading, run from 70+ countries. He holds a B.Acc and B.BM from SMU. Every trade he takes is public, dated, losses left in. He teaches low-risk swing trading in 15 minutes a day, one system for any market.

Educational content only, not personalised financial advice. Trading carries risk, including loss of capital. Past performance is not indicative of future results. Synapse Trading is not licensed or regulated by MAS.
by Spencer Li
https://synapsetrading.com/wp-content/uploads/2026/10/wedge-pattern-card.webp 630 1200 Spencer Li https://synapsetrading.com/wp-content/uploads/2026/10/synapse-logo-horizontal-light.png Spencer Li2026-05-05 18:38:402026-07-11 17:25:36Rising and Falling Wedge Patterns: Bullish or Bearish, and Why?
Page 2 of 25‹1234›»

Free checklist

The 15-Minute Swing Trader’s Checklist

The daily and weekly routine I use to find, manage and review trades in about 15 minutes a day, trading since 2007.

Get the free checklist

Topics

  • Trading foundations
  • Technical analysis
  • Strategies and systems
  • Risk and money
  • Trading psychology
  • Markets and products

Synapse Trading

Swing trading for busy professionals, in 15 minutes a day.

Start free

Learn

  • Start here
  • Free trading guides
  • Blog
  • Tools and resources

Programs

  • Trading Mastery Program
  • Daily trading signals
  • Student results
  • Public trade log

Company

  • About
  • Contact me
  • Partnerships
  • Disclaimer
  • Privacy policy
  • Terms & Conditions

Synapse Trading Pte Ltd
Registration No. 201316168H
WhatsApp +65-8897-1204
info@synapsetrading.com

Contact Us

Synapse Trading Pte Ltd
Registration No. 201316168H

Whatsapp: +65-8897-1204
Telegram: @iamrecneps
Email: info@synapsetrading.com

Links

Disclaimer
Privacy policy
Terms & Conditions
Contact us
Partnerships

© 2012-2026 Synapse Trading | All rights reserved. Educational content only, not personalised financial advice. Trading carries risk, including loss of capital. Past performance is not indicative of future results. Synapse Trading is not licensed or regulated by MAS.
  • Link to Facebook
  • Link to X
  • Link to Instagram
  • Link to Youtube
  • Link to LinkedIn
  • Link to Mail
Scroll to top Scroll to top Scroll to top