
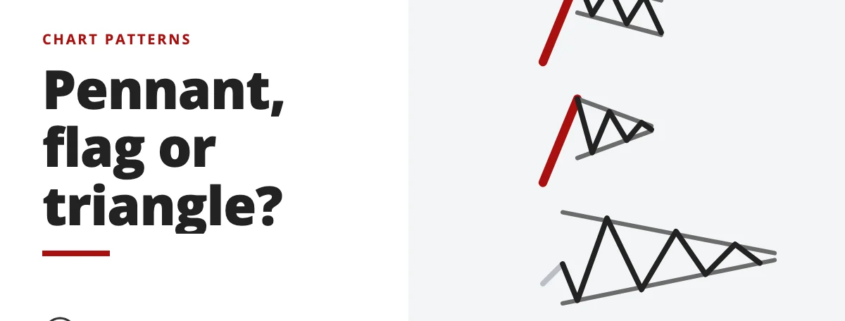
Pennants, flags and triangles all look like pauses. A 3-question test tells them apart, and the answer changes how the price target is measured.

Indicators, candlestick patterns, chart patterns and price-action method.
Indicators, candlestick patterns, chart patterns and price-action method.
Pennants, flags and triangles all look like pauses. A 3-question test tells them apart, and the answer changes how the price target is measured.
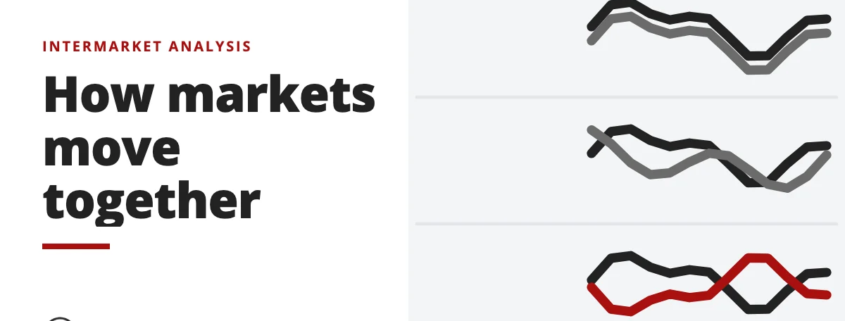
The dollar, commodities, bonds and stocks push on each other in a chain. How the chain works, why the bond and stock link flipped, and how to use it.
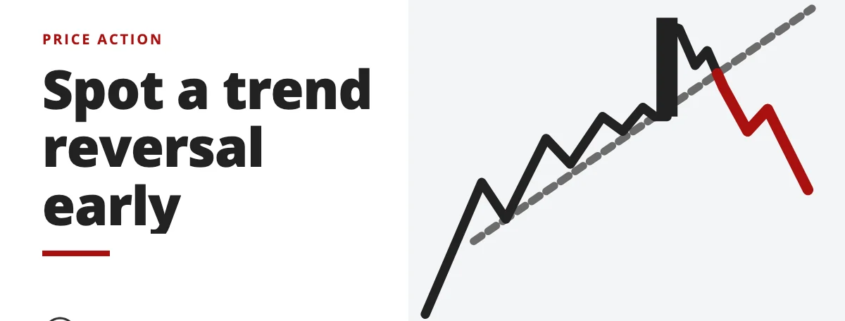
The warning signs that show up before a trend breaks, and why most reversal calls fail. A 3-stage way to read them without fighting the trend.

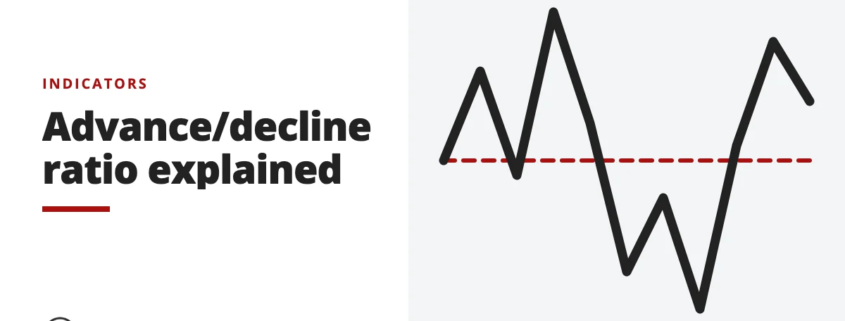
The advance/decline ratio divides the number of advancing stocks by declining ones. See how this market-breadth indicator works and how to read it.
No indicator works every time. See the main limitations of technical indicators, why their signals fail and how to use them with care in your trading.