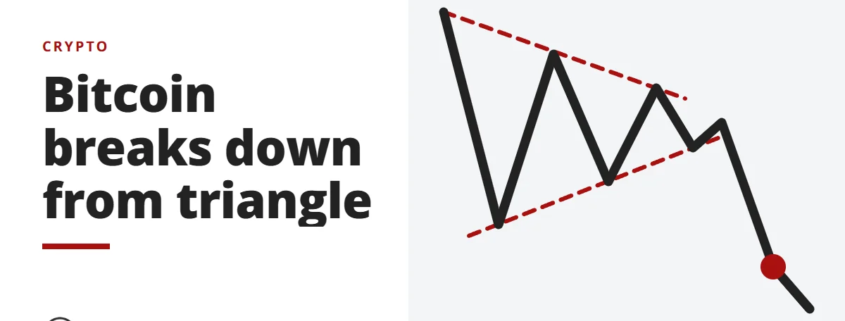
The interesting thing is that if you look carefully you will see both a symmetrical triangle (neutral) and a descending triangle (bearish), so overall the odds of it breaking down was higher than the odds of it breaking up.
The next support level is around the $6800-$7000 level, so we might see a small pullback, followed by more bearish movement downwards.
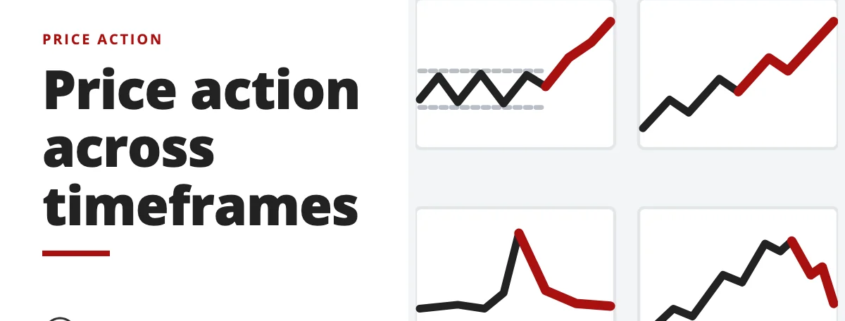
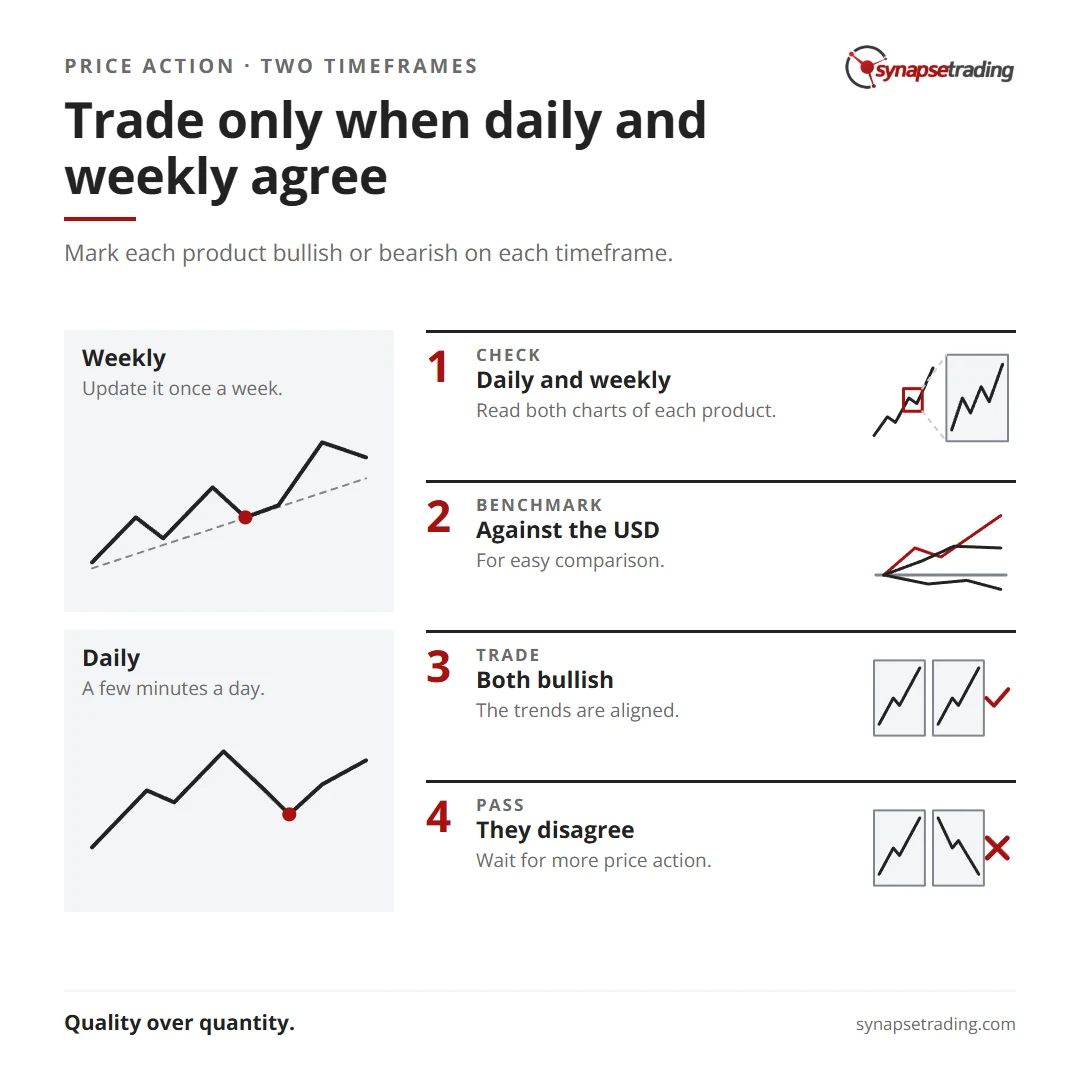
One of the simple yet powerful techniques I use to allow me to quickly identify trading opportunities with minimal time and effort (typically 15 minutes a day), is to use this Excel table which combines price action with multiple timeframes.
To create this table, I observe the daily and weekly charts of various products (forex, stocks, cryptocurrencies, commodities, etc), and list down whether I think it is bullish or bearish on each timeframe. For the weekly chart, I only need to update it once a week, and for the daily chart, this takes me a few minutes a day.
Here are some chart examples:
This is the daily chart of the EUR/USD, and you can see that it just completed a pullback and is looking bullish. So under EUR, I mark it as bullish. For most products, I always benchmark them against the USD for easy comparison.
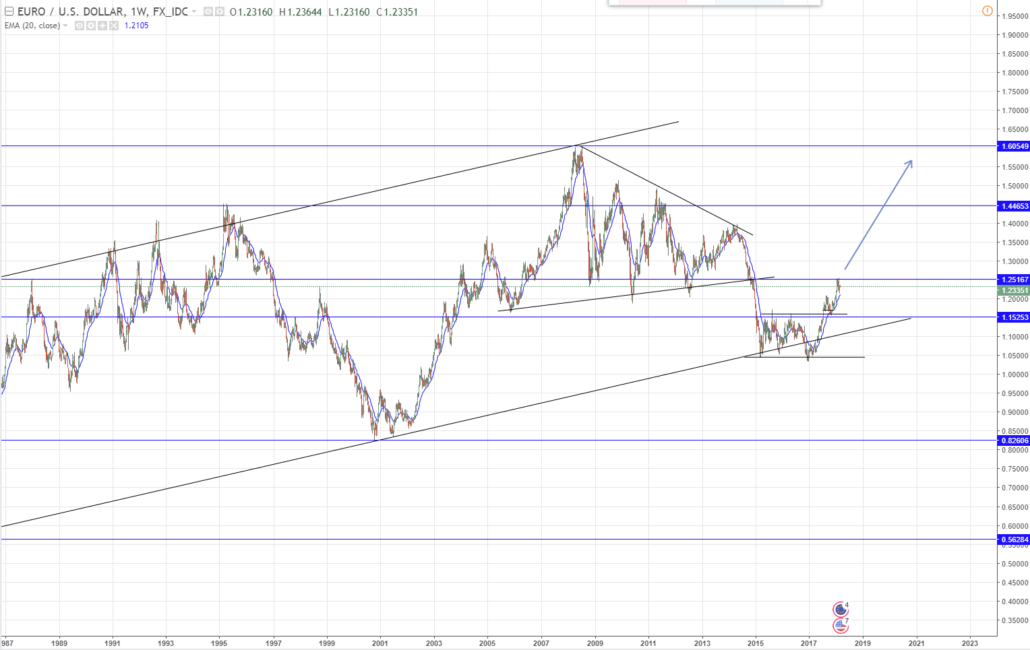
This is the weekly chart of the EUR/USD, and you can see that it is also very bullish, and rebounding off a large trendline. With the alignment of both the daily and weekly trends, the EUR/USD is bullish on both timeframes.
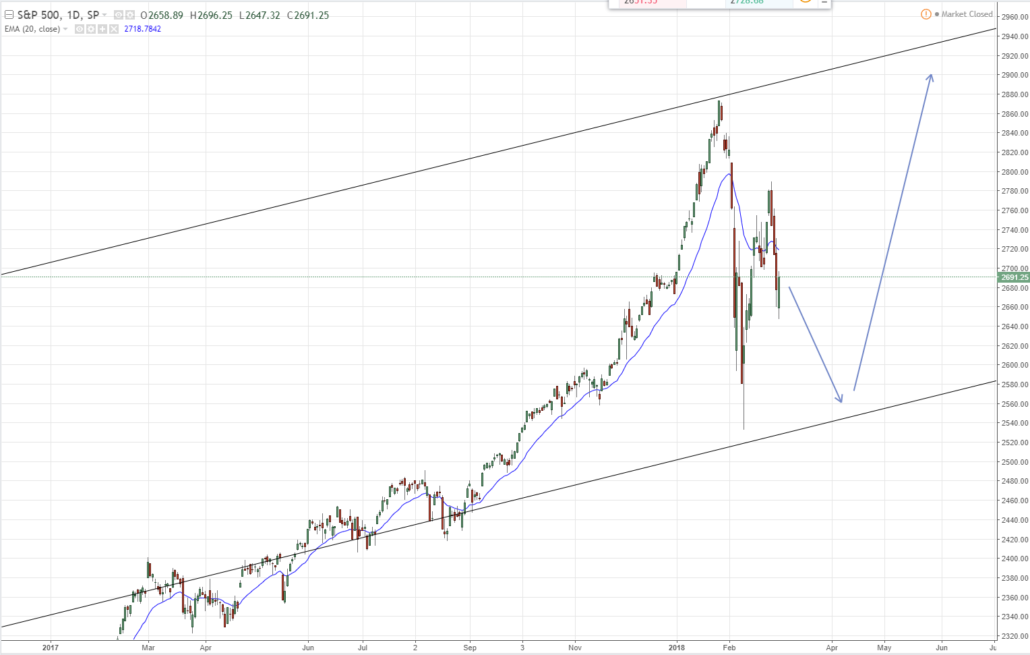
For the S&P 500, the long-term trend is bullish, but the short-term trend is bearish. In such a scenario, we will pass and wait for more price action. The goal is to take the best trades, not take as many trades as possible. Quality over quantity.
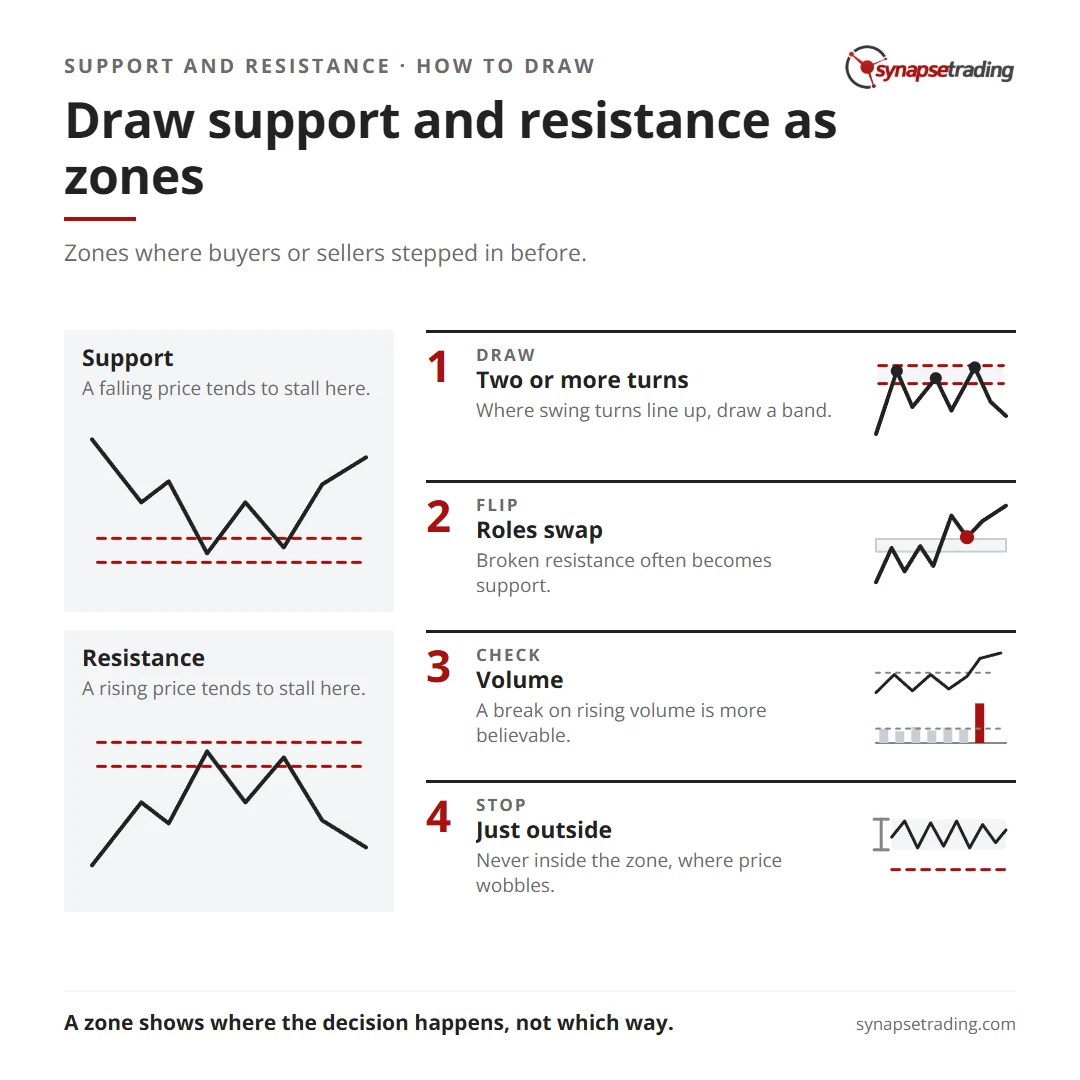
Support is a price zone where buyers have stepped in before, so a falling price tends to stall there. Resistance is the mirror image: a zone where sellers have stepped in before, so a rising price tends to stall. You draw both from turning points the chart has already printed, and you draw them as zones rather than single lines, because price rarely turns at the exact same cent twice.
This post goes with the video above, from our market-timing series. The trend tells you which direction to trade. Support and resistance tell you where on the chart the buying and selling decisions tend to happen.
Support and resistance zones are like invisible lines on a price chart which prices and traders react to. They signal a great opportunity to either enter or exit a trade. These zones usually correspond with the pattern by which a particular security has moved in the past. For instance, let’s say a stock reaches a certain price level before declining, it goes down for about a year before hitting its bottom and turning back up again.
The next time that stock approaches the price at which it first began to decline, some investors will start to sell it off, anticipating that it will decline once again. This is how a resistance zone is created. And when that stock approaches the price at which it last turned around, many investors will step in and buy it. That is how a support zone is created. Securities sit in these zones temporarily, while buyers and sellers try to figure out whether to jump in or jump out of the market. The key is to watch carefully how prices react in the support or resistance zone because eventually, one of two things will happen.
The zone will either hold and the price will reverse direction or the security will break through and continue on its trajectory. Breakthroughs tend to recalibrate a security’s support and resistance zones. For example, often when a security breaks through a resistance zone that same level becomes its support zone during the next cycle. That’s because of all the investors who missed the chance to benefit last time around and are looking to either buy the security for cheap or sell it before it declines.
Will the level hold or break?
After a break, expect price to come back and test the level it just broke, which is the flip from the paragraph above playing out. Volume is the tiebreaker. A break on rising volume is more believable than one on fading volume. And if price slips back through the level after the break, treat it as a false break: the zone held after all, and any trade idea built on the break is void.
So the first job is finding the zones. Once you have them on the chart you are watching, you plan entries and exits near those zones, and much less in the empty space between them. A zone will not tell you which way price goes next. It tells you where the decision is likely to happen, and where a stop belongs if your read turns out to be wrong.
How do I draw a support or resistance zone?
Start on a daily or weekly chart, with price on a normal (arithmetic) scale rather than a log scale, so every swing is measured in plain price. Then mark the obvious turning points: the swing highs where price turned down, and the swing lows where it turned up.
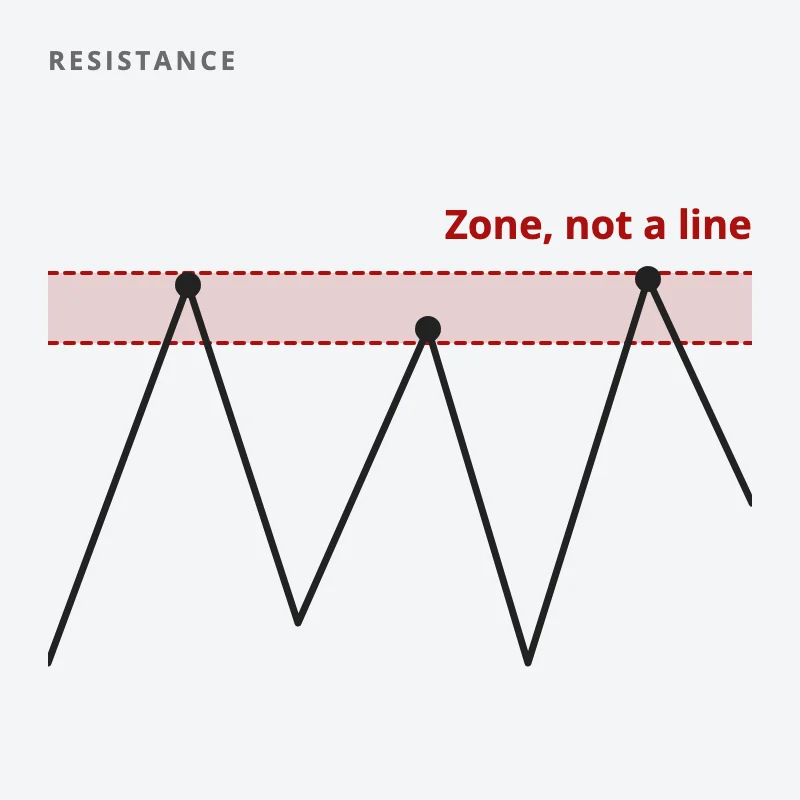
Now look for prices where two or more of those turns line up. That is your zone. Draw it as a band wide enough to hold the wicks of those candles, instead of one line through a single candle, because a thin line invites you to read a tiny overshoot as a breakout.
Draw support and resistance as a zone through two or more turns, not a thin line.
Some zones matter more than others. A zone gets stronger with each extra touch, with heavy volume at the turn, and when it has flipped roles, such as old resistance that now holds as support. A zone with one touch on thin volume is closer to a guess, so it gets less weight.
Finally, the stop. If you trade off a zone, the stop goes just outside it, never inside it or halfway between two zones. Inside the zone is exactly where price is expected to wobble.
How do I draw the trendline?
A trendline is support or resistance that slopes. In an uptrend, join two or more rising swing lows, and the line becomes support. In a downtrend, join two or more falling swing highs, and it becomes resistance.
Watch how price arrives at the line. Price drifting into it on light volume tends to hold. Wide bars and heavy volume as price gets close are the early warning that the line is about to give way.
Educational content only, not personalised financial advice. Trading carries risk, including loss of capital. Past performance is not indicative of future results. Synapse Trading is not licensed or regulated by MAS.
https://synapsetrading.com/wp-content/uploads/2026/10/free-video-tutorials-behavioral-analysis-market-timing-4c-support-resistance-card.webp6301200Spencer Lihttps://synapsetrading.com/wp-content/uploads/2026/10/synapse-logo-horizontal-light.pngSpencer Li2015-05-29 08:00:252026-10-08 18:42:40How to Draw Support and Resistance Levels
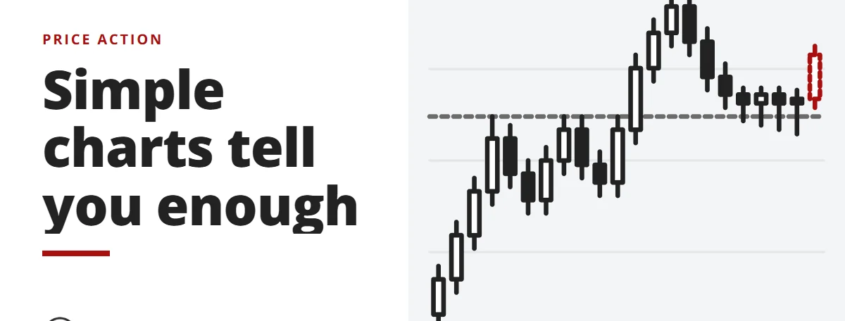
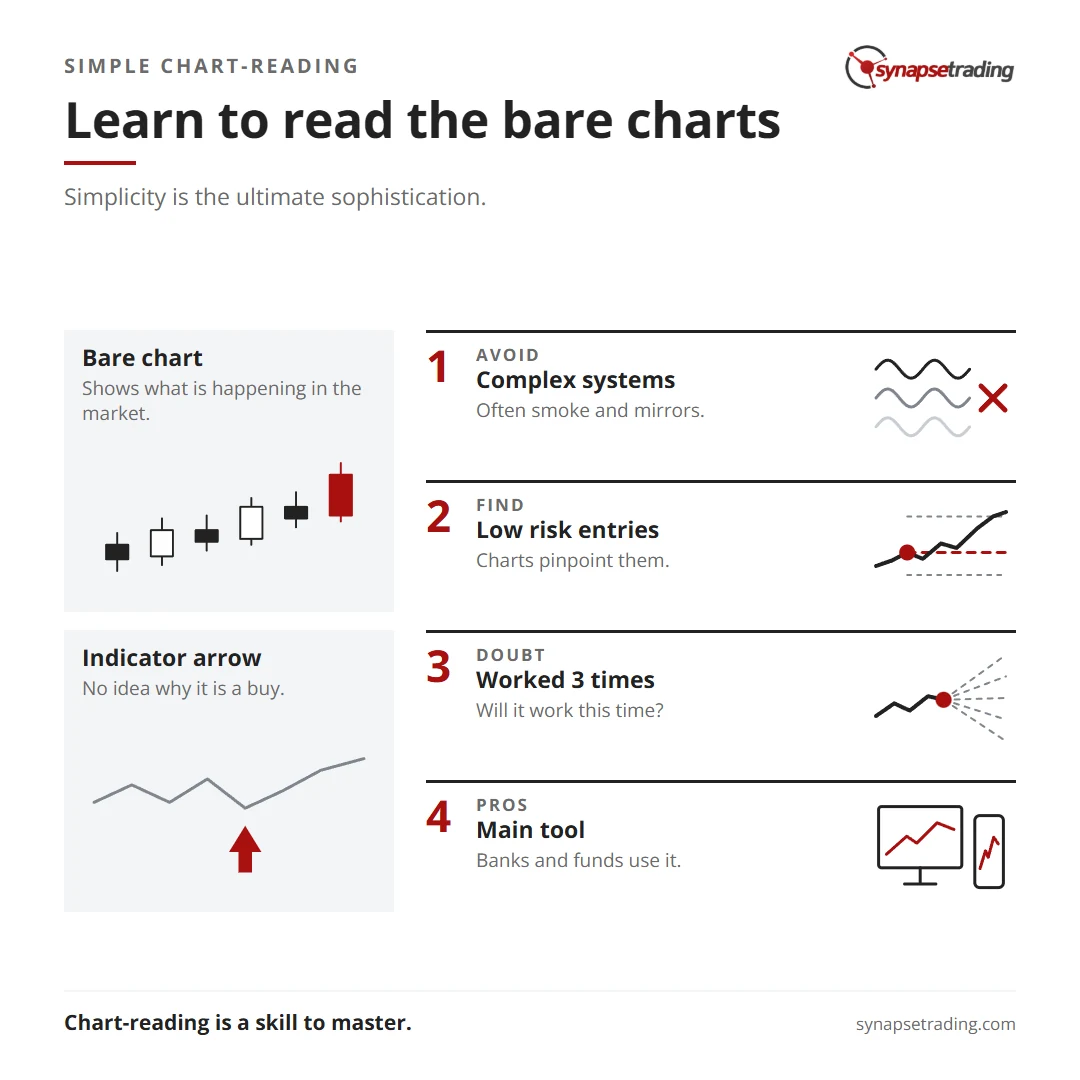
Leonardo Da Vinci once said that simplicity is the ultimate sophistication. Let’s take a moment to ponder that. This applies to research analysis as well. When you hear people talking about some sophisticated trading system or some flashy indicators or some complex wave projections, think again. It is more likely to be smoke and mirrors. All these tell you nothing new if you know how to read the bare charts. It’s as simple as that. Simple, and yet sophisticated. Looking back at my last few stock picks, I found that it is possible to read and understand what is happening on the charts. This makes it possible to pinpoint the low risk entry points, as seen in some of my previous posts.
Compare that with indicators. If you see a green arrow, do you know why it is a buy? Maybe it worked the past 3 times, but will it work this time? Maybe. Or maybe not. You won’t know. In fact, you won’t have any idea why there is a green arrow. You won’t know what is happening in the market. You won’t know what the smart money is doing. That is why chart-reading is an important skill everyone should master. Banks, funds and proprietary trading firms use it as their main tool. Maybe you should consider it too.
https://synapsetrading.com/wp-content/uploads/2026/10/simple-chart-reading-can-tell-you-all-you-need-to-know-card.webp6301200Spencer Lihttps://synapsetrading.com/wp-content/uploads/2026/10/synapse-logo-horizontal-light.pngSpencer Li2011-09-05 23:10:582026-09-29 09:14:44Simple chart-reading can tell you all you need to know