• Link to Facebook
  • Link to X
  • Link to Instagram
  • Link to Youtube
  • Link to LinkedIn
  • Link to Mail
Free PDF: The 15-Minute Swing Trader's Checklist, the daily routine of a trader since 2007
Synapse Trading
  • Mentoring
    • Trading Mastery Program
    • All mentoring options
  • Signals
    • Daily trading signals
    • Signals trade log
  • Results
    • Student results and testimonials
    • Public trade log, losses left in
  • Free guides
    • Start here
    • Trading foundations
    • Technical analysis
    • Strategies and systems
    • Risk and money
    • Trading psychology
    • Markets and products
    • Free trading guides
    • Tools and resources
    • Blog
  • About
    • My background
    • My trading journey
    • Media and interviews
    • Travel log
  • Contact
    • Contact me
    • Partnerships
  • Start free
  • Click to open the search input field Click to open the search input field Search
  • Menu Menu

Forex, stocks, crypto, options and commodities – what you trade, as opposed to how.

Spencer Li

What is the CPI (Consumer Price Index) and How to Trade it?

Markets & Products
Trading the CPI release - market news

What Is the CPI (Consumer Price Index), and How Do Traders Use It?

Last updated: 8 October 2026 · By Spencer Li, CFTe


The Consumer Price Index (CPI) is a monthly measure of the average change in prices that consumers pay for a fixed basket of goods and services, and it is the number traders watch most closely to read inflation. It is published by a national statistics agency (in the US, the Bureau of Labor Statistics), and the year-over-year change in the CPI is what people mean when they say “the inflation rate.” For traders, the CPI matters for one reason above all others: it shapes what the central bank does with interest rates. A hotter-than-expected CPI tends to push rate expectations up, which usually pressures stocks and bonds. A cooler-than-expected CPI tends to do the opposite. The single most useful number in the report is not the headline figure itself but how it lands versus the forecast, and that is the part most beginners miss.

Here is what the CPI is, how it is built, the numbers inside the report, and how traders actually use it on release day.
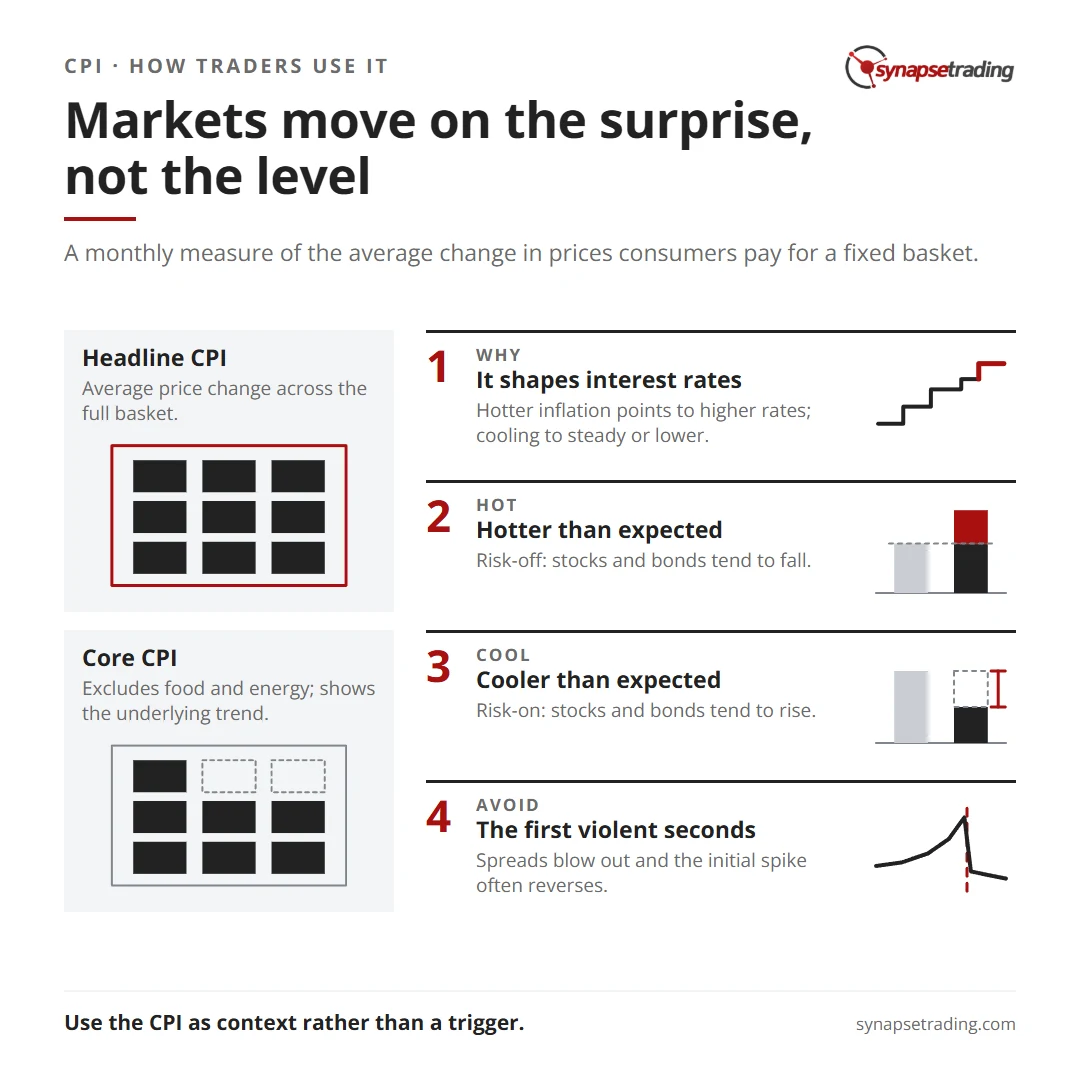
Markets move on the surprise, not the level. Summary card for the post: What is the CPI (Consumer Price Index) and How to Trade it?.

What is the CPI, and where did it come from?

The Consumer Price Index measures the average change over time in the prices paid by consumers for a basket of everyday goods and services. Divide this period’s basket price by an earlier period’s, and you get a measure of how much the cost of living has moved. When the index rises, your money buys less. That loss of purchasing power is inflation.

The CPI has been around longer than most people assume. The US Bureau of Labor Statistics (BLS) started collecting price data in the late 19th century. It was formally tasked with calculating the CPI in 1918, and the first official US CPI was published in 1919. Today most countries run their own version, and it remains the standard yardstick for inflation, purchasing power, and the cost of living.

How is the CPI calculated?

The CPI comes from a statistical survey. The agency builds a basket of goods and services meant to represent what a typical household actually buys, then tracks the prices of those items over time. The basket is refreshed periodically as spending habits change, so it does not get stuck measuring things nobody buys anymore.

The calculation runs in five steps:

  1. Select the basket. Choose goods and services that represent typical consumer spending.
  2. Collect price data. Sample prices at regular intervals (usually monthly) from retail outlets, service providers, and rental markets.
  3. Weight the prices. Give each item importance based on how much of the household budget it eats up. Housing carries far more weight than apparel, because people spend far more on it.
  4. Calculate the average. Combine the weighted prices into a single basket price.
  5. Calculate the inflation rate. Compare that basket price across periods. The percentage change is the inflation rate.

Do note that the CPI is only one way to measure inflation. Two others you will see referenced are the Producer Price Index (PPI), which tracks prices at the wholesale/producer level rather than the consumer level, and the GDP Deflator, which covers the whole economy’s output. They tell slightly different stories, which is why a sharp reading often cross-checks them.

What are the key numbers in the CPI report?

The release is not one number. It is a stack of them, and knowing which line moved tells you where the inflation is coming from. Here are the main figures, what each one measures, and why a trader cares.

NumberWhat it measuresWhy a trader watches it
Headline CPIAverage price change across the full basketThe marquee figure; sets the first market reaction
Core CPICPI excluding food and energyStrips out the volatile stuff; central banks lean on this for the underlying trend
Inflation ratePercentage change in CPI over a period (usually year-over-year)The “is inflation rising or cooling” read
Food and beverage indexPrices of food and drinksVolatile component; can swing headline without changing the trend
Energy indexGasoline, electricity, heating oilThe other volatile component; oil shocks show up here first
Housing indexRent, owners’ equivalent rent, shelterThe heaviest-weighted component; slow-moving but dominant
Transportation indexGasoline, motor vehicle insurance, public transitMixes energy and services
Medical care indexHospital, physician, prescription drug pricesA persistent, sticky-services read
Apparel indexClothing and footwearSmall weight; rarely the story

The reason core CPI (the headline number minus food and energy) gets so much attention is that food and energy prices jump around for reasons that have nothing to do with broad inflation, like a cold snap or an oil supply shock. Strip them out and you see the underlying trend more clearly. That is why a central bank, and a sharp trader, will often watch core more closely than the headline.

How do traders and investors use CPI data?

The CPI matters to markets through one main channel: interest rates. Inflation erodes the value of money, so when it runs hot, central banks tend to raise rates to cool it down. Higher rates tend to slow spending and growth, which is generally a headwind for stocks and bonds. When inflation runs cold, central banks can cut rates to encourage spending, which is generally a tailwind.

So traders read the CPI as a clue about the central bank’s next move. Rising, hotter inflation points toward higher rates ahead. Cooling inflation points toward steady or lower rates. From there, traders adjust positioning, lean their bias for stocks and bonds, and decide on the timing and size of trades around the release.

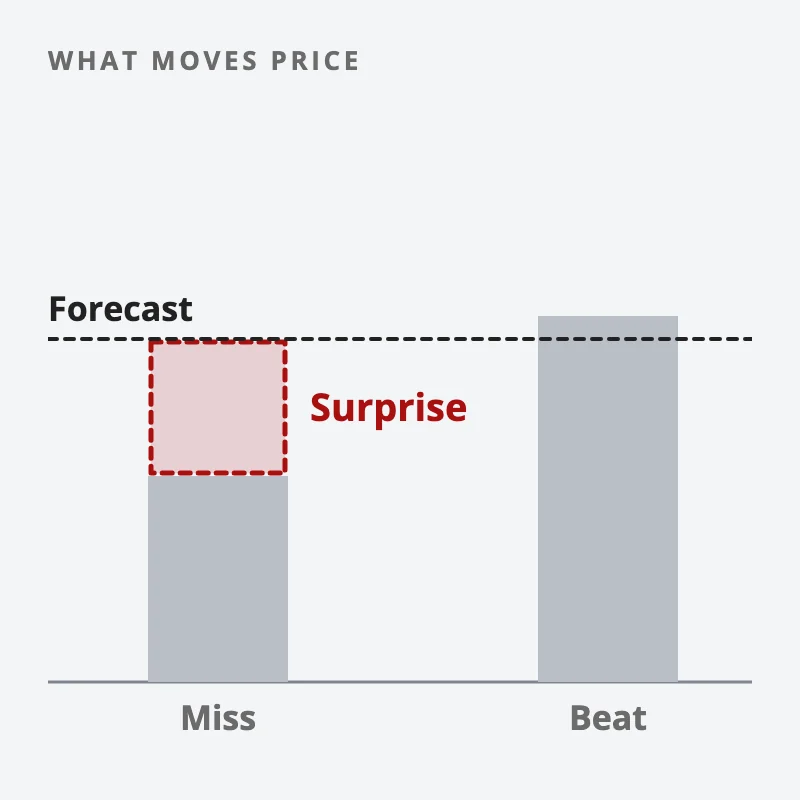
Here is the part that trips up beginners. The market does not react to whether inflation is high or low in absolute terms. It reacts to the number versus what was already expected. A high CPI that everyone forecast is mostly priced in already. The move comes from the surprise, the gap between the actual print and the consensus forecast. This is the one rule to internalize before you ever trade a release.
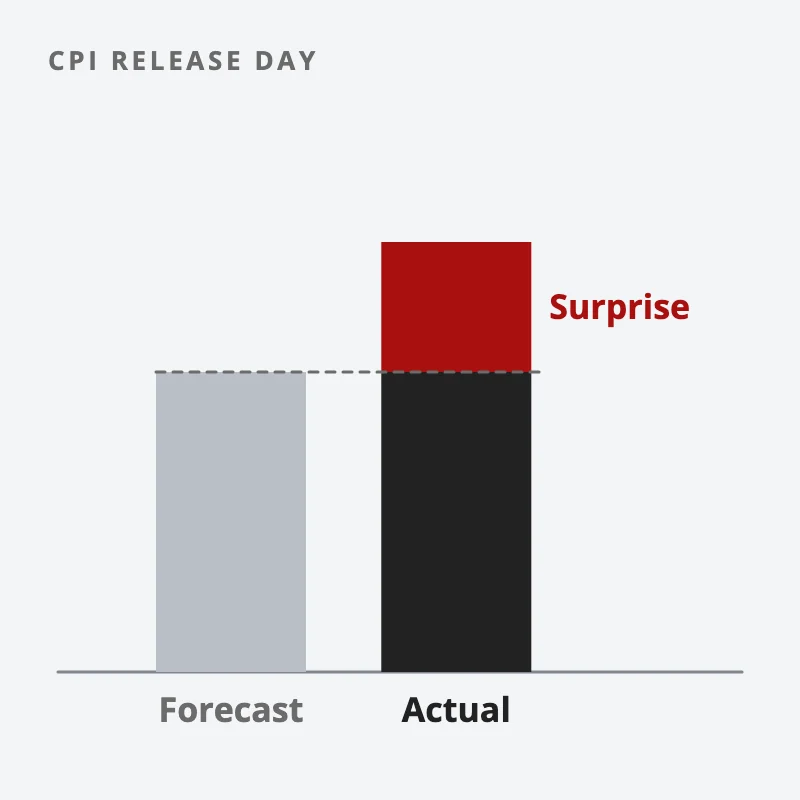
Two bars, forecast and actual CPI; the part of the actual bar above the forecast is red and labelled surprise
Markets move on the gap between the CPI print and the forecast, not the level.

News trading on CPI: what actually happens at the release

On release day, two figures do most of the work: the headline CPI and the core CPI (excluding food and energy). Traders compare both against the consensus forecast and gauge the surprise, then map that to a rate expectation. Here is the simplified cheat sheet.

CPI versus forecastWhat it signalsTypical first reaction
Hotter than expectedInflation is a concern; central bank may hikeRisk-off: stocks and bonds tend to fall
In line with forecastStory unchanged; surprise is smallMuted; the move is usually small
Cooler than expectedInflation easing; central bank may hold or cutRisk-on: stocks and bonds tend to rise

Personally, I do not trade the first violent seconds of a CPI print, and I would gently steer a new trader away from it too. The spreads blow out, the initial spike often reverses, and you are competing with machines that read the number in milliseconds. The cleaner edge is in the hours and days after, once the market has digested the surprise and a real direction settles in. The release is the catalyst. Your job is to trade the move it sets up.

This is where the human edge lives. A data feed will deliver the CPI number to a thousand traders at the exact same instant, and a bot will price the surprise before you have finished reading the second decimal. What the feed will not do is tell you to sit on your hands through the first whipsaw, size the trade for a volatile release, or skip the day entirely because the surprise was too small to bother with. The number is free. The judgment about whether to act on it is the part worth learning, and it is the first of the Five Edges no algorithm can trade for you.

Should you add the CPI to your trading toolbox?

For most traders, yes, but as context rather than a trigger. The CPI is one of the cleanest reads you have on inflation and, by extension, on what the central bank is likely to do next. Even if you never trade the release itself, knowing whether inflation is running hot or cooling helps you understand why the market is doing what it is doing. That context is worth far more than chasing one volatile number once a month.

FAQ

What is the CPI in simple terms?
The Consumer Price Index measures the average change in the prices of a basket of everyday goods and services that consumers buy. The year-over-year change in the CPI is what people call the inflation rate.

Why does the CPI move the stock market?
Because it shapes interest-rate expectations. A hotter-than-expected CPI raises the odds of rate hikes, which tends to pressure stocks and bonds. A cooler-than-expected CPI does the opposite. The reaction comes from the surprise versus forecast.

What is the difference between headline CPI and core CPI?
Headline CPI covers the full basket. Core CPI excludes food and energy, which are volatile and can swing the headline for reasons unrelated to broad inflation. Central banks lean on core to read the underlying trend.

Is the CPI the same as the inflation rate?
Not quite. The CPI is the index (a price level). The inflation rate is the percentage change in that index over a period, usually a year. The inflation rate is derived from the CPI.

How is the CPI different from the PPI?
The CPI measures prices at the consumer level. The Producer Price Index (PPI) measures prices at the producer or wholesale level, earlier in the supply chain. PPI moves can sometimes hint at where CPI is heading.


So, is the CPI something you will add to your own trading toolbox, or do you prefer to stay out of the way on release day? Let me know in the comments.

And if you want the full framework for trading scheduled economic releases, read the pillar: The Trader’s Guide to News and Economic-Data Trading.

Want a system that does not depend on calling the next CPI? Grab the free 15-Minute Swing Trading Starter Kit. It is the exact routine I use to scan once a day and trade any market in 15 minutes, no economic-calendar gambling required.


About the author. Spencer Li is The 15-Minute Trader and the founder of Synapse Trading. He is a Certified Financial Technician (CFTe) with 15+ years of trading, run from 70+ countries. He holds a B.Acc and B.BM from SMU. Every trade he takes is public, dated, losses left in. He teaches low-risk swing trading in 15 minutes a day, one system for any market.

Education, not financial advice. Synapse Trading is not licensed by MAS to advise on investment products. Trading carries risk of loss; past performance is not indicative of future results.


Related

The Trader’s Guide to News and Economic-Data Trading · How to trade the NFP (Non-Farm Payrolls) report · What is the FOMC (Federal Open Market Committee) Meeting and How to Trade it?
by Spencer Li
https://synapsetrading.com/wp-content/uploads/2026/10/cpi-consumer-price-index-card.webp 630 1200 Spencer Li https://synapsetrading.com/wp-content/uploads/2026/10/synapse-logo-horizontal-light.png Spencer Li2023-02-08 18:25:132026-10-22 13:21:18What is the CPI (Consumer Price Index) and How to Trade it?
Spencer Li

What Does NFP Mean? The Non-Farm Payroll Report, Explained for Traders

Markets & Products
What NFP means for traders - market news

What Does NFP Mean? The Non-Farm Payroll Report, Explained for Traders

By Spencer Li, CFTe · Last updated: 11 September 2026

NFP stands for Non-Farm Payroll. It is the monthly count of how many jobs the US economy added or lost, published by the US Bureau of Labor Statistics (BLS) in a report called the Employment Situation. It counts almost every paid job in the country, government jobs included, and leaves out farm workers, the self-employed and people employed by private households.

The report usually comes out on the first Friday of the month at 8:30am New York time, which is 8:30pm in Singapore for most of the year and 9:30pm from November to mid-March.

For a few seconds after it lands, it is probably the most-watched number in finance. Stocks, bonds, gold and the US dollar can all jump in the same minute, because jobs drive spending, spending drives inflation, and inflation decides what the Federal Reserve does with interest rates.

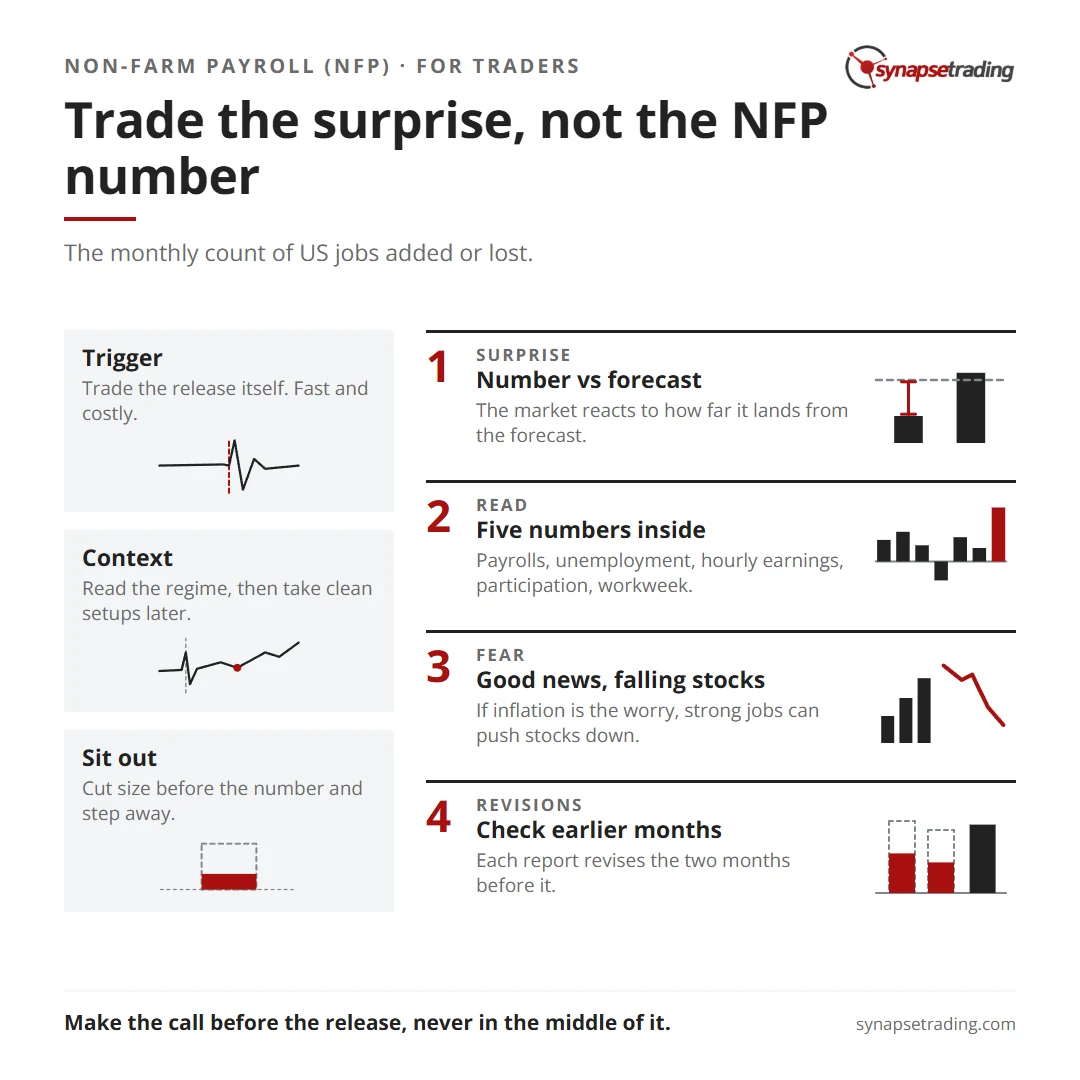
It took me years to really appreciate that the market barely reacts to the number itself. It reacts to the surprise. That is how far the number lands from what economists expected, and once the idea clicks, most of what happens on NFP night starts to make sense.

Trade the surprise, not the NFP number. Summary card for the post: What Does NFP Mean? The Non-Farm Payroll Report, Explained for Traders.

What happens when the jobs report does not show up?

The easiest way to show how much the market leans on this one report is to tell you about the month it went missing.

In October 2025, the US government shut down because Congress had not passed its funding. The BLS is a government agency, so it stopped work along with everyone else. The October jobs report never came out. The household survey for that month was never even collected. The BLS has said it will not be collected afterwards either, so America’s job data now has a permanent gap where October 2025 should be.

I talked about this in my weekly outlook at the time, because the market did something quite strange. With no jobs report and very little other data coming out, traders had nothing to argue about, and the market just kept slowly creeping up. It turns out that a market with nothing to argue about is a fairly calm place.

When the delayed November report finally arrived on 16 December, traders suddenly had two months of payroll numbers to digest at once, and the arguments came back right on schedule.

So the NFP matters for two reasons, and only one of them is the data. The other is that the whole market uses it as a shared scoreboard. When the scoreboard disappears, everyone is left trading on guesswork.

Where does the NFP number come from?

The BLS builds the report from two separate surveys. It helps to know which number comes from which, because the two can tell quite different stories in the same month.

The first is the establishment survey, also called the payroll survey. Every month the BLS asks about 119,000 businesses and government agencies, covering roughly 622,000 worksites, how many people they paid in the pay period that includes the 12th of the month. The headline NFP number, the one flashing on every screen at 8:30pm, comes from here.

The second is the household survey, which works more like a small census, asking about 60,000 households who at home is working and who is out of work but still looking. That is where the unemployment rate comes from.

Because one survey asks employers and the other asks families, you can get a month where payrolls look strong while the household survey looks soft, and the debate on financial TV that night is mostly about which survey to believe. The payroll survey gets the headline because its sample is so much bigger, but a household survey that keeps disagreeing month after month is usually worth a closer look.

Both surveys are also seasonally adjusted. The BLS strips out the patterns that repeat every year, like shops hiring extra staff for Christmas and letting them go in January, so that what you see is the underlying trend rather than the calendar.

If you trade around a full-time job, you do not need to follow every survey to use this report. My free trading guides are a better place to start.

What are the five numbers inside the report?

Most people only ever hear the headline. The report actually carries five numbers, and in some months the headline turns out to be the least important of them.

NumberWhat it measuresA hotter-than-expected reading usually means
Non-farm payrollsJobs added or lost against last monthThe economy is growing and the US dollar firms
Unemployment rateShare of the labour force out of work and lookingA falling rate makes rate cuts less likely
Average hourly earningsPay per hour across payroll workersInflation worry rises, bond yields rise, stocks can fall
Participation rateShare of adults working or looking for workMore people are coming back into the job market
Average workweekHours worked per weekFirms need more hours from the staff they already have

To give you a sense of how big these numbers can get, the largest monthly fall in the history of the data came in April 2020. As the pandemic closed down whole industries, payrolls dropped by 20.5 million in a single month, and the unemployment rate jumped to 14.7%. No month since has fallen anywhere near that far.

Why does the surprise matter more than the number?

If you grew up in Singapore, you already understand this from results day in school. A B is good news if everyone expected you to get a C. It becomes a very different conversation at the dinner table if everyone expected an A. The grade is exactly the same, and the reaction depends entirely on what people expected.

The NFP works the same way. Before every release, economists publish a forecast, usually called the consensus, and you can see it for free on any economic calendar. Here is a made-up example with round numbers.

Say the consensus is 150,000 new jobs, and the report shows 90,000.

That is a miss of 60,000 jobs, or 40% below the forecast, and the market will usually move hard.

Now say that next month the consensus is 150,000 again, and the report shows 160,000. That is a beat of only 10,000, or about 7%, and the market barely blinks, even though 160,000 is a perfectly healthy number for the US economy.

So what you are really trading on NFP night is the gap between the number and the forecast. The number is the grade, the consensus is the expectation, and the price move is the conversation at the dinner table.

Two jobs reports against the same forecast line: one far below it, with the gap marked in red as the surprise, and one just above it
The market trades the gap between the NFP number and the forecast, not the number itself.

Why can good jobs news be bad for stocks?

This is the part that confuses most new traders, and I watched it play out again in June 2026. The jobs report came in good, and the market fell anyway, because people read a strong report as a sign that the Fed would hold off on cutting rates.

On a normal day, more jobs should be good for stocks, because more people working means more spending, more spending means more company profits, and profits are what stocks are priced on in the end.

But suppose the economy is already running hot and inflation is the thing everyone is worried about. Now a strong jobs number, especially with fast wage growth behind it, tells the Fed it has no reason to cut rates, and it may even need to raise them. Higher rates make borrowing more expensive for companies and households, and they make bonds look better against stocks. So the same news that feels like a win for the economy can send stocks lower.

Hence, before every release, I find it useful to ask what the market is actually afraid of right now. When the fear is a recession, a strong report brings relief. When the fear is inflation, the same strong report becomes a threat. The number is the same either way. Only the fear has changed.

Reading the market’s fear is a habit. Habits are easier to keep with a routine, and my free trading guides are where I would start building one.

Why do the revisions matter as much as the headline?

The NFP is one of the few numbers in finance that is allowed to change its mind. Every report also revises the two months before it, because more businesses send in their numbers late. Sometimes the revision is the story.

The clearest recent example came on 1 August 2025. The report showed only 73,000 jobs added in July, and in the same release the BLS revised May and June down by a combined 258,000 jobs. Later that day, the President fired the commissioner of the BLS.

I am not taking a side on the politics here. For a trader, the lesson is that a strong headline paired with a big cut to the previous months can read as a weak report overall. So it is always worth scrolling past the first number before deciding what the report is really saying.

Should you trade the NFP release itself?

On 1 August 2025, a trader on Reddit’s r/Daytrading asked a fair question: “Should NFP week be avoided or just the day?” The post went up about 16 minutes before the July report, which then arrived with 258,000 jobs revised away, so the timing was better than most.

For a swing trader, my answer is neither. The danger sits in the minutes around the release, not in the whole week, and as for trading the release itself, I would not start a beginner there. In the first few minutes after the release, spreads widen and price often spikes one way before reversing the other, and plenty of stops get hit on both sides of the same candle.

For most swing traders, the NFP works much better as context than as a trigger. I think of it as the Trigger, Context or Sit-out call, and the important thing is to make it before the release, never in the middle of it.

  1. Trigger. Trade the release itself. It is fast and expensive in spreads, and it suits professionals with tight execution far more than it suits someone trading after work.
  2. Context. Let the report tell you which regime you are in, whether the economy is heating up or cooling down, and then take clean setups in the days after, well away from the release minute.
  3. Sit out. Cut size before the number and step away from the screen. In Singapore it lands at dinner time, which makes this one surprisingly easy.

My own trading plan says to close or reduce positions before major news like the NFP, and to let the report shape the swing trades I take afterwards. That is really a mix of Sit out and Context.

That rule does not keep me off the market on NFP Friday. My own records show it. As at March 2026, counting from June 2024, 25 of the 475 closed trades in my public trade log were opened on an NFP release day, each sized at 10% of capital. Of those 25, 13 were winners, a 52% hit rate against 50% on every other day in the log. So NFP Friday was neither lucky nor unlucky for me. It was a Friday with more noise.

FAQ

What does NFP stand for?
NFP stands for Non-Farm Payroll. It is the monthly US jobs number from the Bureau of Labor Statistics, counting the jobs added or lost across the economy outside farming.

What time is the NFP released in Singapore?
It is released at 8:30pm Singapore time during US daylight saving, which runs from March to early November, and at 9:30pm the rest of the year. That is 8:30am in New York.

Does the NFP include government jobs?
Yes. It counts federal, state and local government employees. It leaves out farm workers, the self-employed and private household staff.

Why was there no NFP report for October 2025?
The US government shutdown stopped the BLS from working, so no October 2025 report was published. The household survey for that month was never collected, and the payroll figures came out late, with the November report on 16 December 2025.

Is a high NFP number good or bad for stocks?
It depends on what the market fears. In a growth scare, a strong number helps. When inflation is the worry, a strong number with fast wage growth can push stocks down, because it lowers the odds of a rate cut.

Which NFP number matters most?
The headline payroll number, in most months. When inflation is the worry, average hourly earnings can matter more, and the revisions to earlier months can change the whole read.


Which of the three calls do you usually make on NFP night, and has a jobs report ever caught you by surprise? Let me know in the comments.

For more on building a trading routine, start with my free trading guides. The inflation report works in a very similar way, and I cover it in What is the CPI.


About the author. Spencer Li is The 15-Minute Trader and the founder of Synapse Trading. He is a Certified Financial Technician (CFTe) with 15+ years of trading, run from 70+ countries. He holds a B.Acc and B.BM from SMU. Every trade he takes is public, dated, losses left in. He teaches low-risk swing trading in 15 minutes a day, one system for any market.

Education, not financial advice. Synapse Trading is not licensed by MAS to advise on investment products. Trading carries risk of loss, and past performance is not indicative of future results.

by Spencer Li
https://synapsetrading.com/wp-content/uploads/2026/10/nfp-nonfarm-payroll-card.webp 630 1200 Spencer Li https://synapsetrading.com/wp-content/uploads/2026/10/synapse-logo-horizontal-light.png Spencer Li2023-02-03 12:38:132026-09-11 20:05:57What Does NFP Mean? The Non-Farm Payroll Report, Explained for Traders
Spencer Li

What is the FOMC (Federal Open Market Committee) Meeting and How to Trade it?
Markets & Products
Trading the FOMC meeting - market news

What is the FOMC, and Why Does It Move the Market?

Last updated: 1 September 2026 · By Spencer Li, CFTe


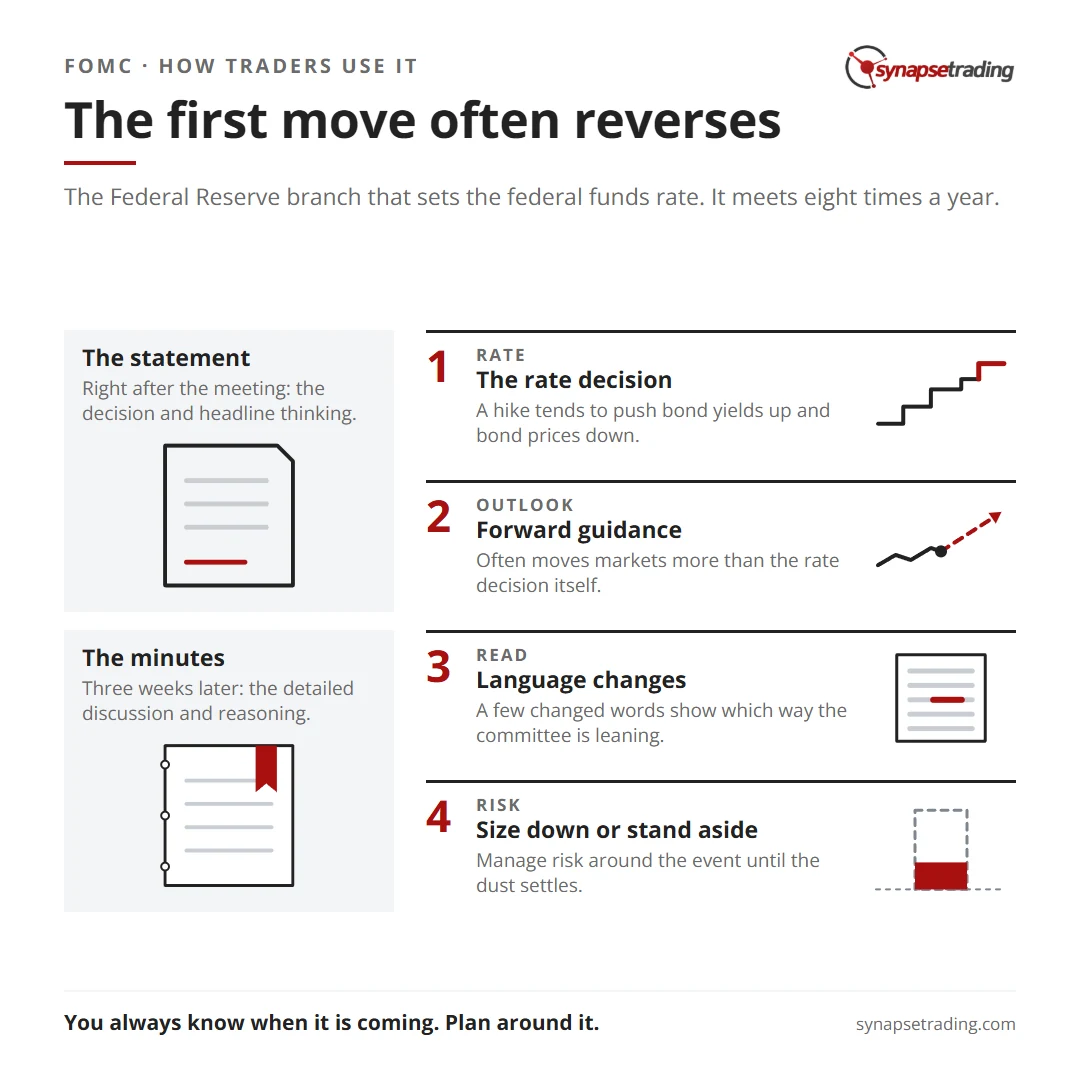
The FOMC (Federal Open Market Committee) is the branch of the U.S. Federal Reserve that sets monetary policy, mainly the federal funds rate (the interest rate at which banks lend to each other overnight). It meets eight times a year, about every six weeks, and after each meeting it releases a statement, economic projections, and forward guidance (its signal about where policy is headed). Markets move on these meetings because interest rates set the price of money: when the Fed raises rates, bond yields tend to rise and bond prices fall, and riskier assets like stocks often come under pressure; when it cuts, the reverse tends to happen. So when traders ask “why does the FOMC matter,” the short answer is that it is one of the few scheduled events that can re-price stocks, bonds, and currencies all at once, on a known date and time. That last part is the useful bit. You always know when it is coming.

Here is what the FOMC is, what it actually decides, and how traders read it without getting run over.

The first move often reverses. Summary card for the post: What is the FOMC (Federal Open Market Committee) Meeting and How to Trade it?.

What is the FOMC and where did it come from?

The FOMC is part of the Federal Reserve System, the central bank of the United States. It took its current form under the Banking Act of 1935. Its job is monetary policy: setting interest rates and using other tools to influence the economy.

It has 12 voting members:

  • The seven members of the Board of Governors (appointed by the U.S. President, confirmed by the Senate, serving 14-year terms).
  • The president of the New York Fed, plus four of the other 11 Reserve Bank presidents, who rotate on one-year terms.

So it is not one person turning a dial. It is a committee, and committees disagree, which is why the dissents in a vote are worth reading.

How does the FOMC operate?

The committee meets eight times a year, roughly every six weeks, on a schedule set well in advance and published on the Federal Reserve’s website. Meetings are held in Washington, D.C., and usually run two days.

The “set well in advance” part is the trader’s gift here. Unlike most market-moving news, an FOMC meeting is on the calendar months ahead. You can plan around it.

What comes out of an FOMC meeting?

After each meeting, the FOMC publishes a statement. It covers current economic conditions, the policy decision, and anything else the committee wants on the record. It is one of the most closely read documents in finance because it shows the committee’s thinking, not just its action.

Here is what the statement and its companion releases actually contain, and why each line matters to a trader:

What is releasedWhat it tells youWhy a trader watches it
Federal funds target rangeThe current overnight interest rate bandDirect driver of bond yields and the cost of money
The vote (and any dissents)How united the committee isDissents hint at where policy could swing next
Economic projections (four meetings a year)Expected path of rates, GDP, unemployment, inflationShapes the outlook for stocks and riskier assets
Assessment and balance of risksThe committee’s read on the economyFrames whether the bias is toward tightening or easing
Forward guidance / language changesSignal about future policyOften moves markets more than the rate decision itself

Two more timing notes worth knowing. The data in the statement is not revised after the meeting, but the committee may tweak the statement language at every meeting, and it publishes fresh economic projections at four of the eight (March, June, September, December). And the minutes, the detailed account of the discussion and reasoning, come out three weeks later. The statement is the headline; the minutes are the footnotes, and the footnotes sometimes move the market a second time.

How do traders and investors actually use FOMC data?

The statement and projections shape the direction of interest rates, and through rates, the value of stocks, bonds, and currencies. Most traders watch a few specific things:

  • The rate decision itself. A hike tends to push bond yields up and bond prices down; a cut tends to do the opposite. Fixed-income positions react first.
  • The economic projections. If the committee expects strong growth, traders may lean toward stocks. If it expects weakness, money often rotates toward the relative stability of bonds.
  • The forward guidance. If the Fed signals rates will stay low for a while, that can support stocks in the short term. If it signals hikes are coming, traders may tilt defensive.
  • The language changes. A few changed words on inflation or the balance of risks can tell you which way the committee is leaning before the numbers do.

Notice the pattern. None of this is about predicting the decision. It is about reading the committee’s bias and positioning for the direction of travel.

News trading on FOMC data

“News trading” means trading the reaction to a scheduled release, in this case the FOMC. A few ways traders approach it:

  • Interest rate decisions. A surprise hike can knock bond prices down as yields jump; a surprise cut can lift them. Traders adjust positions around the gap between what was expected and what was delivered.
  • Economic projections. Stronger-than-expected growth projections can support stocks; weaker ones can weigh on them.
  • Forward guidance. A shift in guidance changes expectations for future policy. A signal of near-term hikes, for instance, can pressure bond prices ahead of the actual move.
  • Statement language changes. A change in tone on inflation or risk can reset expectations for rates, GDP, unemployment, and inflation all at once.

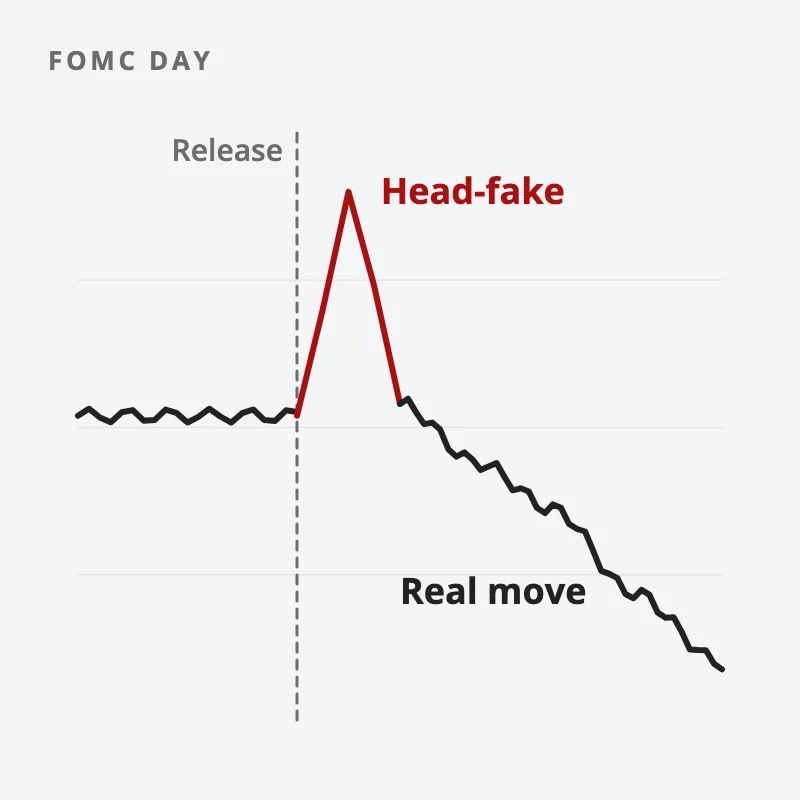
The first move is often a head-fake: price spikes one way on the headline, then reverses once traders finish reading the detail. The spread widens, the volatility is brutal, and the algorithms are faster than you are. For most swing traders, the better edge is not guessing the number. It is knowing a high-volatility event is on the calendar and managing risk around it, sizing down, or simply standing aside until the dust settles.

A quiet price line, the FOMC release marked, a sharp red spike up labelled head-fake, then the real move down
The first move after an FOMC release is often a head-fake that reverses.

Where the human edge comes in

A news calendar will flag the FOMC date for you. A model can even forecast the rate decision. Neither will tell you to ignore the first 15-minute whipsaw, or to skip the trade entirely on a day when the edge is just noise. Should you size down into the event? No AI you can buy in Singapore is allowed to tell you, and a calendar was never built to. The calendar is the easy part. Knowing when not to trade an event this volatile is judgment, the first of the Five Edges that no algorithm trades for you.

FAQ

What does FOMC stand for?
FOMC stands for the Federal Open Market Committee, the branch of the U.S. Federal Reserve that sets monetary policy, mainly the federal funds interest rate.

How often does the FOMC meet?
The FOMC meets eight times a year, about every six weeks, on a schedule published in advance on the Federal Reserve’s website. Each meeting usually runs two days in Washington, D.C.

Why does the stock market move on FOMC days?
Because the FOMC sets interest rates, which set the price of money. A rate change or a shift in forward guidance can re-price bonds, stocks, and currencies at once, so traders react fast to even small surprises.

What is the difference between the FOMC statement and the minutes?
The statement comes out right after the meeting and gives the decision and the committee’s headline thinking. The minutes come out three weeks later and give the detailed discussion and reasoning behind the decision.

Should beginners trade the FOMC announcement?
For most beginners, no. The first move after the release is often a head-fake that reverses once the detail is read, and the volatility is hard to manage. It is usually safer to size down or stand aside around the event than to trade the headline.


Now that you know what the FOMC is and how its decisions ripple through the market, is it something you will add to your trading toolbox? Let me know in the comments.

And if you want the bigger picture on trading scheduled news without getting whipsawed, read the pillar: The Complete Guide to News Trading and Economic Events.

Want a calmer way to trade? Grab the free 15-Minute Swing Trading Starter Kit. It’s the exact routine I use to scan once a day and trade any market in 15 minutes, FOMC week included.


About the author. Spencer Li is The 15-Minute Trader and the founder of Synapse Trading. He is a Certified Financial Technician (CFTe) with 15+ years of trading, run from 70+ countries. He holds a B.Acc and B.BM from SMU. Every trade he takes is public, dated, losses left in. He teaches rules-based swing trading in 15 minutes a day, one system for any market.

Education, not financial advice. Synapse Trading is not licensed by MAS to advise on investment products. Trading carries risk of loss; past performance is not indicative of future results.


Related

The Complete Guide to News Trading and Economic Events · How to Profit from Interest Rate Cuts? · How to Trade the News (Especially When There is Too Much Market News)

by Spencer Li
https://synapsetrading.com/wp-content/uploads/2026/10/fomc-federal-reserve-card.webp 630 1200 Spencer Li https://synapsetrading.com/wp-content/uploads/2026/10/synapse-logo-horizontal-light.png Spencer Li2023-01-28 12:10:382026-10-22 13:21:38What is the FOMC (Federal Open Market Committee) Meeting and How to Trade it?
Spencer Li

How to Profit from Inflation? (With 33 Types of Asset Investments)

Markets & Products
How to profit from inflation - investing

How to Profit from Inflation: The Best Assets to Protect Your Money

Last updated: 9 September 2026 · By Spencer Li, CFTe


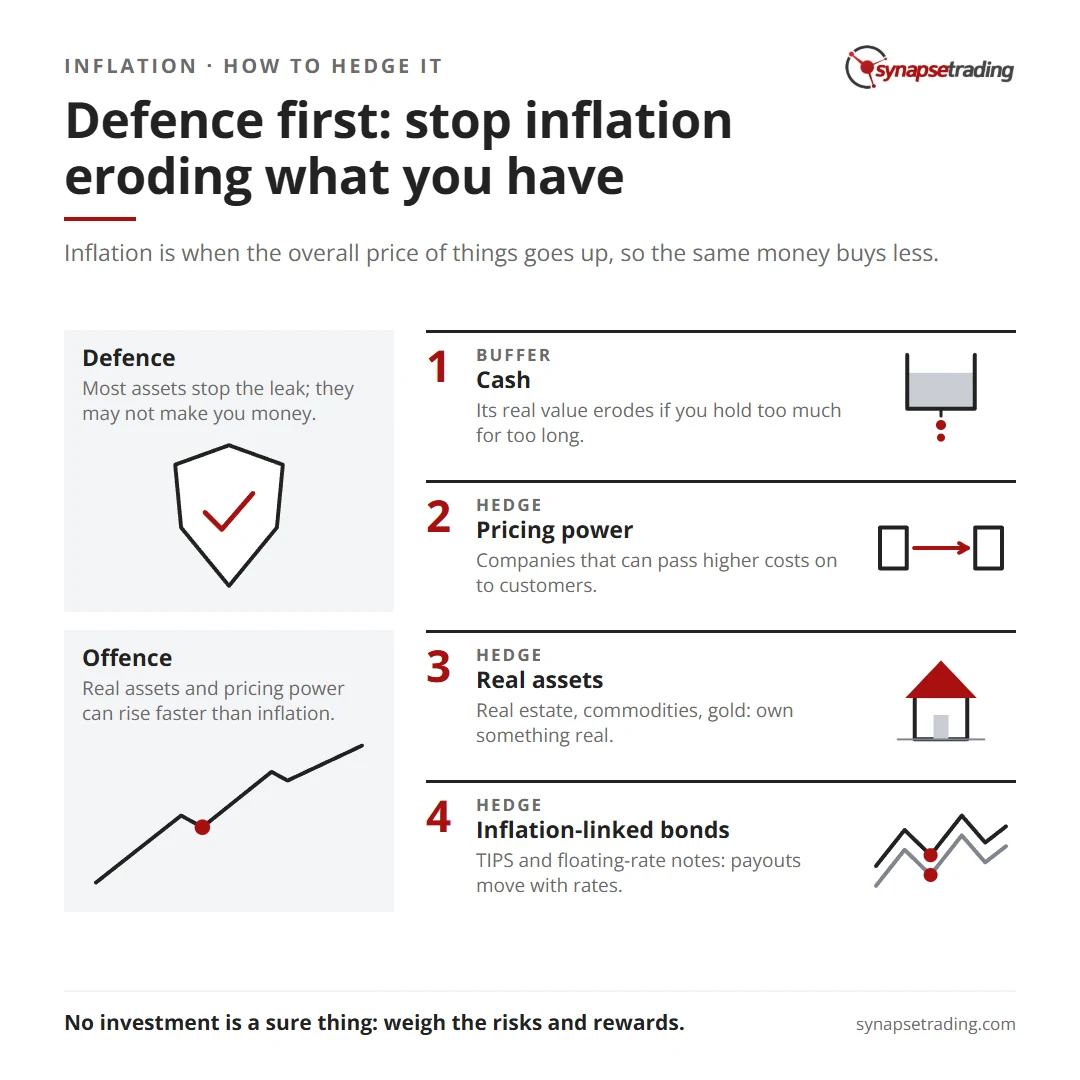
To profit from inflation, you hold assets whose value or income rises alongside prices, instead of holding cash that quietly loses purchasing power. The most reliable inflation hedges fall into three buckets: real assets (real estate, commodities, gold, agricultural land, infrastructure), inflation-linked bonds (TIPS and floating-rate notes, whose payouts move with rates), and equities with pricing power (companies that can pass higher costs on to customers, plus REITs, resource and infrastructure stocks). No single asset is a guaranteed win, and many of these only preserve your purchasing power rather than grow it. The honest goal here is defence first: stop inflation from eroding what you have, then look for the assets that genuinely benefit when prices rise.

Here is what inflation actually is, why it hits some people harder than others, and the full menu of assets people use to hedge it.

Defence first: stop inflation eroding what you have. Summary card for the post: How to Profit from Inflation? (With 33 Types of Asset Investments).

What is inflation?

Inflation is when the overall price of things goes up over time, so the same amount of money buys less. If a basket of groceries that cost you $100 last year costs $107 this year, that is inflation, and your $100 note is now worth less in real terms.

A few things can drive it: more demand chasing the same goods, higher production costs, or simply more money in the system. It can also show up when supply shrinks, for example during a war or a supply shock.

We measure it with the consumer price index (CPI, a tracked basket of things households typically buy). The percentage change in that basket over a period is the inflation rate. The Federal Reserve (the central bank in the US) leans on that rate when setting monetary policy.

Economists usually split inflation into three types:

  • Demand-pull (more demand than supply can meet)
  • Cost-push (rising production costs get passed on)
  • Structural (deeper problems in the economy, like poor resource use or chronic shortages)

Is inflation good or bad for the economy?

It is genuinely both, which is why it is so often misunderstood.

On the upside, mild inflation can nudge growth. If people expect prices to rise, they spend and invest sooner rather than later. It also quietly shrinks the real burden of debt, because the dollars you repay later are worth less than the ones you borrowed.

On the downside, inflation breeds uncertainty. When prices are hard to predict, people hesitate to make long-term plans, and that hesitation is its own drag on the economy. It also lands unevenly. People on low or fixed incomes feel it most, because their income does not stretch to cover the rising cost of living.

To keep prices stable, central banks use monetary policy, which means controlling the supply of money and credit. The Federal Reserve has three main levers: interest rates, reserve requirements, and open market operations.

How to profit from inflation: the asset menu

There is no single “inflation trade.” What works is owning the right mix of assets that either hold their value, pay income that keeps up with rising prices, or directly benefit when the cost of living climbs.

I have grouped the full menu below into four buckets so you can see the logic instead of staring at a flat list. Read the “Why it hedges” column carefully, because the reasoning is what tells you whether an asset fits your situation.

AssetBucketWhy it hedges inflation
CashDefensivePreserves purchasing power short term, but its real value erodes if you hold too much for too long. Reassess the amount you hold.
High-yield savings accountsDefensivePay more interest than a standard savings account. Rarely fully offset inflation, but soften the erosion.
Fixed deposits (term deposits)DefensiveFixed term, fixed rate, low risk. A parking spot.
Stocks (general)Equities with pricing powerVolatile short term, but have historically performed well over the long run. Companies can pass higher costs to customers.
Small cap stocksEquities with pricing powerSmaller companies are more sensitive to the economy and can outperform large caps in inflationary periods.
Emerging market stocksEquities with pricing powerMarkets like China and India may be less affected by rising domestic costs at home.
High dividend-yielding stocksEquities with pricing powerA steady income stream that helps offset the hit to purchasing power.
Infrastructure stocksEquities with pricing powerUtilities and transport firms can pass higher costs through to consumers.
Natural resource stocksEquities with pricing powerOil, gas, and mining firms benefit when commodity prices rise and demand stays steady.
International stocksEquities with pricing powerForeign firms may dodge domestic cost pressure. Mind currency risk and political risk.
Preferred stocksEquities with pricing powerFixed dividend, priority over common stock in a wind-up. Steadier income, less inflation-sensitive than common stock.
Real estateReal assetsProperty values tend to rise over time, and as living costs climb, so can the asset.
Agricultural landReal assetsLand values tend to rise, and food demand stays stable even in hard times.
TimberlandReal assetsSteady demand for wood products, and the land itself can appreciate.
Commodities (gold, oil, agriculture)Real assetsPrices tend to rise directly with the cost of living. A classic hedge.
Infrastructure bondsInflation-linked / incomeFund roads, bridges, airports. Steady income, and the underlying assets can appreciate.
Floating rate bonds / notes (FRNs)Inflation-linked / incomePay a variable rate tied to a benchmark, so income rises as market rates rise.
Treasury Inflation-Protected Securities (TIPS)Inflation-linked / incomeUS government bonds engineered to return above the inflation rate.
Inflation-linked bonds (linkers)Inflation-linked / incomeReturns are tied directly to the inflation rate. Issued by governments or corporates.
Corporate bondsInflation-linked / incomeSteady income, but check the issuer’s creditworthiness. Value can still be dented by inflation.
Municipal bondsInflation-linked / incomeOften tax-free income from state and local government projects. Check the issuer’s credit.
Index funds (general)FundsTrack an index like the S&P 500. Diversified, good for long-term holders.
Real asset fundsFundsHold physical assets (property, commodities, infrastructure) that can appreciate with inflation.
Balanced fundsFundsA mix of stocks, bonds, and other assets for diversification and steadier results.
Infrastructure fundsFundsHold utilities, transport, and infrastructure bonds. Steady income plus appreciation potential.
Commodity fundsFundsHold a basket of commodities, so they ride rising commodity prices.
Real estate investment trusts (REITs)FundsOwn and operate property. Steady income, and real estate tends to appreciate.
Floating rate loan fundsFundsHold variable-rate loans, so income rises with rates and inflation bites less.
Municipal bond fundsFundsA basket of munis. Often tax-free income, less inflation-sensitive than other bonds.
Collectible assets (art, antiques, rare coins)AlternativesCan appreciate, especially in inflationary times. Hard to value and price; expect big swings.
Alternative investments (hedge funds, private equity)AlternativesPotential for higher returns and lower inflation sensitivity. Illiquid and riskier; not for everyone.
Cryptocurrencies (e.g. Bitcoin)AlternativesSome see them as a hedge because they are not tied to fiat currency. Highly volatile.
Master limited partnerships (MLPs)AlternativesOwn energy assets like pipelines. Steady income, and energy demand stays stable.

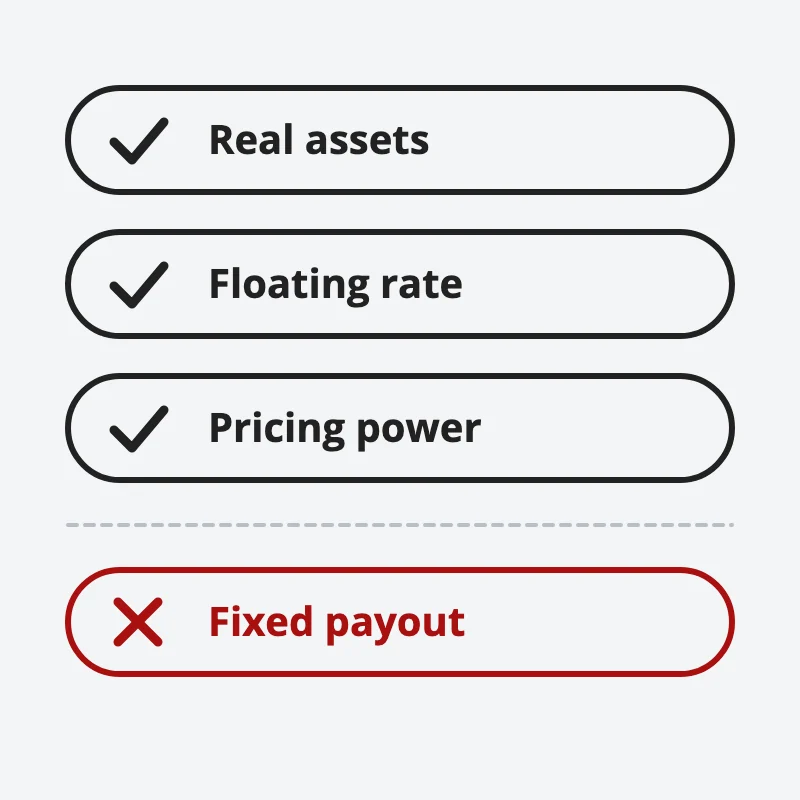
The pattern under all of this is simple. The assets that hedge inflation best are the ones that either own something real, lend at a rate that floats up with inflation, or sell something whose price they can raise. The assets that lose to inflation are the ones with a fixed payout and nothing real behind them.

Three ticked rows, real assets, floating rate and pricing power, above one red crossed-out row, fixed payout
Assets that own something real, float with rates or can raise prices hedge inflation best.

Defence versus offence: an honest distinction

Here is the part most “profit from inflation” articles skip.

Most of the assets above defend your purchasing power. They stop the leak. They do not necessarily make you money. Holding cash in a high-yield account or buying TIPS is defence: you are trying not to fall behind.

A smaller set can actually outperform. Real assets and equities with genuine pricing power can rise faster than inflation, not just keep pace with it. That is offence.

Do note that, the two are different jobs, and you size them differently. Mixing them up is how people convince themselves a savings account is an “inflation strategy” when it is really just a slower way to lose.

Where the human edge comes in

A screener will hand you a list of “inflation hedges” in a second. That part is now free. What it will not do is tell you how much cash you can stand to hold without bleeding real value, which of these assets actually fits your time horizon and risk tolerance, or when an inflation theme is already priced in and the crowd is late. The list is the easy part. Judgment, sizing each position for the volatility it carries, and knowing which hedge the moment actually calls for is the work. That is the first of the Five Edges that no tool can trade for you.

Concluding thoughts

Inflation cuts both ways for an economy, and it quietly cuts into your personal finances whether you act or not.

Once you understand the menu, holding the right cash buffer, owning real assets and quality equities, or adding inflation-linked bonds, you can take real steps to protect the purchasing power of your wealth. Just keep two things in mind. Some of these strategies only minimise the damage rather than turn a profit. And no investment is a sure thing, so weigh the risks and rewards before you commit a single dollar.

FAQ

What is the best investment during inflation?
There is no single best one. Over the long run, real assets (real estate, commodities, gold) and equities with pricing power tend to perform well, while inflation-linked bonds like TIPS are built specifically to return above the inflation rate. The right mix depends on your time horizon and risk tolerance.

Is cash a good hedge against inflation?
Cash preserves purchasing power in the very short term and gives you flexibility, but its real value erodes the longer you hold it during inflation. A high-yield savings account softens the erosion, but rarely offsets inflation fully. Treat cash as a buffer.

How do TIPS protect against inflation?
Treasury Inflation-Protected Securities (TIPS) are US government bonds engineered to deliver a return above the rate of inflation, so their payout rises as inflation rises. That makes them one of the few assets designed from the ground up to hold real value when prices climb.

Why does real estate hedge against inflation?
Property values and rents tend to rise over time, often in line with the rising cost of living, so the asset and its income can keep pace with inflation. REITs (real estate investment trusts) give you similar exposure without owning a building directly.

Can stocks beat inflation?
Historically, stocks have outperformed inflation over the long run, because companies can pass higher costs on to customers through higher prices. They are volatile in the short term, so they suit long-term holders rather than anyone who needs the money soon.


Now that you have the full menu, which of these assets are you planning to add to your portfolio? And is there an inflation hedge I have missed? Let me know in the comments.

If you want the bigger picture on building a portfolio that holds up across different market conditions, read the pillar: The Definitive Guide to Investing and Building Wealth.

Want a simple system instead of a 30-item shopping list? Grab the free 15-Minute Swing Trading Starter Kit. It is the exact routine I use to scan once a day and trade any market in 15 minutes.


About the author. Spencer Li is The 15-Minute Trader and the founder of Synapse Trading. He is a Certified Financial Technician (CFTe) with 15+ years of trading, run from 70+ countries. He holds a B.Acc and B.BM from SMU. Every trade he takes is public, dated, losses left in. He teaches low-risk swing trading in 15 minutes a day, one system for any market.

Education, not financial advice. Synapse Trading is not licensed by MAS to advise on investment products. Trading carries risk of loss; past performance is not indicative of future results.


Related

The DIY Guide to Building Your Investment Portfolio · The 5 Major Types of REITs to Have in Your Portfolio · How to Split Stocks and Bonds · Should You Own Gold? What It Does in a Portfolio, and How to Hold It From Singapore

by Spencer Li
https://synapsetrading.com/wp-content/uploads/2026/10/invest-profit-inflation-card.webp 630 1200 Spencer Li https://synapsetrading.com/wp-content/uploads/2026/10/synapse-logo-horizontal-light.png Spencer Li2022-12-20 22:46:542026-10-22 13:23:59How to Profit from Inflation? (With 33 Types of Asset Investments)
Spencer Li

The Rise and Fall of FTX & FTT Token (Will Investors Get Their Money Back?)

Markets & Products
FTX's rise and fall - crypto

What Happened to FTX and Sam Bankman-Fried? The Collapse, the FTT Token, and the Lesson

Last updated: 2026-06-14 · By Spencer Li, CFTe


FTX was a major cryptocurrency exchange founded by Sam Bankman-Fried that collapsed in November 2022, going from a $32 billion valuation to bankruptcy in a matter of days. The trigger was its own token, FTT (the native token FTX issued and used on its platform). When rival exchange Binance announced it would sell its entire FTT position, worth around $529 million, the token’s price collapsed, customers rushed to withdraw, and the exchange could not cover them. FTX filed for Chapter 11 bankruptcy protection. Bankman-Fried was arrested in December 2022 on fraud charges, and the company was accused of undisclosed leverage, price manipulation, and self-dealing between FTX and its affiliated trading firm, Alameda Research. Investors and customers lost billions, and the replacement CEO, John Ray, said not all of it would be recovered.

The short version: a business propped up by a token it printed itself is only as solid as confidence in that token. When confidence broke, everything tied to it broke at once. Here is the full story, and the one lesson that actually protects you.

What is FTX?

FTX was a cryptocurrency exchange. A cryptocurrency exchange is a platform that lets people buy, sell, or trade cryptocurrencies for other assets, such as traditional fiat money (government-issued currency like USD) or other digital coins. Exchanges are the main place people get in and out of crypto.

They are not all the same. Some only let you trade specific pairs of coins; others offer a wide range. Some are built for professional traders, others for beginners. FTX positioned itself toward the serious end of that spectrum, and for a while it was treated as one of the more credible names in the industry.

What is the FTT token?

FTT was the native token of FTX, a cryptocurrency that FTX itself issued. It was used on the platform for various purposes, like paying fees and unlocking special features for traders.

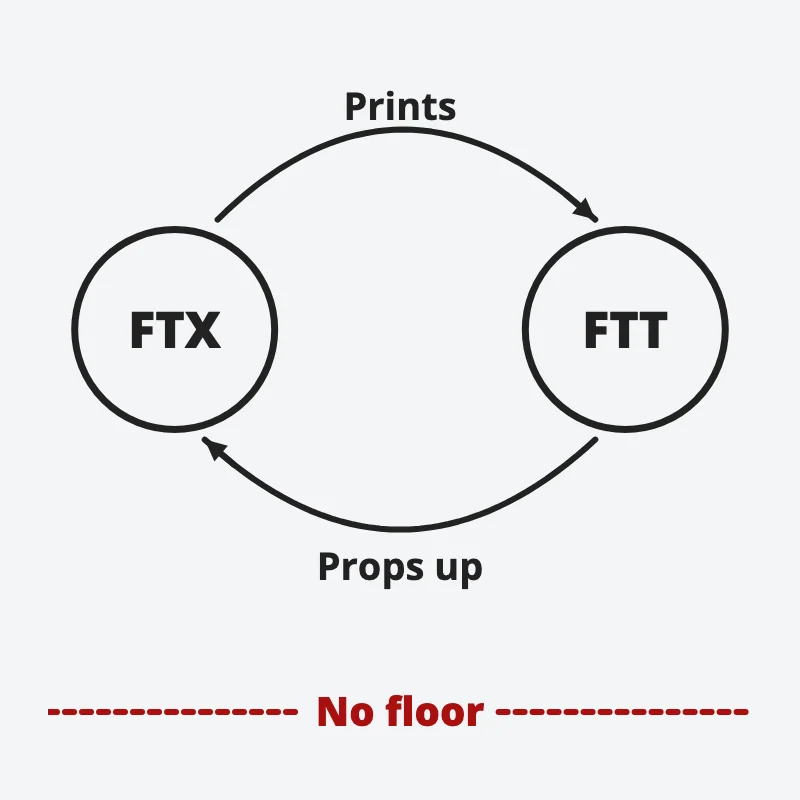
Here is the part that matters. The value of FTT was closely tied to FTX’s own performance and reputation. So when FTX wobbled, FTT did not act like an independent asset that might hold its ground. It fell with the company. That circularity, a company leaning on a token whose price depends on the company, is the structural crack the whole story runs through.

FTX and its FTT token drawn as a closed loop, FTX prints FTT and FTT props up FTX, with a broken red line below marked no floor
A company propped up by a token it printed itself has no outside floor.

How did FTX grow so quickly?

FTX scaled fast on aggressive marketing. It ran a Super Bowl ad campaign and bought the naming rights to the home arena of the Miami Heat basketball team. It got involved in political lobbying, made donations to various causes, and worked to position itself as a supporter of the broader crypto industry.

Timing helped too. The crypto market had been volatile and had seen significant growth in the years before, and that rising tide lifted FTX along with it. Big spend plus a hot market made the company look unstoppable. It was not.

The fall of FTX: how it unfolded

In November 2022, FTX filed for Chapter 11 bankruptcy protection after its valuation plummeted from $32 billion to nearly nothing in just a few days. That also wiped out most of Bankman-Fried’s net worth, previously estimated at around $16 billion. By his own account in November 2022, he had roughly $100,000 left in his bank account.

The collapse came after questions surfaced about how the company actually operated. FTX was accused of questionable practices: undisclosed leverage (borrowing the platform was not transparent about), manipulation of certain crypto prices, and allegations of insider trading and self-dealing between FTX and its affiliated trading firm, Alameda Research. As those concerns spread, confidence drained, and a business built on confidence cannot survive that.

Here is the sequence, stripped to the bones:

StageWhat happenedWhy it mattered
The setupFTX issued FTT and let its value ride on the company’s own reputationThe exchange and its token were not independent; they were one bet
The sparkBinance announced it would sell its entire FTT position, around $529 millionA large, public sell signal from a rival cracked confidence in the token
The runFTT’s price plummeted; customers rushed to withdraw fundsThe exchange could not cover withdrawals tied to a now-falling token
The collapseFTX filed for Chapter 11 bankruptcy; valuation fell from $32B to near zero in daysBillions in customer and investor money were frozen
The falloutBankman-Fried arrested (Dec 2022) on fraud charges; reputation destroyedOne of the largest financial frauds described in US history, per prosecutors

Binance’s CEO, Changpeng Zhao, framed the decision to liquidate the FTT holdings as protecting the interests of its users and the wider crypto community. Whatever the motive, the public announcement was the spark. Once a large, credible holder signals it is dumping a token, everyone else does the math on what that means for the issuer.

Why did FTX collapse? The shady practices

The legal trouble was not the only problem. As the situation developed, it became clear FTX had engaged in practices that should have been disclosed and were not.

  • Undisclosed leverage. Borrowing and risk-taking the platform did not make transparent to users.
  • Price manipulation. Allegations that FTX influenced the prices of certain cryptocurrencies.
  • Insider trading and self-dealing. Concerns about how money moved between FTX and Alameda Research, the affiliated trading firm.

A class-action lawsuit filed in Florida in November 2022 accused Bankman-Fried of building a fraudulent crypto scheme aimed at unsophisticated investors across the US. It named celebrities including Steph Curry, Shaquille O’Neal, Shohei Ohtani, Naomi Osaka, Larry David, and Kevin O’Leary as alleged accomplices for their roles promoting the platform. Bankman-Fried retained white-collar crime lawyer Mark S. Cohen, while Caroline Ellison, who led Alameda Research, retained the firm Wilmer Cutler Pickering Hale and Dorr.

Will FTX investors get their money back?

This is the question every affected customer asked, and the honest answer at the time was: probably not all of it, with a decent chance of getting at least something.

In December 2022, FTX and its affiliated debtors filed a motion with the bankruptcy court seeking approval to sell four businesses, including Embed, LedgerX, FTX Japan, and FTX Europe. The point of those sales was to raise funds to pay down FTX’s debts and return something to creditors. Bankruptcy recovery works like that: assets get sold, claims get ranked, and creditors are paid back in pieces over time.

Bankman-Fried had been seen as a leading figure in crypto. The allegations and the collapse destroyed that standing, his own and the company’s.

What is the lesson? Do your due diligence

So what do you actually take from all of this?

It is a cautionary tale about the risks of crypto, and a plain reminder to do your due diligence before putting money into any investment. Two specific red flags this saga hands you for free:

  1. A company leaning on a token it printed itself is a circular bet. If the asset backing the business is the same business’s coin, there is no independent floor under it.
  2. Where your money sits is its own risk, separate from what you are trading. Counterparty risk (the risk the platform holding your money fails) is real, and it does not show up on a price chart.

Personally, this is where I keep coming back to a point that has nothing to do with picking the right coin. A scanner can flag a price pattern. A research feed can pull a company’s headlines. Neither one will tell you to stand aside because the whole structure smells circular, or to keep your size small when the story sounds too good. That judgment, the decision to walk away from a thing everyone else is piling into, is the first of the Five Edges, and it is the part no tool trades for you. FTX did not fail because traders could not read a chart. It failed because trust was placed where it should not have been.

This is the kind of thing the Ultimate Guide to Blockchain and Cryptocurrencies is built to walk you through: how the plumbing actually works, so you can spot the cracks before they spread.

FAQ

What happened to FTX?
FTX was a cryptocurrency exchange that collapsed in November 2022, falling from a $32 billion valuation to bankruptcy in days. It filed for Chapter 11 bankruptcy protection after a crisis of confidence in its own FTT token triggered a wave of customer withdrawals it could not cover.

Why did FTX collapse?
The trigger was rival exchange Binance announcing it would sell its entire FTT position, around $529 million, which crashed the token’s price. Underneath that, FTX was accused of undisclosed leverage, price manipulation, and self-dealing between FTX and its affiliated trading firm, Alameda Research.

What is the FTT token?
FTT was the native token issued by FTX and used on its platform for fees and special features. Its value was closely tied to FTX’s own performance and reputation, so it fell along with the company rather than holding independent value.

Who is Sam Bankman-Fried?
Sam Bankman-Fried was the founder of FTX. Once estimated to be worth around $16 billion, he was arrested in December 2022 on fraud charges, in a case prosecutors described as one of the largest financial frauds in US history.

Will FTX customers get their money back?
Recovering the full amount was always unlikely, though there was a reasonable chance of getting at least part of it back. FTX sought to sell businesses including Embed, LedgerX, FTX Japan, and FTX Europe to raise funds and return money to creditors through the bankruptcy process.


The FTX story is dramatic, but the takeaway is boring on purpose: confidence is not collateral, and convenience is not safety. Were you one of the people who had funds trapped in FTX, or did you steer clear? Let me know in the comments.

If you want the bigger picture on how exchanges, tokens, and crypto plumbing actually work, read the pillar: The Ultimate Guide to Blockchain and Cryptocurrencies.

Want a calmer way to trade through chaos like this? Grab the free 15-Minute Swing Trading Starter Kit. It’s the exact routine I use to scan once a day and trade any market in 15 minutes, without betting the house on any single coin or exchange.


About the author. Spencer Li is The 15-Minute Trader and the founder of Synapse Trading. He is a Certified Financial Technician (CFTe) with 15+ years of trading, run from 70+ countries. He holds a B.Acc and B.BM from SMU. Every trade he takes is public, dated, losses left in. He teaches low-risk swing trading in 15 minutes a day, one system for any market.

Education, not financial advice. Synapse Trading is not licensed by MAS to advise on investment products. Trading carries risk of loss; past performance is not indicative of future results.


Related

Ultimate Guide to Blockchain and Cryptocurrencies · What is Bitcoin and how does it work · How to Spot a Pump-and-Dump Before You Buy · Risk management for traders

by Spencer Li
https://synapsetrading.com/wp-content/uploads/2026/10/ftx-ftt-sbf-card.webp 630 1200 Spencer Li https://synapsetrading.com/wp-content/uploads/2026/10/synapse-logo-horizontal-light.png Spencer Li2022-12-18 14:37:032026-10-22 13:24:02The Rise and Fall of FTX & FTT Token (Will Investors Get Their Money Back?)
Page 10 of 14«‹89101112›»

Free checklist

The 15-Minute Swing Trader’s Checklist

The daily and weekly routine I use to find, manage and review trades in about 15 minutes a day, trading since 2007.

Get the free checklist

Topics

  • Trading foundations
  • Technical analysis
  • Strategies and systems
  • Risk and money
  • Trading psychology
  • Markets and products

Synapse Trading

Swing trading for busy professionals, in 15 minutes a day.

Start free

Learn

  • Start here
  • Free trading guides
  • Blog
  • Tools and resources

Programs

  • Trading Mastery Program
  • Daily trading signals
  • Student results
  • Public trade log

Company

  • About
  • Contact me
  • Partnerships
  • Disclaimer
  • Privacy policy
  • Terms & Conditions

Synapse Trading Pte Ltd
Registration No. 201316168H
WhatsApp +65-8897-1204
info@synapsetrading.com

Contact Us

Synapse Trading Pte Ltd
Registration No. 201316168H

Whatsapp: +65-8897-1204
Telegram: @iamrecneps
Email: info@synapsetrading.com

Links

Disclaimer
Privacy policy
Terms & Conditions
Contact us
Partnerships

© 2012-2026 Synapse Trading | All rights reserved. Educational content only, not personalised financial advice. Trading carries risk, including loss of capital. Past performance is not indicative of future results. Synapse Trading is not licensed or regulated by MAS.
  • Link to Facebook
  • Link to X
  • Link to Instagram
  • Link to Youtube
  • Link to LinkedIn
  • Link to Mail
Scroll to top Scroll to top Scroll to top