• Link to Facebook
  • Link to X
  • Link to Instagram
  • Link to Youtube
  • Link to LinkedIn
  • Link to Mail
Free PDF: The 15-Minute Swing Trader's Checklist, the daily routine of a trader since 2007
Synapse Trading
  • Mentoring
    • Trading Mastery Program
    • All mentoring options
  • Signals
    • Daily trading signals
    • Signals trade log
  • Results
    • Student results and testimonials
    • Public trade log, losses left in
  • Free guides
    • Start here
    • Trading foundations
    • Technical analysis
    • Strategies and systems
    • Risk and money
    • Trading psychology
    • Markets and products
    • Free trading guides
    • Tools and resources
    • Blog
  • About
    • My background
    • My trading journey
    • Media and interviews
    • Travel log
  • Contact
    • Contact me
    • Partnerships
  • Start free
  • Click to open the search input field Click to open the search input field Search
  • Menu Menu

Forex, stocks, crypto, options and commodities – what you trade, as opposed to how.

Spencer Li

Explaining the Debt Ceiling: What Happens in A Default?

Markets & Products
The debt ceiling, explained - economics and news

What Is the Debt Ceiling, and What Happens If the US Defaults?

Last updated: 19 August 2026 · By Spencer Li, CFTe


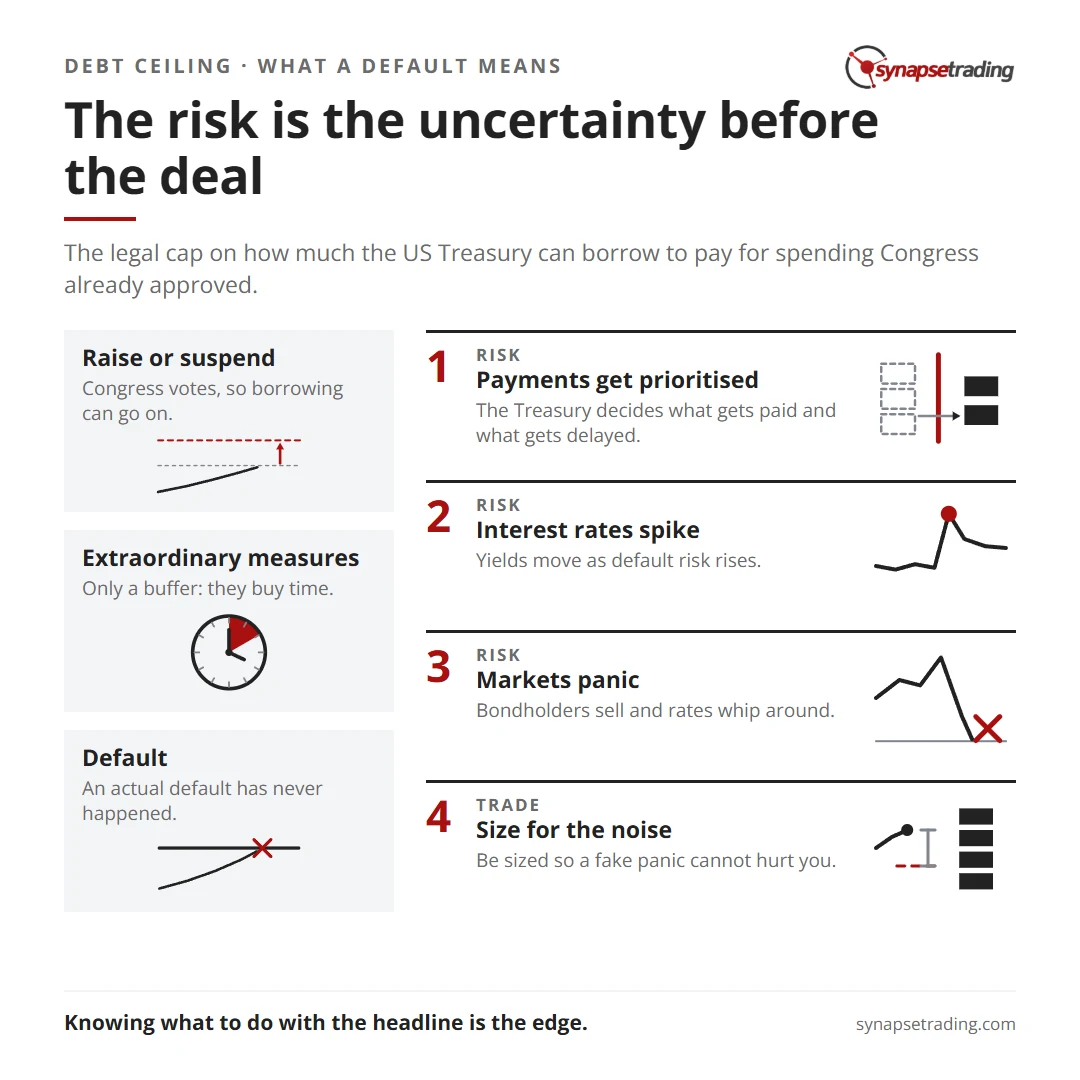
The debt ceiling is the legal cap on how much the US Treasury can borrow to pay for spending Congress has already approved. When borrowing nears the cap, Congress has to vote to raise or suspend it, or the government runs out of room to pay its bills. If the ceiling is breached and the US defaults, the Treasury would have to prioritise some payments over others, interest rates would likely spike, the bond market and stock market could panic, and credit agencies could downgrade US debt. The good news: an actual default has never happened, because Congress has raised the ceiling more than 70 times since 1960, usually after some political brinkmanship and a last-minute deal. The risk that gets priced into markets is rarely the default itself. It is the uncertainty in the weeks before the deal.

Here is what the debt ceiling is, why the US debt got so big, what a real default would do, and whether the ceiling should exist at all.
The risk is the uncertainty before the deal. Summary card for the post: Explaining the Debt Ceiling: What Happens in A Default?.

What is the debt ceiling and why does it matter?

The debt ceiling is the maximum amount the US Treasury is legally allowed to borrow to meet obligations the government has already committed to.

The mechanics are simpler than the headlines suggest. The government raises money through taxes and other revenue. When spending runs ahead of revenue, you get a gap. That gap is bridged by borrowing, which adds to the national debt. But the borrowing is not unlimited. Congress sets a legislative cap on it, and that cap is the debt ceiling.

When the debt nears the cap, Congress has to step in and either suspend or raise it, which gives the Treasury permission to keep borrowing. That back-and-forth between spending, borrowing, and a legislative vote is the whole debt ceiling drama in one sentence.
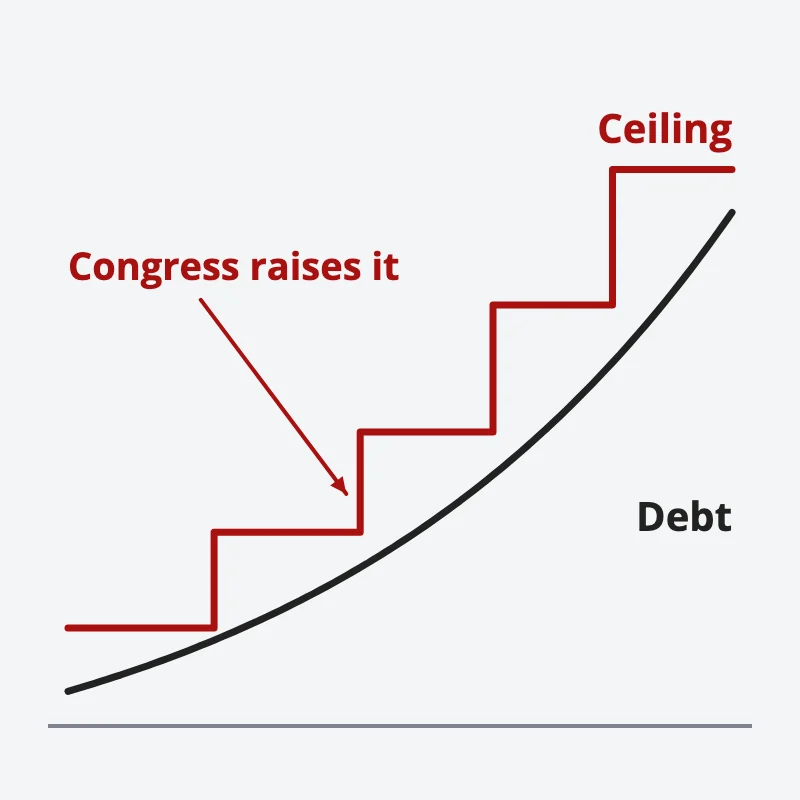
A rising debt line runs up beneath a red stepped ceiling; each time the debt gets close, Congress raises the ceiling
When the debt nears the cap, Congress raises or suspends it so borrowing can go on.

Do note that, the ceiling does not authorise new spending. It authorises borrowing to pay for spending Congress already voted for. That distinction is the source of most of the confusion in the news cycle.

Where did the debt ceiling come from?

The debt ceiling is not a recent invention. It dates back to 1917, when Congress created it to set an upper limit on how much federal debt the US government could pile up.

It has not stayed put. As the economy grew and the government’s financial commitments grew with it, the ceiling has been raised many times. Congress has lifted the bar more than seventy times since 1960, and each hike signalled a fresh need for borrowed funds. By the early 2020s, both the national debt and the ceiling sat above $31 trillion.

Why is the US debt so high?

The US national debt is the product of several forces stacking on top of each other over decades: tax cuts that lowered revenue, sustained overspending, expensive crises, and large mandatory programmes. Between 2009 and 2023, the national debt nearly tripled.

Here are the main drivers:

  • Tax cuts that reduced revenue. Major tax cuts, from the Reagan-era cuts in the 1980s through the cuts under the Trump administration, lowered federal revenue. They were aimed at stimulating growth, but the side effect was less money coming in.
  • Government overspending. Long military campaigns, such as the wars in Iraq and Afghanistan, carried huge immediate costs plus long-term obligations like veterans’ healthcare and disability benefits.
  • Crisis spending. The 2008 recession forced enormous spending to rescue failing institutions. The Covid-19 pandemic forced massive stimulus to support businesses and individuals. Both strained the budget further.
  • Mandatory programmes. Social Security, Medicare, and Medicaid are a large, growing share of the budget, driven up by an ageing population and rising healthcare costs.
  • Defence. The US spends more on its military than any other country, which is a substantial slice of total expenditure.

No single cause explains the debt. It is the sum of all of these, compounding over time.

What happens if the debt ceiling is breached?

If the US fails to raise the ceiling in time and defaults on its obligations, the consequences are severe and spread well beyond Washington. Here is what would likely unfold.

The government has to prioritise payments. With the law mandating that programmes like Social Security and Medicaid continue, the Treasury would be forced to decide what gets paid and what gets delayed, potentially suspending programmes people rely on.

Interest rates spike. The bond market reacts before any formal default, with yields on short-term debt moving as default risk rises. That can feed through to higher mortgage rates and borrowing costs for households and businesses. Even a brief default could leave the government paying more to borrow afterwards.

Markets panic. A breach could trigger turmoil reminiscent of the 2008 stock market crash. As bondholders sell and rates whip around, the volatility can destabilise markets, made worse by the fact that the US has never actually defaulted, so nobody knows exactly how it plays out.

A run on money market funds. As seen in 2008, a default could spark a run on money market accounts. If a large fund halts redemptions, the panic deepens and may need government intervention to stabilise.

Political instability. Around election seasons, the debt ceiling becomes a partisan weapon, with each side accusing the other of mismanagement. Everyone agrees a default is bad, but how far each side will bend in negotiations is never certain until the deal lands.

Lasting damage to US standing. A default could prompt credit agencies to permanently downgrade US debt, weakening America’s global standing and even challenging the US dollar’s status as the world’s reserve currency. The probability of an actual default has historically been estimated as low, but the potential damage is what makes it a serious concern, especially heading into a slowdown.

What options does the government have to avoid default?

When the Treasury hits the ceiling, it can deploy a set of “extraordinary measures” (accounting manoeuvres that free up borrowing room) to put off an immediate default. These include suspending the issuance of certain types of debt and redeeming existing investments inside civil service retirement funds.

These measures are only a buffer. They buy time for Congress to negotiate, like a financial fire drill. But they are limited in size and duration. They can only defer the default. If Congress does not raise or suspend the ceiling in time, the buffer runs out.

Do other countries have a debt ceiling?

Mostly, no. The US version is unusual. A few countries have a statutory borrowing limit, but they set it so high it is never a constraint, or they removed it entirely after it caused too much trouble. Here is how three approaches compare.

CountryHas a debt limit?How it worksCauses political crises?
United StatesYesHard cap that must be raised or suspended by Congress when debt approaches itYes, recurring brinkmanship and near-defaults
DenmarkYes (in name)Statutory limit set deliberately far above actual borrowing needs (around 950 billion DKK, roughly $150 billion USD as of 2021)No, the cap is so high it is never binding
AustraliaNo (abolished 2013)Had a US-style limit, scrapped it after political crises in the early 2010s; now governed by normal budget processesNo, removing it ended the standoffs

Denmark keeps a limit but sets it so far above its needs that it never becomes a flashpoint. Australia had a US-style cap, hit the same brinkmanship the US sees, decided the limit was causing more harm than good, and abolished it in 2013. Since then, Australia’s borrowing has been governed by ordinary budget processes and parliamentary checks rather than a fixed cap. The lesson from both: a debt limit can work as a theoretical safeguard, but only if it is designed so it does not become a source of political contention.

Should the debt ceiling be revoked?

There are two honest sides to this.

In favour of keeping it: the ceiling gives Congress a recurring checkpoint to evaluate the nation’s financial health. Supporters argue this process, contentious as it is, encourages fiscal responsibility and stops unchecked borrowing.

Against keeping it: critics say the ceiling is a relic that fits poorly with a modern economy. They argue it causes needless economic disruption and has become a tool for political brinkmanship rather than genuine fiscal discipline. The recurring crises expose the US to self-inflicted financial wounds and dent its credibility.

A growing number of economists favour reform, ranging from linking the ceiling directly to spending levels (so a separate vote is not needed) to abolishing it outright, which would bring the US in line with most developed countries.

Personally, I do not have a vote in Congress, and as a trader I do not need one. My job is not to be right about whether the ceiling should exist. It is to be positioned for either outcome and to not get shaken out by the noise in between.

How should a trader handle a debt ceiling standoff?

Treat it as a known, scheduled source of volatility. There is no need to predict the headline.

Every debt ceiling fight follows roughly the same arc: a deadline looms, the rhetoric escalates, markets get jumpy, and then a deal arrives close to the wire. The default itself has never happened. That does not mean it never will, but it does mean the tradeable event is almost always the uncertainty before the deal.

A news feed will scream “DEFAULT” at you on a loop. It will not tell you whether the move is already priced in, how to size a position when volatility is elevated, or whether to simply stand aside until the setup is clean. That judgment is the first of the Five Edges a machine cannot trade for you. The headline is the easy part. Knowing what to do with it is the edge.

So when the next standoff hits, the question is not “will they default?” The question is “what does my system tell me to do right now, and am I sized so a fake panic cannot hurt me?”

FAQ

What is the debt ceiling in simple terms?
It is the legal limit on how much the US Treasury can borrow to pay for spending Congress has already approved. When borrowing nears the limit, Congress must vote to raise or suspend it, or the Treasury runs out of room to pay the government’s bills.

Has the US ever actually defaulted on its debt?
No. The US has never defaulted because of the debt ceiling. Congress has raised or suspended the ceiling more than seventy times since 1960, usually after political brinkmanship and a last-minute deal.

What would happen to the stock market if the US defaulted?
A default could trigger a market panic similar to 2008: bondholders selling, interest rates spiking, possible runs on money market funds, and a credit downgrade of US debt. Even the threat of default tends to raise volatility before any deal is reached.

Does the debt ceiling control how much the government spends?
No. The debt ceiling does not authorise new spending. It only authorises borrowing to pay for spending Congress has already voted for. That is why a fight over the ceiling is about paying bills already run up.

Do other countries have a debt ceiling like the US?
Most do not. Denmark keeps a statutory limit but sets it so high it is never binding, and Australia abolished its limit in 2013 after it caused repeated political crises. The US hard-cap model that forces recurring votes is unusual among developed nations.


So, two questions worth sitting with. First, given the damage a real default would do, should the debt ceiling mechanism be reconsidered? Second, if it is kept, how do we stop the political fights around it from harming the economy it is meant to protect? Let me know in the comments.

If you want the bigger picture on how macro headlines move markets, read the pillar: Macro and Market Cycles: A Trader’s Guide.

Want a calmer way to trade the noise? Grab the free 15-Minute Swing Trading Starter Kit. It is the exact routine I use to scan once a day and trade any market in 15 minutes, headlines or no headlines.


About the author. Spencer Li is The 15-Minute Trader and the founder of Synapse Trading. He is a Certified Financial Technician (CFTe) with 15+ years of trading, run from 70+ countries. He holds a B.Acc and B.BM from SMU. Every trade he takes is public, dated, losses left in. He teaches low-risk swing trading in 15 minutes a day, one system for any market.

Education, not financial advice. Synapse Trading is not licensed by MAS to advise on investment products. Trading carries risk of loss; past performance is not indicative of future results.


Related

How to Ride the Big Business & Market Cycles · How to Profit from Interest Rate Cuts? · How to Profit from a Stock Market Crash (Panic Sell or Buy the Dip?)
by Spencer Li
https://synapsetrading.com/wp-content/uploads/2026/10/debt-ceiling-default-card.webp 630 1200 Spencer Li https://synapsetrading.com/wp-content/uploads/2026/10/synapse-logo-horizontal-light.png Spencer Li2023-05-21 22:33:432026-10-22 13:19:54Explaining the Debt Ceiling: What Happens in A Default?
Spencer Li

Pepecoin: The Meme Coin Craze That’s Making Waves in the Crypto World

Markets & Products
The Pepecoin meme craze - crypto

What Are Meme Coins, and Is Pepecoin (PEPE) a Good Investment?

Last updated: 26 September 2026 · By Spencer Li, CFTe


A meme coin is a cryptocurrency built around an internet joke or mascot, with little or no underlying utility, that trades almost entirely on community hype and social-media momentum. Pepecoin (PEPE), based on the Pepe the Frog meme, is one of the best-known examples. Is it a good investment? Honestly, no, not in the sense most people mean by “investment.” Pepecoin has no cash flow, no product, and no intrinsic value to anchor a price. It rose more than 1,500% in 14 days in 2023, then dropped over 42% from its all-time high almost immediately. That is a trading vehicle. You can trade a meme coin if you size it as pure speculation and accept you may lose all of it. You should not park money you need in one. The rest of this post explains what meme coins actually are, what drove Pepecoin’s rise and crash, and how to think about the risk before you touch one.

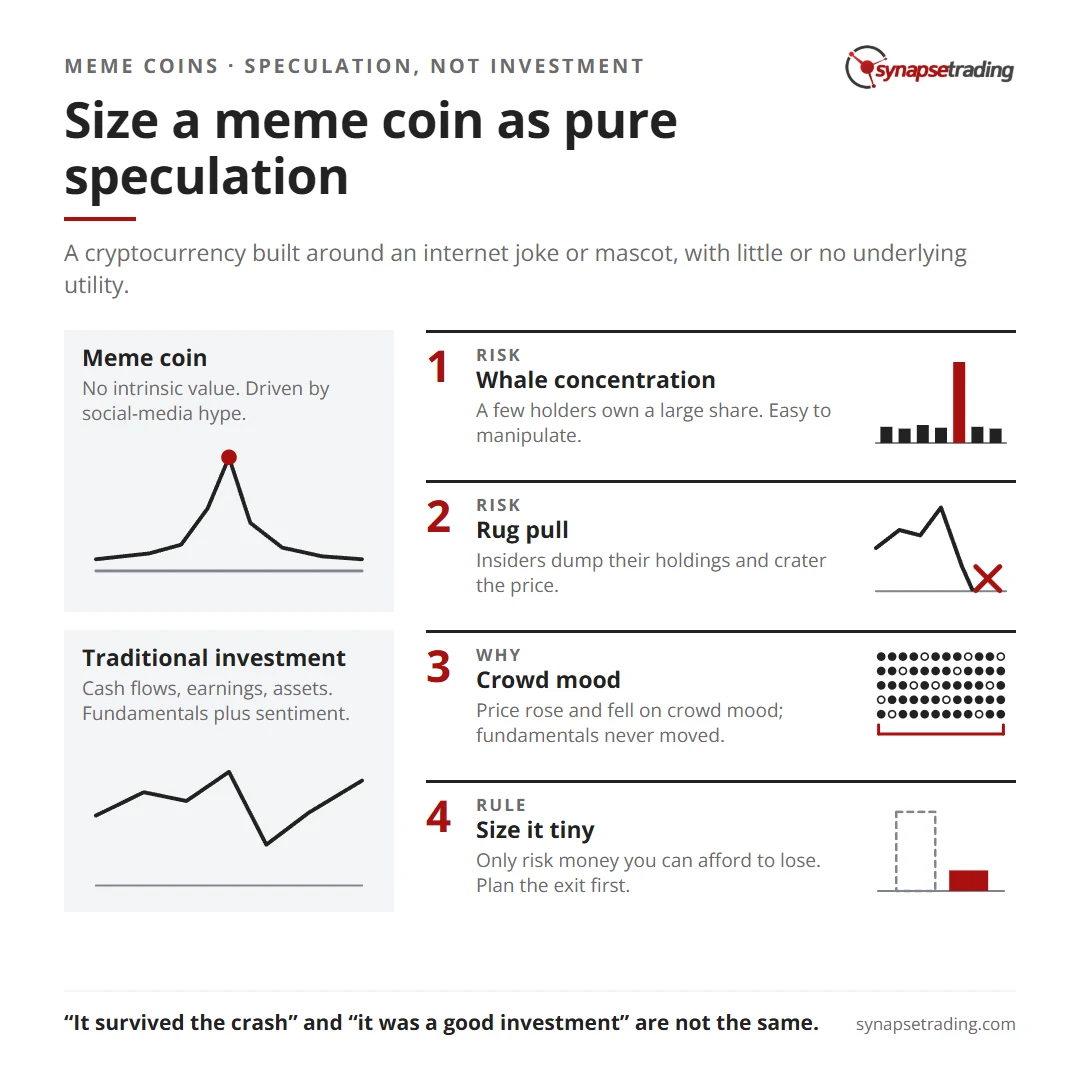
Size a meme coin as pure speculation. Summary card for the post: Pepecoin: The Meme Coin Craze That's Making Waves in the Crypto World.

What are meme coins?

Meme coins are cryptocurrencies built around comical, animated imagery and enthusiastic online trading communities. They are high-risk by design. Most have little or no intrinsic value (no product, no revenue, no real-world use), so they function as trading instruments.

You will have seen the regulars: Dogecoin, Shiba Inu, Baby Doge, Dogelon Mars, and now Pepecoin. Major cryptocurrencies like Bitcoin and Ethereum are not meme coins; they have actual networks and use cases behind them.

The thing that defines meme coins is volatility. Only a handful, such as Dogecoin and Shiba Inu, even carry the daily trading volume (over $1 million) to move size in and out without slippage wrecking you. The rest are thin, and thin markets are where you get hurt.

What is Pepecoin (PEPE)?

Pepecoin is a meme-based cryptocurrency that draws on the Pepe the Frog meme. Note this clearly: it uses the character’s likeness, but there is no official connection to Matt Furie, the cartoonist who created Pepe the Frog. That alone tells you something about the foundations.

A few facts on the coin itself:

  • Maximum supply: 420,690,000,000,000 coins (yes, that many; the number itself is a meme).
  • Rank: it climbed into the top 50 largest cryptocurrencies, and at its peak sat at #45 by overall valuation.
  • Market cap: crossed $1 billion.
  • The catalyst: trading volume jumped 425% on the Friday it was listed in Binance’s “innovation zone.”

Here is my concern, and it is the one that matters most. Whales (a few holders sitting on enormous quantities of the coin) own a large share of the supply. Concentrated ownership like that makes the market easy to manipulate and leaves it open to a rug pull (where insiders dump their holdings and crater the price for everyone else). When a handful of wallets can decide your exit price, you are not really in control of the trade.

Why did Pepecoin’s price suddenly jump?

A few things lined up at once.

First, the so-called “crypto winter” was ending, and risk appetite was coming back. When the broad market thaws, meme coins are usually the first thing to run, because they are the purest expression of speculative mood.

Second, the Binance “innovation zone” listing gave it a layer of mainstream validation. A listing on a major exchange is not an endorsement of value, but it makes a coin far easier to buy, and easier-to-buy plus rising-mood is rocket fuel for a meme coin.

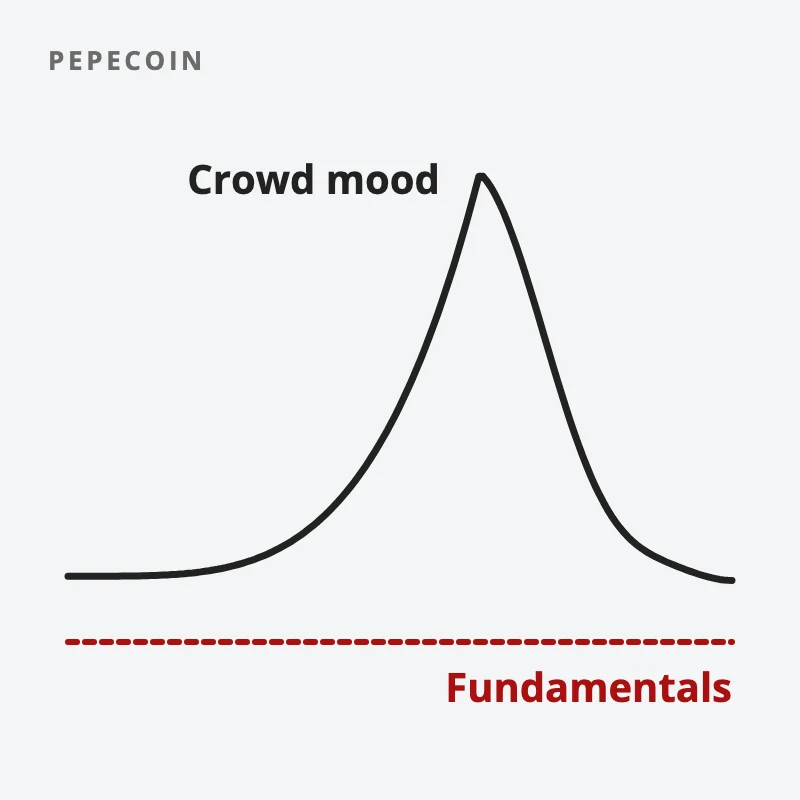
Put together, Pepecoin’s value rose roughly 500% in two weeks, and the headline figure was a 1,503.9% surge within just 14 days. That is the power of social media and community-driven enthusiasm, and it is also exactly why these moves are so dangerous. Nothing changed about the coin’s fundamentals (there were none). Only the crowd’s mood changed.

A price line spikes up on crowd mood and crashes back, while a red dashed line for fundamentals stays flat at the bottom
Pepecoin’s price rose and fell on crowd mood; its fundamentals never moved.

The crash: a $600,000 lesson

The flip side showed up fast. Shortly after hitting its all-time high on May 6th, Pepecoin dropped more than 42%.

One crypto whale had bought 962.3 billion Pepe tokens just days before the plunge, and was left sitting on an unrealized loss of roughly $600,000. That is the part to sit with. Even a “smart money” buyer with size got caught, because in a market this driven by momentum, the timing of the crowd matters more than the quality of the asset.

To be fair, even after the drop, Pepecoin held a market cap above $1 billion and stayed the 45th largest cryptocurrency. So meme coins can keep real market presence despite the risk. But “it survived the crash” and “it was a good investment” are not the same statement.

Meme coin vs. a real asset: the honest comparison

Here is how a meme coin like Pepecoin stacks up against the kind of asset you would actually invest in.

Meme coin (e.g. Pepecoin)Established crypto (e.g. Bitcoin/Ethereum)Traditional investment (e.g. an index fund)
Intrinsic valueNoneNetwork and use caseCash flows, earnings, assets
Main price driverSocial-media hype, community moodAdoption, network use, macroFundamentals plus sentiment
VolatilityExtreme (1,500% up, 42% down in days)HighModerate
Ownership concentrationOften heavy whale concentrationMore distributedRegulated, disclosed
Rug-pull / manipulation riskHighLowVery low
Honest labelSpeculationInvestment with high riskInvestment

The point of the table is not that meme coins are evil. It is that they belong in the “speculation” column, and you should treat the money you put in like money you are prepared to lose entirely.

Is Pepecoin a good investment?

With any investment, especially in crypto, there are no guarantees. Pepecoin has seen impressive growth, but meme coins have historically struggled to hold their value. Some people characterize them, fairly, as pump-and-dump schemes. Add the concentrated ownership and the insider-trading risk, and the case for “investment” gets thin.

So my honest answer: meme coins like Pepecoin and Dogecoin are an extremely risky speculation, not an investment, because they lack fundamentals and carry extreme price volatility. If you choose to trade one anyway, do it with money you can afford to lose, size it tiny, and have an exit plan before you enter.

Where the human edge comes in

A screener will tell you Pepecoin is up 1,500% in a second. It will not tell you to stay out. Spotting the runner is the easy, now-free part. The judgment to recognise that a thing with no fundamentals, heavy whale concentration, and a parabolic chart is a trade to size tiny or skip entirely, and the discipline to set your exit before you are emotionally in the position, is the part no tool supplies for you. That judgment is the first of the Five Edges an algorithm cannot trade for you.

FAQ

What is a meme coin?
A meme coin is a cryptocurrency built around an internet joke, mascot, or community (like a frog or a dog) rather than a product or technology. It usually has little or no intrinsic value and trades mostly on social-media hype. Examples include Dogecoin, Shiba Inu, and Pepecoin.

What is Pepecoin (PEPE)?
Pepecoin is a meme-based cryptocurrency inspired by the Pepe the Frog meme, with a maximum supply of 420,690,000,000,000 coins. It has no official connection to Pepe’s original creator, Matt Furie, and at its peak ranked among the top 50 cryptocurrencies with a market cap over $1 billion.

Is Pepecoin a good investment?
Pepecoin has no fundamentals, cash flow, or intrinsic value, so it is better described as a speculation than an investment. It rose over 1,500% in 14 days and then fell more than 42% from its all-time high soon after, which shows the extreme volatility involved. Only risk money you can afford to lose entirely.

Why did Pepecoin’s price rise so fast?
Three things combined: the end of the 2023 “crypto winter” revived risk appetite, a listing in Binance’s “innovation zone” gave it mainstream access and validation, and social-media community hype did the rest. None of it reflected any change in fundamentals.

What is a rug pull, and is Pepecoin at risk of one?
A rug pull is when insiders or large holders suddenly dump their coins and collapse the price for everyone else. Pepecoin carries elevated risk here because a small number of whales hold large quantities of the supply, which makes the market easier to manipulate.


So, before you buy a meme coin: are you prepared for the volatility and the risk, and given the concentrated ownership, how will you make sure you are deciding with your head and not the crowd’s hype? Let me know in the comments.

If you want the bigger picture on how this asset class actually works, read the pillar: The Ultimate Guide to Blockchain and Cryptocurrencies.

Want a system that keeps you out of trades like this? Grab the free 15-Minute Swing Trading Starter Kit. It is the exact routine I use to scan once a day and trade any market in 15 minutes, with the risk rules that stop a hype trade from blowing up an account.


About the author. Spencer Li is The 15-Minute Trader and the founder of Synapse Trading. He is a Certified Financial Technician (CFTe) with 15+ years of trading, run from 70+ countries. He holds a B.Acc and B.BM from SMU. Every trade he takes is public, dated, losses left in. He teaches low-risk swing trading in 15 minutes a day, one system for any market.

Education, not financial advice. Synapse Trading is not licensed by MAS to advise on investment products. Trading carries risk of loss; past performance is not indicative of future results.


Related

The Ultimate Guide to Blockchain and Cryptocurrencies · What is Bitcoin and how does it work? · How to spot a pump-and-dump scheme · Risk management for traders

by Spencer Li
https://synapsetrading.com/wp-content/uploads/2026/10/pepecoin-meme-coin-card.webp 630 1200 Spencer Li https://synapsetrading.com/wp-content/uploads/2026/10/synapse-logo-horizontal-light.png Spencer Li2023-05-09 05:28:382026-10-22 13:19:57Pepecoin: The Meme Coin Craze That’s Making Waves in the Crypto World
Spencer Li

What is the Best Investment During a Recession?

Markets & Products
Investing through a recession - macro

Best Investments During a Recession: Where to Put Your Money in a Downturn

Last updated: 8 October 2026 · By Spencer Li, CFTe


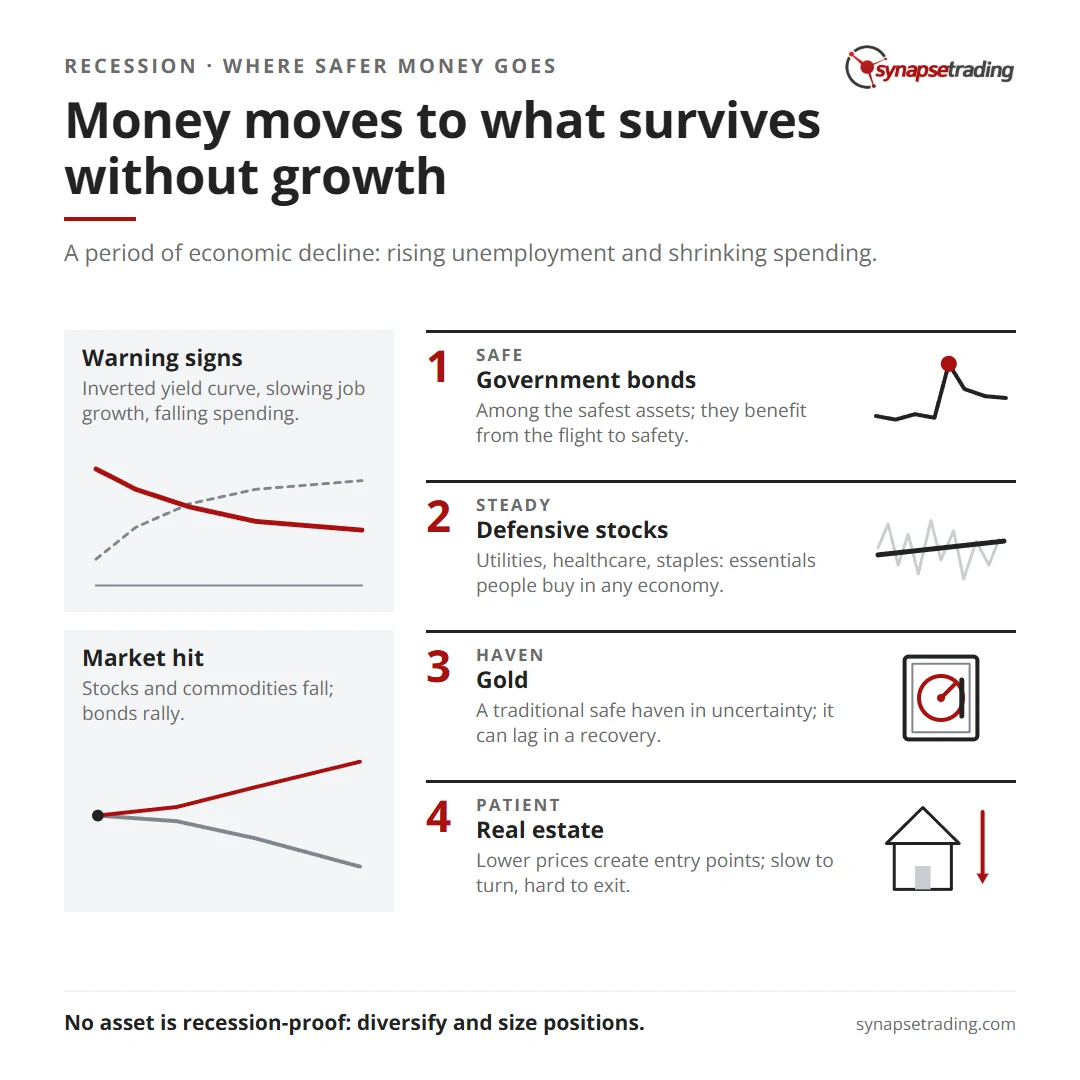
The best investments during a recession are defensive, cash-flow-stable assets that hold up when growth stalls: high-quality government bonds (like US Treasuries), defensive stocks (utilities, healthcare, consumer staples), gold, and well-timed real estate. History backs this. In the 2008 to 2009 Great Recession, the US Treasury bond market gained 12.7% as investors fled to safety, gold rose more than 25%, and the healthcare sector held up far better than the broad market while the S&P 500 fell roughly 56% from its October 2007 peak. The common thread is simple: in a downturn, money moves from things that need growth to things that survive without it. No asset is truly recession-proof, so the real job is diversification and position sizing.

Here is what a recession actually is, the early warning signs to watch, how it hits each market, and where the safer money tends to go.

Money moves to what survives without growth. Summary card for the post: What is the Best Investment During a Recession?.

What is a recession?

A recession is a period of economic decline marked by falling Gross Domestic Product (GDP, the total value of goods and services an economy produces), rising unemployment, and shrinking consumer and business spending.

It is usually triggered by a mix of factors. A drop in demand, a supply shock, a financial crisis, or an external event can all start the slide, and they often compound each other.

To fight a recession, governments and central banks lean on monetary and fiscal policy: cutting interest rates, raising government spending, and offering tax incentives to restart growth. The damage can outlast the downturn itself, showing up as higher poverty, tighter credit, and lower consumer confidence.

What causes a recession?

Recessions rarely have one clean cause. These are the usual suspects, often several at once:

  • Tight monetary policy. When the central bank raises interest rates to control inflation, borrowing and spending fall, which can tip the economy into contraction.
  • Bursting asset bubbles. A speculative run-up in real estate or stocks that suddenly reverses can drag the whole economy down with it.
  • External shocks. Natural disasters, wars, or pandemics can disrupt activity fast.
  • Fiscal policy. Sharp changes in government spending or taxation can cool the economy.
  • Supply shocks. A sudden jump in a key input, like a major oil price spike, can choke growth.
  • Banking crises. When banks stop lending, investment and activity seize up.
  • Trade imbalances. Large imbalances or protectionist policies can disrupt international trade enough to cause a downturn.

What are the early warning signs of a recession?

No single indicator predicts a recession with certainty. But a handful of signals tend to flash before the downturn arrives, and they matter more when several show up together.

Warning signWhat it means
Inverted yield curveShort-term bonds yield more than long-term bonds, a sign investors have lost confidence in the long-term outlook
High debt levelsHouseholds, companies, or governments carrying excessive debt that gets hard to sustain
Slowing job growthHiring stalls or unemployment starts rising, an early tell that the economy is weakening
Falling consumer spendingPeople cut back, signalling lower confidence and softening demand
Stock market declineA sharp, sustained drop suggests investors are worried about what is coming

The inverted yield curve (when short-term interest rates rise above long-term rates) is the one most analysts watch, because it has preceded most modern US recessions. None of these is a guarantee. Read them together, as a cluster.

How does a recession affect the financial markets?

A recession ripples through every major market, and not always in the same direction. Here is how it has played out historically.

  • Stocks decline. Markets fall as investors turn pessimistic. In the 2008 recession, the S&P 500 dropped around 56% from its peak in October 2007 to its low in March 2009.
  • Bonds rally. As stocks fall, money moves into safer bonds, pushing bond prices up and yields down. The 10-year US Treasury yield fell from about 5% in mid-2007 to about 2.1% in late December 2008.
  • Currencies can devalue. If investors lose faith in a country, its currency can drop. During the late-1990s Asian financial crisis, the Thai baht lost around 50% against the US dollar and the Indonesian rupiah lost around 80%.
  • Commodities fall. Demand for oil, copper, and similar inputs drops with activity. In 2008, oil fell from around $145 a barrel in July to roughly $30 by December.

Not every recession hits the markets the same way, and there is wide variation in how individual sectors and asset classes hold up. That variation is exactly why the asset class you choose matters.

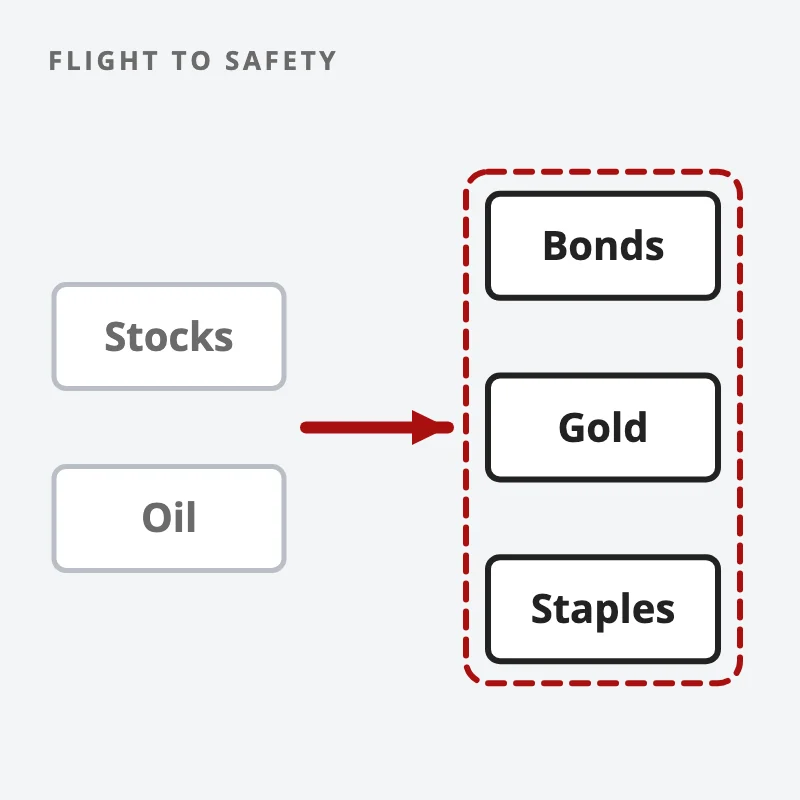
A red arrow carries money from stocks and oil on the left to bonds, gold and consumer staples on the right
In a downturn, money moves from things that need growth to things that survive without it.

What is the best asset class to invest in during a recession?

During a downturn, investors look for safe havens that can ride out the storm. Four asset classes have historically done that job, each with a real example from the 2008 to 2009 Great Recession.

Asset classWhy it holds up2008 to 2009 example
Government bonds (e.g. US Treasuries)Considered among the safest assets; benefit from the flight to safetyUS Treasury bond market gained 12.7% as investors flocked to safety
Defensive stocks (utilities, healthcare, staples)Sell essentials people buy in any economy, so earnings are steadierS&P 500 healthcare sector fell less than the index
GoldTraditional safe haven that tends to do well in uncertaintyGold rose more than 25% as investors sought protection
Real estateLow rates and lower prices create entry points for long-term holdersHousing prices fell sharply, but had rebounded and were rising again by 2012

A few honest caveats. Bonds and gold are defensive, with limits; they can lag badly once the recovery starts. Real estate is the slowest to turn and the hardest to exit in a panic, so it rewards patience and a long horizon. And no asset here is fully recession-proof. Every one of them carries risk.

That is why the answer is not a single ticker. It is a diversified mix, sized so that no one position can sink you, matched to your own risk tolerance and time horizon.

Where the human edge comes in

A screener can rank every defensive sector for you in a second, and a model can plot the yield curve and tell you it just inverted. That part is basically free now. How much of your portfolio to actually move, and when to stop buying the dip because your sizing is already stretched? No AI you can buy in Singapore is allowed to tell you that, and the ones that try were not built for you. Nor will the machine tell you whether you have the temperament to hold a falling asset through the worst of it. The data is the easy part. Knowing how much to commit and when to sit on your hands is the judgment, and that is the first of the Five Edges no algorithm trades for you.

How to prepare your portfolio before a recession

You do not have to predict the exact top to be ready. A few steps go a long way:

  • Diversify across asset classes, so a hit to one market does not take out the whole portfolio.
  • Hold some cash and high-quality bonds, which give you both stability and dry powder to deploy when prices are low.
  • Know your risk tolerance and time horizon before the stress hits. Decisions made in a panic are almost always worse.

If you want a repeatable way to read market conditions and size positions instead of reacting to headlines, that is exactly what a tested system is for.

FAQ

What is the safest investment during a recession?
High-quality government bonds, such as US Treasuries, are generally considered among the safest. In the 2008 to 2009 Great Recession, the US Treasury bond market gained 12.7% as investors moved money into safety.

Does gold go up in a recession?
Often, yes. Gold is a traditional safe haven and tends to do well during economic uncertainty. During the 2008 to 2009 recession, gold prices rose more than 25%. It is not guaranteed, though, and gold can lag once a recovery begins.

Is real estate a good investment during a recession?
It can be for long-term investors, because interest rates tend to be low and property prices may fall, creating entry points. In 2008 to 2009, housing prices dropped sharply but had rebounded by 2012. Real estate is slow to turn and hard to exit quickly, so it rewards patience.

What are the early warning signs of a recession?
The most-watched signals are an inverted yield curve, high debt levels, slowing job growth, falling consumer spending, and a declining stock market. No single one is decisive; they are most reliable when several appear together.

Is any investment fully recession-proof?
No. Every asset class carries some risk, and recessions do not all behave the same way. The practical defence is diversification and position sizing matched to your own risk tolerance.


Now that you know where the safer money tends to go, the harder question is how much of your portfolio to actually move, and when. How are you preparing for the next downturn? Let me know in the comments.

And if you want the bigger picture of how to build a portfolio that survives any market cycle, read the pillar: The Beginner’s Guide to Investing and Trading.

Want a system instead of a reaction? Grab the free 15-Minute Swing Trading Starter Kit. It’s the exact routine I use to read market conditions and trade any market in 15 minutes a day.


About the author. Spencer Li is The 15-Minute Trader and the founder of Synapse Trading. He is a Certified Financial Technician (CFTe) with 15+ years of trading, run from 70+ countries. He holds a B.Acc and B.BM from SMU. Every trade he takes is public, dated, losses left in. He teaches rules-based swing trading in 15 minutes a day, one system for any market.

Education, not financial advice. Synapse Trading is not licensed by MAS to advise on investment products. Trading carries risk of loss; past performance is not indicative of future results.


Related

The Beginner’s Guide to Trading & Technical Analysis · How to read the yield curve

by Spencer Li
https://synapsetrading.com/wp-content/uploads/2026/10/best-investment-recession-card.webp 630 1200 Spencer Li https://synapsetrading.com/wp-content/uploads/2026/10/synapse-logo-horizontal-light.png Spencer Li2023-02-20 13:15:382026-10-22 13:20:00What is the Best Investment During a Recession?
Spencer Li

The Different Types of Oil Products & What Affects their Prices?

Markets & Products
What moves oil prices? - commodities

Oil Products and Oil Prices: What Moves the Oil Market (and How to Trade It)

Last updated: 29 August 2026 · By Spencer Li, CFTe


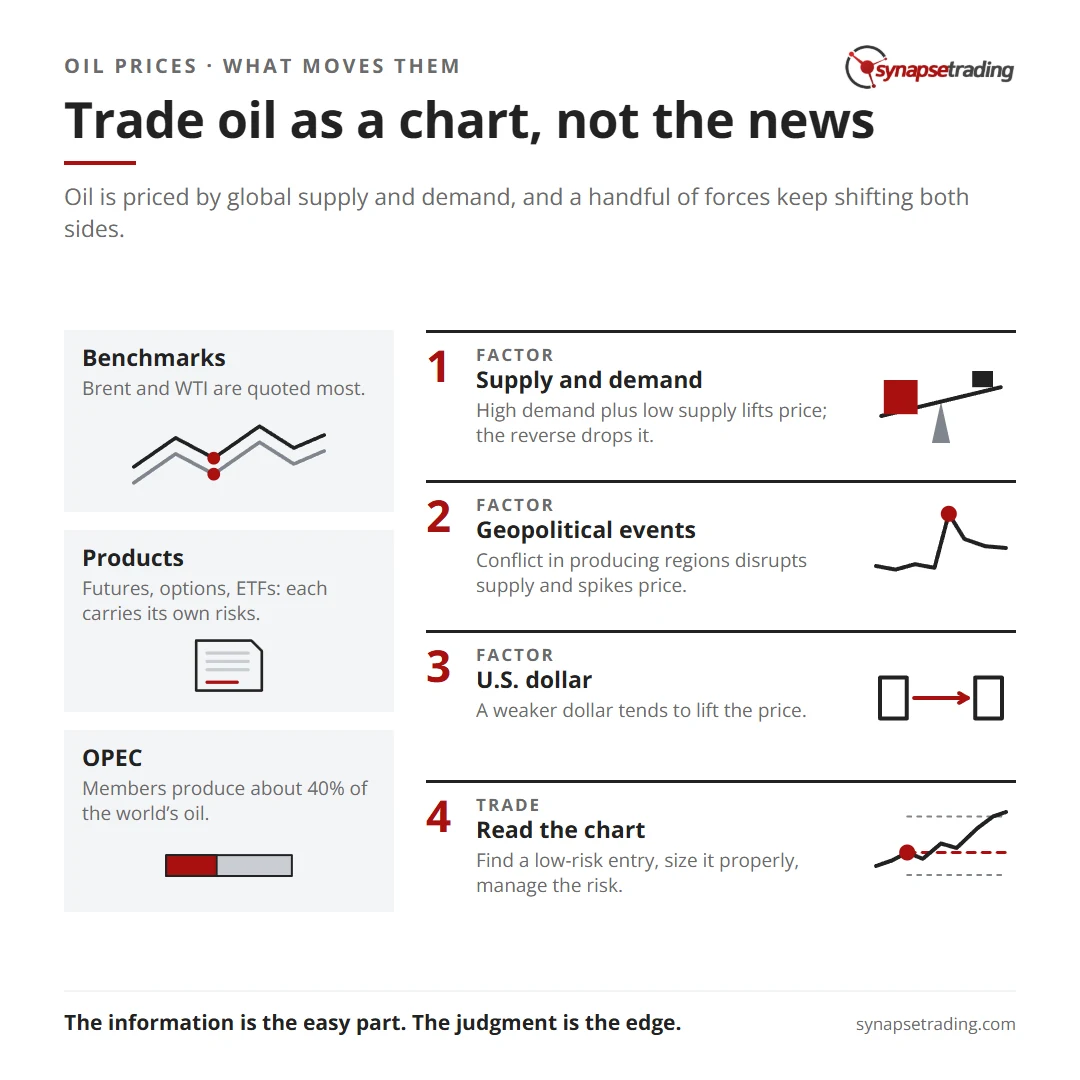
Oil prices move because oil is priced by global supply and demand, and a short list of forces keeps shifting both sides of that balance: OPEC production decisions, geopolitical events, economic growth, government policies, inventory levels, natural disasters, and the U.S. dollar. When supply falls or demand rises, prices go up. When supply floods or demand collapses, prices fall. “Oil” is not one thing either. It trades as several regional benchmarks (Brent, WTI, Dubai, Urals, Oman, Tapis), and you can get exposure through futures, options, ETFs, OTC derivatives, and oil-linked bonds and notes. OPEC matters because its members together pump roughly 40% of the world’s oil, so when they cut or raise output, the whole market feels it.

Here is the full picture: the oil products you can trade, the financial products that give you exposure, what OPEC actually does, and the seven factors that move price, each with a real historical example.

Trade oil as a chart, not the news. Summary card for the post: The Different Types of Oil Products & What Affects their Prices?.

What are the different oil products?

There are several types of crude that trade as benchmarks in global markets. Each is priced a little differently because of its density (light or heavy), its sulfur content (sweet means low-sulfur, sour means high-sulfur), and where it is produced. Lighter, sweeter crude is cheaper to refine, so it usually commands a higher price.

BenchmarkTypeSourceUsed to price
Brent CrudeLight, sweetNorth SeaAbout two-thirds of the world’s internationally traded crude
WTI (West Texas Intermediate)Light, sweetUnited StatesCrude oil in North America
Dubai CrudeLight, sourUnited Arab EmiratesCrude oil in the Asian market
Urals CrudeHeavy, sourRussiaCrude oil in Europe
Oman CrudeMedium, sourOmanCrude oil in the Middle East
Tapis CrudeLight, sweetMalaysiaCrude oil in the Asia-Pacific region

These are some of the most widely traded grades, and their prices are often used as a benchmark to price other types of crude. Brent and WTI are the two you will see quoted most. The specific characteristics of each grade (density, sulfur content, refining cost) drive its price and demand.

What are the financial products for trading oil?

You do not need a tanker to get exposure to oil. Several financial products track or hedge the oil price:

  • Futures contracts. Agreements to buy or sell a set quantity of oil at a fixed price on a future date. These trade on exchanges such as the New York Mercantile Exchange (NYMEX) and the Intercontinental Exchange (ICE).
  • Options contracts. Similar to futures, but the buyer gets the right, not the obligation, to buy or sell oil at a set price on a future date.
  • Exchange-Traded Funds (ETFs). Investment products that track the oil price by holding a basket of related securities, giving you exposure without owning the physical commodity.
  • Over-the-Counter (OTC) derivatives. Customized contracts negotiated privately between two parties, off any exchange. Big oil companies and financial institutions use these to hedge against price moves.
  • Commodity-linked bonds. Bonds issued by oil companies or governments, linked to the oil price, giving exposure through a debt instrument.
  • Oil-linked exchange-traded notes (ETNs). Debt securities that track the oil price.

These let individuals and institutions get exposure to oil, or hedge against price swings. Do note that, each product carries its own terms, conditions, and risks. Understand them before you put money in. A futures contract and an ETF can both be “long oil” and behave very differently over the same month.

What is OPEC and what role does it play?

OPEC stands for the Organization of the Petroleum Exporting Countries. It is a group of oil-producing nations, including Saudi Arabia, Venezuela, Iran, and Iraq, founded in 1960 and headquartered in Vienna, Austria. (Membership has shifted over the years, so check the current count when you read this.)

OPEC’s job is to coordinate and unify its members’ oil production and sales policies. The aim is to regulate supply, keep prices stable, and ensure a fair return for oil-producing countries.

Here is why it matters to price. OPEC members together produce about 40% of the world’s oil, so by coordinating their output they can move global supply, and therefore price. If OPEC agrees to cut production, supply drops and prices tend to rise. If it agrees to raise production, supply grows and prices tend to fall. Those decisions ripple through the global economy and the budgets of every country that imports oil, which is exactly why OPEC’s meetings draw so much attention, and so much criticism.

Which factors affect oil prices?

Several forces move the oil price. Most of them work by changing one side of the supply-and-demand balance. Here they are, each paired with a real historical example of it in action.

FactorHow it moves priceReal example
Supply and demandHigh demand plus low supply lifts price; the reverse drops itThe 2008 global financial crisis crushed demand while supply stayed high, and the oil price fell sharply
Geopolitical eventsConflict in producing regions disrupts supply and spikes priceThe 1990 Gulf War disrupted Middle East production and transport, pushing prices sharply higher
Economic growthGrowing economies burn more oil, lifting demand and priceChina’s rapid growth in the early 2000s drove up oil demand and price
Government policiesTaxes, subsidies, and sanctions shift supply or demandThe 2018 sanctions on Iran cut its oil supply and pushed prices up
Inventory levelsHigh storage means lower prices; low storage means higherThe 2020 COVID-19 demand collapse filled storage, and the oil price dropped
Natural disastersStorms and quakes disrupt production and transport, spiking priceHurricane Harvey in 2017 hit Gulf of Mexico production, spiking prices
Currency exchange ratesOil is priced in U.S. dollars, so a weaker dollar tends to lift the priceThe early-2000s dollar depreciation raised the oil price for non-dollar buyers

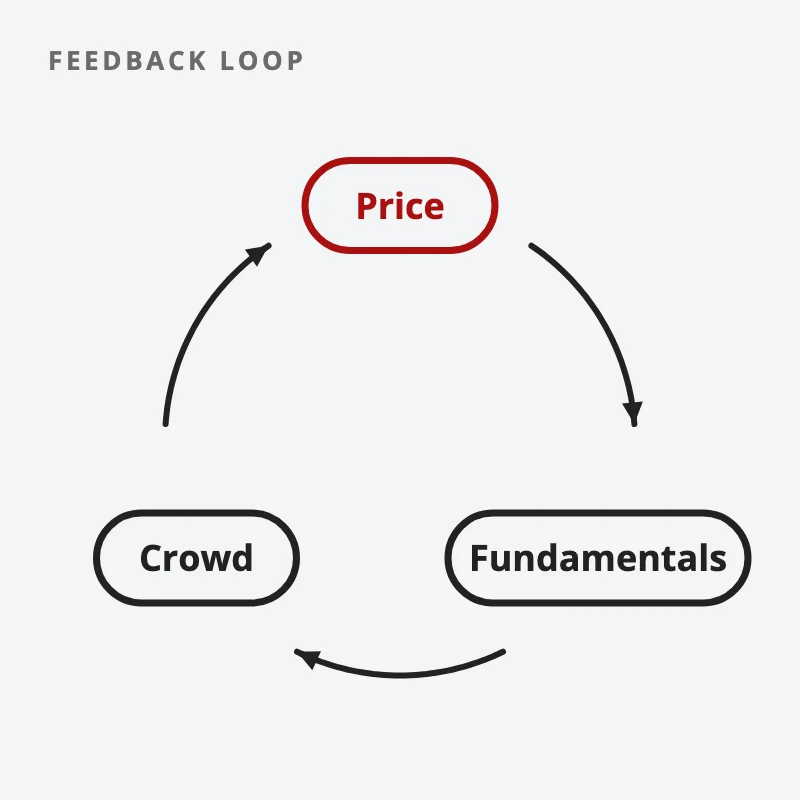
A pattern worth noticing in those examples: every price move also moved the traders. A supply disruption did not just raise price, it pulled in speculators buying futures in anticipation of more upside. A demand collapse did not just lower price, it triggered selling as traders cut their oil exposure. Price moves the fundamentals, and the fundamentals move the crowd, and the crowd moves price again. That feedback loop is most of what you are actually trading.

A loop of three boxes, price, fundamentals and crowd, with arrows running from each to the next and back to price
Price moves the fundamentals, the fundamentals move the crowd, and the crowd moves price again.

Keep in mind this is not the complete list. The oil market is complex, and plenty of other forces, internal and external, feed into the price.

How do you actually trade oil with all this going on?

Honestly, you do not need to forecast OPEC’s next meeting or model the dollar to trade oil well. That is the trap most beginners fall into. They try to out-analyze the entire energy complex, freeze, and never take a trade.

Personally, I trade oil the same way I trade everything else: as a chart. All of these factors, supply, demand, OPEC, the dollar, the next hurricane, are already being priced in by the market in real time, and they show up as the structure on the chart. My job is not to predict the news. My job is to read what price is doing, find a low-risk entry, size it properly, and manage the risk if I am wrong.

Here is where the human edge comes in. An AI or a news feed can summarize every oil factor above for you in a second. That part is now free. What it will not do is tell you that the fundamentals are screaming “buy” while the chart is quietly rolling over, or stop you from over-sizing a volatile commodity because the story felt so convincing. The information is the easy part. The judgment to act on it, or to stand aside, is the part worth learning, and it is the first of the Five Edges an algorithm cannot trade for you.

FAQ

What is the difference between Brent and WTI crude oil?
Both are light, sweet crude oils used as benchmarks, but Brent is extracted from the North Sea and prices about two-thirds of the world’s internationally traded crude, while WTI (West Texas Intermediate) is produced in the United States and is the benchmark for North American crude.

Why do oil prices change every day?
Because oil is priced by global supply and demand, and a handful of forces keep shifting both sides: OPEC production decisions, geopolitical events, economic growth, government policies, inventory levels, natural disasters, and the strength of the U.S. dollar.

How does OPEC affect oil prices?
OPEC members together produce about 40% of the world’s oil, so when they coordinate to cut production, supply drops and prices tend to rise, and when they raise production, supply grows and prices tend to fall.

How can I invest in or trade oil?
You can get exposure through futures contracts, options, oil ETFs, OTC derivatives, commodity-linked bonds, and oil-linked ETNs. Each tracks the oil price differently and carries its own risks, so understand the product before you commit.

Does a weaker U.S. dollar raise oil prices?
Generally yes. Oil is priced in U.S. dollars, so when the dollar weakens, oil becomes cheaper for buyers using other currencies, which tends to lift demand and the price.


So, will you consider adding an oil product to your portfolio, and how do you think the rise of renewable energy will reshape the oil market in the years ahead? Let me know in the comments.

And if you want the broader picture of how commodities fit alongside stocks, forex, and bonds, read the pillar: The Beginner’s Guide to Commodity Trading.

Want a simple way to trade any market, including oil? Grab the free 15-Minute Swing Trading Starter Kit. It’s the exact routine I use to scan once a day and trade any market in 15 minutes.


About the author. Spencer Li is The 15-Minute Trader and the founder of Synapse Trading. He is a Certified Financial Technician (CFTe) with 15+ years of trading, run from 70+ countries. He holds a B.Acc and B.BM from SMU. Every trade he takes is public, dated, losses left in. He teaches low-risk swing trading in 15 minutes a day, one system for any market.

Education, not financial advice. Synapse Trading is not licensed by MAS to advise on investment products. Trading carries risk of loss; past performance is not indicative of future results.


Related

Should You Own Gold? What It Does in a Portfolio, and How to Hold It From Singapore · What is forex trading

by Spencer Li
https://synapsetrading.com/wp-content/uploads/2026/10/oil-products-prices-card.webp 630 1200 Spencer Li https://synapsetrading.com/wp-content/uploads/2026/10/synapse-logo-horizontal-light.png Spencer Li2023-02-10 01:27:012026-10-22 13:20:02The Different Types of Oil Products & What Affects their Prices?
Spencer Li

What is Supercore Inflation and How to Trade it?

Markets & Products
What supercore inflation means - market news

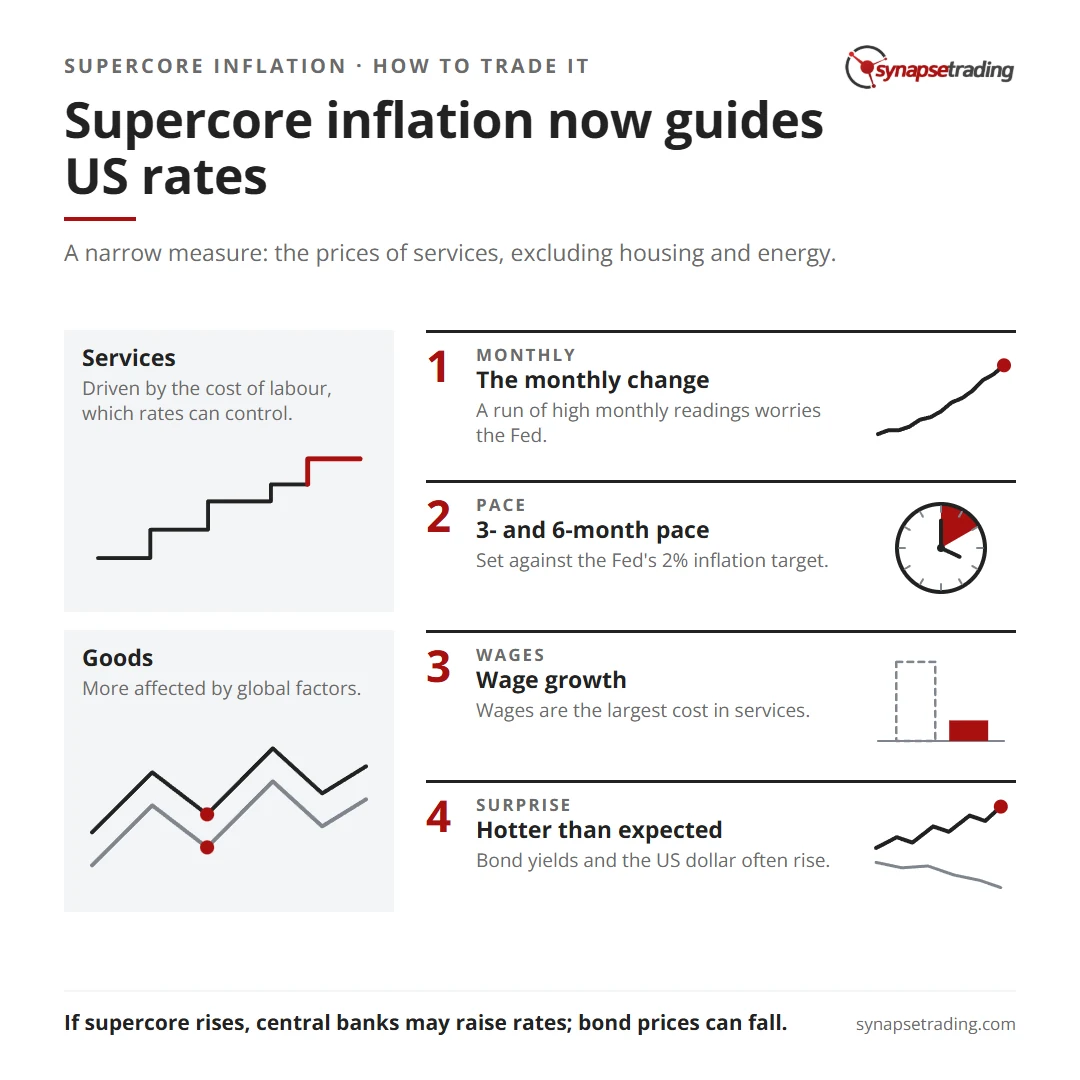
The Federal Reserve in the US is now using “supercore inflation” to guide interest-rate policy.

This narrow measure of inflation comprises the prices of services (e.g. barbers, lawyers, plumbers) excluding housing and energy prices.

The Fed is paying close attention to services as they tend to be driven by the cost of labor, which the Fed can more easily control with interest rates, whereas the price of goods are more affected by global factors.

The focus on supercore is expected to affect the Fed’s decisions on interest rate increases.

In this blog post, we will delve into the origin, calculation, and key numbers of supercore inflation, and explain how this data is relevant to you as a trader or investor.


Supercore inflation now guides US rates. Summary card for the post: What is Supercore Inflation and How to Trade it?.


What is Supercore Inflation and its Origin?

Supercore inflation is the rate of price change for core services, excluding housing.

“Core” inflation already leaves out food and energy. Supercore goes one step further and also leaves out housing, meaning rents and the rental value of owner-occupied homes. What is left is a wide range of services, from health care and education to haircuts and hospitality.

The term came into wide use in late 2022. On 30 November 2022, Fed Chair Jerome Powell gave a speech at the Brookings Institution in which he split core inflation into three parts: core goods, housing services, and core services other than housing.

He said the third part may be the most important one for understanding where core inflation goes next. The reason is wages. Wages are the largest cost in delivering these services, so this part of inflation follows the labor market closely.

How is the Data Calculated?

Supercore is not a separate headline release. It is worked out from price data that is already published.

The Fed’s version uses the Personal Consumption Expenditures (PCE) price index. The Bureau of Economic Analysis publishes it every month in its Personal Income and Outlays report, with detail for each spending category.

Start with core PCE services, which already leave out energy. Then take out housing. The price change of what remains is supercore.

A CPI version can be built the same way from the Bureau of Labor Statistics’ monthly CPI release: services excluding energy services, minus shelter.

Because it is a derived number, different banks and analysts can get slightly different readings, depending on the index and the weights they use.

What are the Key Numbers Measured?

When supercore data comes out, traders usually look at:

  • Personal Consumption Expenditures Price Index (PCE): This measures the prices of goods and services in the US economy.
  • The monthly change: how much supercore prices rose in the month. A run of high monthly readings is what worries the Fed.
  • The 3-month and 6-month pace: the change over 3 or 6 months, annualized, set against the Fed’s 2% inflation target. These show a turn sooner than the 12-month figure.
  • The 12-month rate: the slower figure, which shows how far services inflation still is from target.
  • Wage growth: average hourly earnings and the Employment Cost Index. Wages drive service prices, so wage data often hints at where supercore goes next.

By reading these numbers together, you can judge whether services inflation is cooling, and how much pressure the Fed is under to keep rates high.

How is this Data Relevant to Traders and Investors?

The data on supercore inflation is relevant to traders and investors because it can provide valuable insights into the current state of the economy and can help inform investment decisions.

Understanding trends in supercore inflation can help traders and investors anticipate changes in consumer behavior, interest rates, and monetary policy, which can all have a significant impact on financial markets.

For example, if supercore inflation keeps running hot, it tells you that wage-driven price pressure has not cooled yet, even if goods prices are falling.

That makes it more likely that the Fed keeps rates higher for longer, which matters for bonds, the US dollar and stocks.

Furthermore, trends in supercore inflation can also impact interest rates, which can have a significant impact on bond prices.

If supercore inflation is rising, central banks may raise interest rates in an effort to control inflation, which can have a negative impact on bond prices.

Hence, data on supercore inflation can provide traders and investors with valuable insights into the current state of the economy, and they need to be aware of these trends and take them into account when making investment decisions.

News Trading on Supercore Inflation Data

Here are some ways traders use a supercore reading around the release:

  • Hotter than expected: a bigger monthly rise than forecast suggests the Fed may keep rates high for longer. Bond yields and the US dollar often rise, and rate-sensitive stocks often fall.
  • Cooler than expected: a softer reading raises the odds of rate cuts. Yields and the dollar often fall, and stocks often rise.
  • The trend, not one reading: a single month can be noisy. Traders compare the 3-month and 6-month pace with the Fed’s 2% target before they change their view.
  • Wages as a cross-check: if wage growth is slowing too, a soft supercore reading is easier to believe. If wages are still hot, one soft month may not last.

By following supercore alongside what Fed officials say, traders can better judge where interest rates are heading, and how markets may react on release day.

Concluding Thoughts

In summary, supercore inflation is a valuable data point to keep an eye on if you are a trader or investor.

This narrow measure of inflation, which focuses on the prices of services excluding housing and energy prices, is gaining prominence as the Federal Reserve in the US uses it to guide interest-rate policy.

By tracking trends in supercore inflation, you can gain valuable insights into the current state of the economy, anticipate changes in consumer behavior, interest rates, and monetary policy, and make informed investment decisions.

The term is recent. It came into wide use in late 2022, when the Fed began singling out services inflation outside housing as a key guide to where inflation is heading.

Now that I have covered all about the importance of supercore inflation, is it something that you will add to your trading toolbox?

Let me know in the comments below.

by Spencer Li
https://synapsetrading.com/wp-content/uploads/2026/10/supercore-inflation-card.webp 630 1200 Spencer Li https://synapsetrading.com/wp-content/uploads/2026/10/synapse-logo-horizontal-light.png Spencer Li2023-02-08 18:43:272026-09-19 18:54:22What is Supercore Inflation and How to Trade it?
Page 9 of 14«‹7891011›»

Free checklist

The 15-Minute Swing Trader’s Checklist

The daily and weekly routine I use to find, manage and review trades in about 15 minutes a day, trading since 2007.

Get the free checklist

Topics

  • Trading foundations
  • Technical analysis
  • Strategies and systems
  • Risk and money
  • Trading psychology
  • Markets and products

Synapse Trading

Swing trading for busy professionals, in 15 minutes a day.

Start free

Learn

  • Start here
  • Free trading guides
  • Blog
  • Tools and resources

Programs

  • Trading Mastery Program
  • Daily trading signals
  • Student results
  • Public trade log

Company

  • About
  • Contact me
  • Partnerships
  • Disclaimer
  • Privacy policy
  • Terms & Conditions

Synapse Trading Pte Ltd
Registration No. 201316168H
WhatsApp +65-8897-1204
info@synapsetrading.com

Contact Us

Synapse Trading Pte Ltd
Registration No. 201316168H

Whatsapp: +65-8897-1204
Telegram: @iamrecneps
Email: info@synapsetrading.com

Links

Disclaimer
Privacy policy
Terms & Conditions
Contact us
Partnerships

© 2012-2026 Synapse Trading | All rights reserved. Educational content only, not personalised financial advice. Trading carries risk, including loss of capital. Past performance is not indicative of future results. Synapse Trading is not licensed or regulated by MAS.
  • Link to Facebook
  • Link to X
  • Link to Instagram
  • Link to Youtube
  • Link to LinkedIn
  • Link to Mail
Scroll to top Scroll to top Scroll to top