Market analysis, insights and trading ideas on various markets and products!

Forex Trading | USD/JPY

This was mentioned in my previous market outlook seminar as well, and I will be giving another one this coming Saturday, so do join us if you don’t want to miss out on the next important price moves.

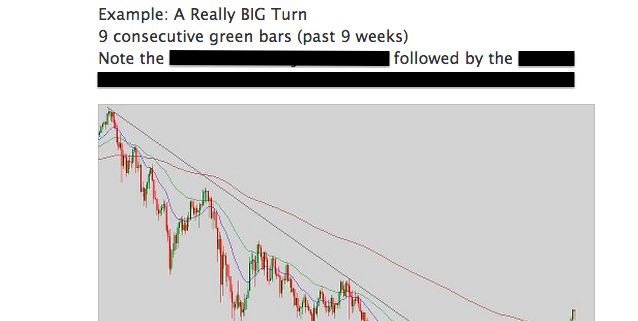
As you can see, behavioral analysis can be used for long-term investing as well, by studying the major BIG breaks, swings, bounces and turns. Sometimes it seems so simple that it’s laughable, but with this simple tool for market timing, investors can grow their capital much faster by catching the BIG moves only when they are happening, and keep their money constantly working for them.

Taken from “The Synapse Club” forum:
Forex Trading | EUR/USD 

Yesterday, our traders in “The Synapse Club” were alerted early of this excellent trading opportunity, as I managed to share it right after I placed my trades. This is one of the 4 major price behavior patterns, of which all 4 occur quite frequently on a daily basis. We hope that our small group of elite traders will soon be able to trade their way to financial freedom! Best of luck!

BIG Swings of Profits

This is the 5-min chart of EUR/USD, netting over 140 ticks after the BIG Break and following up with a BIG Swing!

BIG Swings of Profits 2

This is the 5-min chart of GBP/USD, netting over 85 ticks after the BIG Break and following up with a BIG Swing. However, the swing was much weaker than the EUR/USD.

 BIG Swings of Profits 3

The reason for this – the hourly chart of the EUR/GBP. EUR clearly exhibits strength relative to the GBP, helping us decide which BIG Swing to catch.

Start of A BIG Swing

Shared this free trade real-time in the private club forum so that everyone could profit from it together. That’s the advantage of working in a group, so that program graduates can share their trades and success.

I am expecting a BIG Swing, so I will continue to hold a long-term position. It is important (and I always stress this to my students), that one needs to let the winners ride. This is the only way to build up large winners.

A Tricky Price Manoeuvre

This is the hourly chart of Gold, which exhibited a tricky price manoeuvre by the BIG Boys, tricking newbies into going long if they relied on traditional technical analysis breakout setups or indicators.

The real BIG Break came right after that, giving us a very good short opportunity and easily netting a few thousand bucks within the next hour or so. Although it looks pretty obvious here, many would have missed out on this great opportunity because their charts are too cluttered with lines and indicators.