• Link to Facebook
  • Link to X
  • Link to Instagram
  • Link to Youtube
  • Link to LinkedIn
  • Link to Mail
Free PDF: The 15-Minute Swing Trader's Checklist, the daily routine on the record since 2014
Synapse Trading
  • Mentoring
    • Trading Mastery Program
    • All mentoring options
  • Signals
    • Daily trading signals
    • Signals trade log
  • Results
    • Student results and testimonials
    • Public trade log, losses left in
  • Free guides
    • Start here
    • Trading foundations
    • Technical analysis
    • Strategies and systems
    • Risk and money
    • Trading psychology
    • Markets and products
    • Free trading guides
    • Tools and resources
    • Blog
  • About
    • My background
    • My trading journey
    • Media and interviews
    • Travel log
  • Contact
    • Contact me
    • Partnerships
  • Start free
  • Click to open the search input field Click to open the search input field Search
  • Menu Menu
Spencer Li

The 3 Ms of Trading: Method, Money, Mindset

Trading Foundations
Method, money, mindset - trading basics

The 3Ms of Trading are Methodology, Money Management, and Mindset, and they each play a crucial role in your success in trading.

As a trader, you will need to master all 3 Ms, but you also need to know the relative importance of each factor.

In this post, I will explain how each factor affects your trading success, and which factors you should be focusing on to improve your trading.

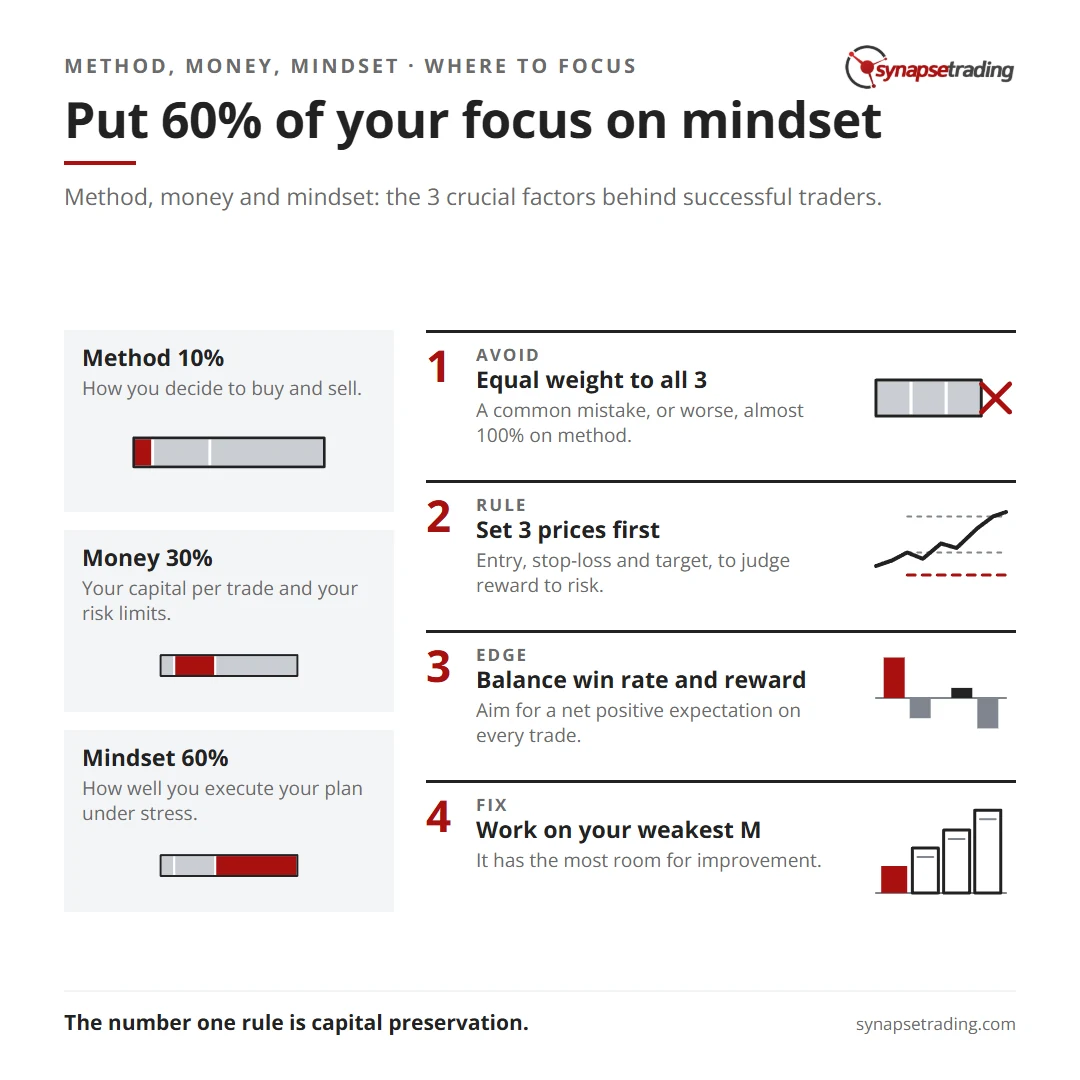
Put 60% of your focus on mindset. Summary card for the post: The 3 Ms of Trading: Method, Money, Mindset.


What to Focus on in Trading?

Having studied many professional traders, I found that there are 3 crucial factors that have led to their success.

All these market wizards have found success because they have understood and mastered the 3Ms of trading – Method, Money and Mindset.

Method (methodology): Process by which a trader enters into the market, using either technical or fundamental inputs to make their decision

Money (risk management): This includes capital allocation, risk parameters (drawdown limits), risk-to-reward calculations (entry price, profit target, stoploss)

Mindset (psychology): Market psychology is the most important part of trading, and determines how well you can execute your trading plan in the markets in real time

To many new traders who know of these 3Ms, they tend to make the mistake of giving equal weightage to all 3 parts (refer to above), or even worse, almost 100% weightage to the “Method”.

The psychology (mindset) is the hardest part of trading because emotions like greed and fear run wild once your money is at stake in the market.

Hence, your degree of rational analysis is only limited to how well you can manage your psychology.

Without the execution, the plan is useless. The money and risk management is also essential because it ensures your survival and consistency in the markets.

After all, the number one rule is capital preservation.

“Don’t focus on making money; focus on protecting what you have.” – Paul Tudor Jones


Methodology (10% Focus)

Methodology refers to your method of analysis, your strategy, your setups, basically the basis on which you make your buying and selling decisions.

As we will be covering in greater detail in other blog posts, I will not be elaborating too much on this here.

For now, all you need to know is that the most common tools used to make such decisions are technical analysis, fundamental analysis, or some combination of both.

Money Management (30% Focus)

Money management, or risk management, refers to how well you use your trading capital, to maximize your returns, while at the same time minimizing your risk.

This includes your capital allocation per trade, such as the 2% money management rule, and also things like risk parameters for each trade, such as maximum drawdown limits.

This means that for each trade, you will need to decide on the entry price (EP), stoploss price (SL), and target profit (TP) before you make each trade, so that you will be able to calculate the reward-to-risk (RR) ratio to decide whether it is worth taking the trade.

reward to risk ratio

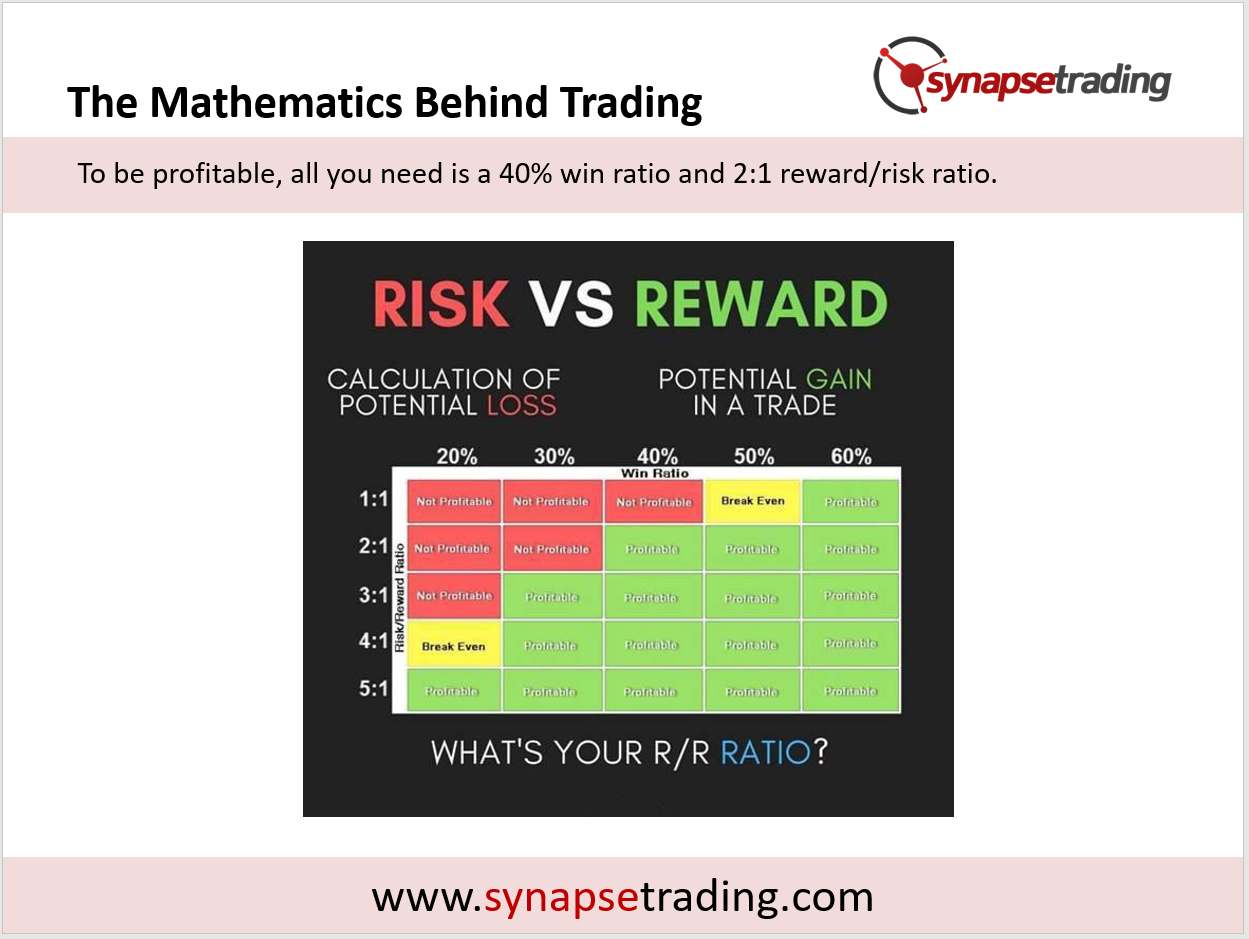
To be profitable in trading, all you need is a good balance between the win ratio (aka. hitrate) and the reward to risk ratio, to ensure that you have a net positive expectation on every trade.

For example, if you have a 40% win ratio, and your reward/risk ratio is 2, you will still come out ahead over many trades, before costs.


mathematics behind trading

Mindset (60% Focus)

The mindset, or trading psychology, is definitely the most important aspect of trading, and it is also the hardest to master.

This will determine how well you can make good decisions under stress, and consistently execute your trading plan without getting swayed by emotions.

Thinking accurately requires a certain level of self-awareness, so that we can avoid any behavioral biases that skew our rational thinking and decision-making process.


Summary

In conclusion, to be successful in trading, you need to master all the 3Ms, but the problem for most traders is they only tend to focus on 1 or 2 factors, and neglect the rest.

As a result, they might become very good at analysing charts (methodology), but remain poor at money management and trading psychology.

To improve your trading, the faster way to do so is to work on whatever you are weakest at, because that has the most room for improvement.

Now that I have shared the 3 important elements of trading, which do you think you are lacking the most, and will have the biggest impact on your trading if you work on improving it?

Let me know in the comments below.


thumbnail beginner guide to trading and TA

If you would like to learn how to get started in trading, also check out: “The Beginner’s Guide to Trading & Technical Analysis”

1 Comment/by Spencer Li
https://synapsetrading.com/wp-content/uploads/2026/10/money-method-mindset-card.webp 630 1200 Spencer Li https://synapsetrading.com/wp-content/uploads/2026/10/synapse-logo-horizontal-light.png Spencer Li2021-09-27 17:22:272026-08-21 19:56:23The 3 Ms of Trading: Method, Money, Mindset
Spencer Li

The 4 Types of Trading Strategies: Break, Swing, Bounce and Turn, and When Each One Works

Trading Foundations
Break, swing, bounce, turn - the four types of trading strategies

By Spencer Li, CFTe · Last updated: 10 October 2026

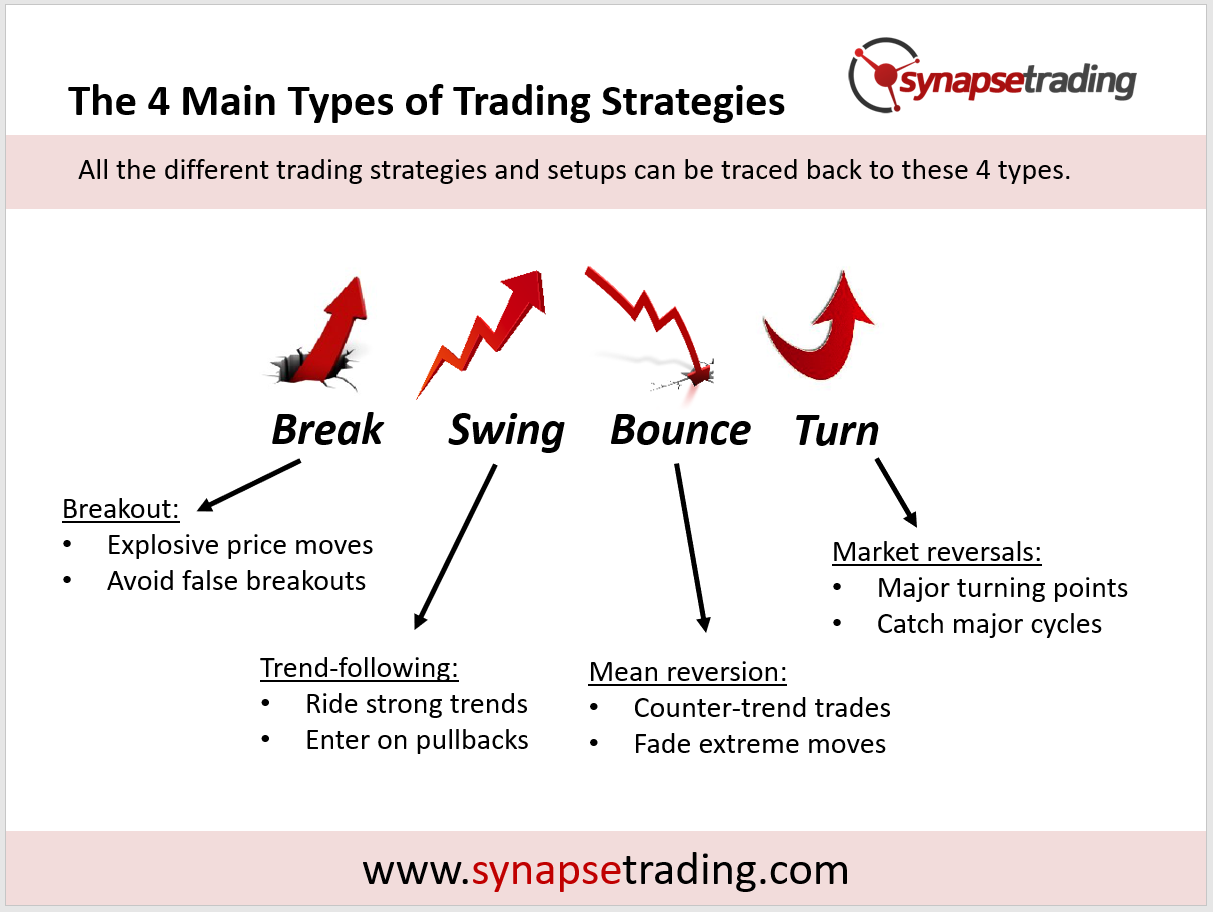
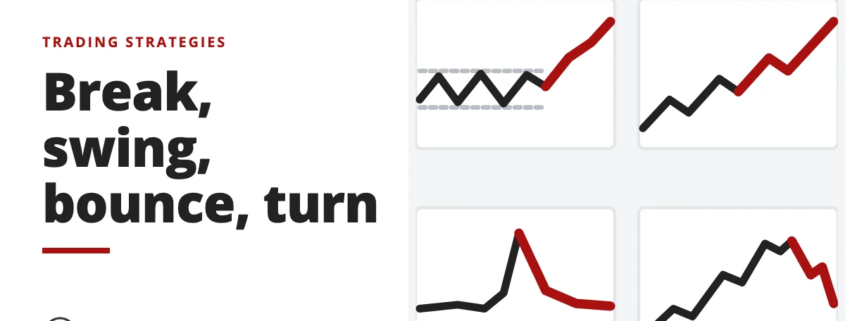
Every trading strategy you will ever be shown is a version of one of four types: Break, Swing, Bounce or Turn. Break trades a sideways range as it snaps, Swing rides a trend that is already moving, Bounce fades a move that has stretched too far, and Turn positions for the end of a big trend. What separates them is the market each one needs. So the useful question about any new strategy is which of the four it is, and whether the market in front of you is in that condition right now.

I first wrote about these four on this blog in 2021. I still tag my own trades with them today.
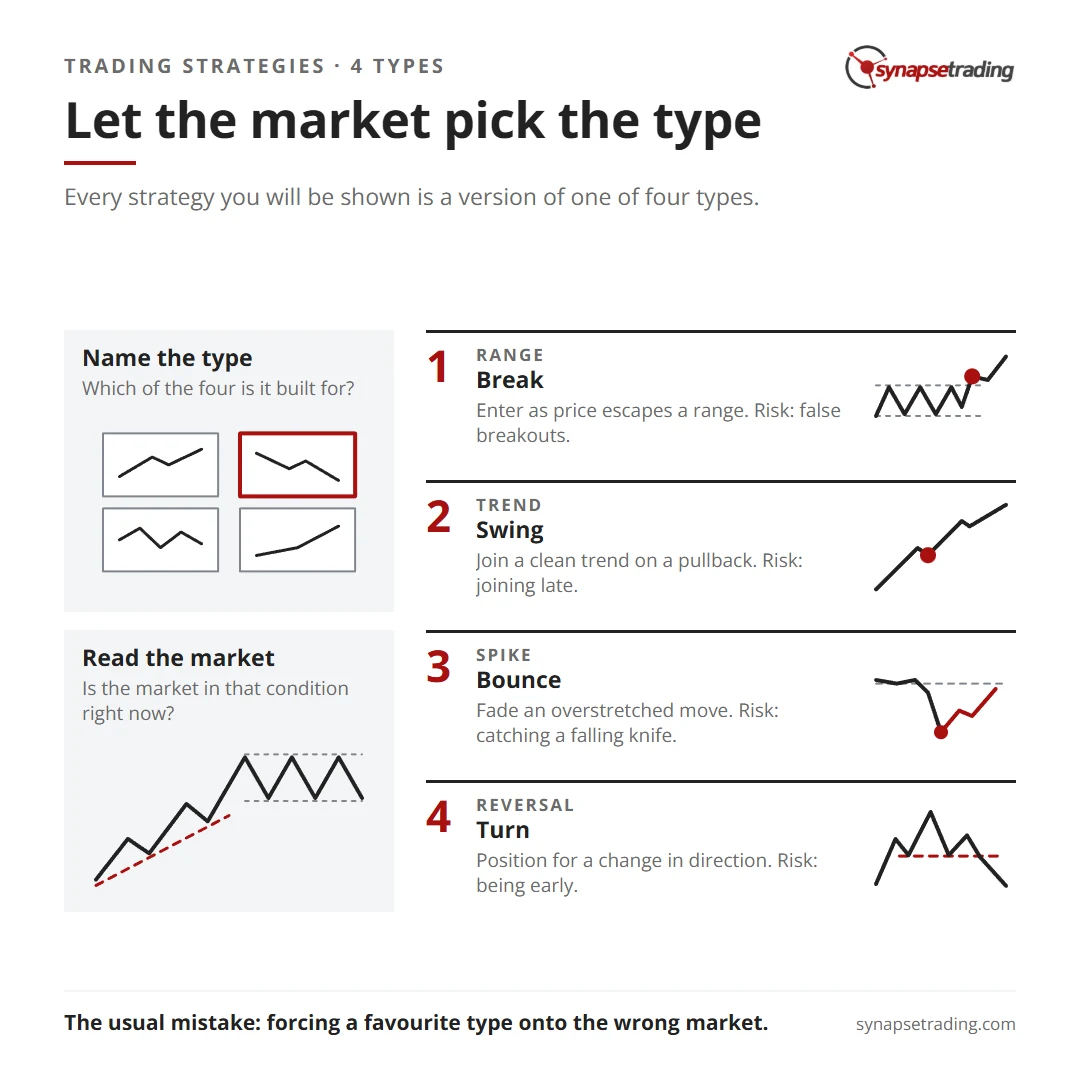
Let the market pick the type. Summary card for the post: The 4 Types of Trading Strategies: Break, Swing, Bounce and Turn, and When Each One Works.

Why do hundreds of strategies come down to four?

Most new traders collect strategies the way some people collect sneakers. A moving average crossover from one video, a candlestick pattern from another, an indicator a friend swears by, and after a year the folder is full while the account has barely moved.

Underneath, a price can only do four things a trader can make money from. It can break out of a range, it can trend, it can overshoot and snap back, or it can run out of steam and reverse. Each type is built for one of those, so once you see which one a strategy is built for, you know when it should work and what kind of losing to expect.

It is a bit like packing for a holiday. Nobody packs the same bag for Tokyo in January and Bangkok in April, and nobody blames the winter coat when it was simply the wrong trip. The weather picks the clothes. In trading, the market picks the type.

Nearly every chart I post with a trade idea carries a hashtag for its type. When the 734 annotated charts I posted between June 2024 and May 2026 were read one by one, about 40% were Swing and about 40% were Break. Bounce and Turn took roughly 10% each.

The 4 types of trading strategies, side by side

TypeWhat you doMarket it needsMain risk
BreakEnter as price escapes a rangeSideways, pressure buildingFalse breakouts
SwingJoin a trend on a pullbackA clean trendJoining late, or a fake trend
BounceFade an overstretched moveA sharp, climactic spikeCatching a falling knife
TurnPosition for a change in directionAn old trend whose structure is breakingBeing early, again and again

types of trading strategies

How does a Break trade work?

In my weekly outlook on 9 October 2025, I said I was not keen to chase crypto, even though the bigger picture still looked bullish. Crypto has a habit of breaking to new highs and then trending lower, and it had done exactly that after its breakout in August. So I said I would wait for a pullback, or for price to reclaim the breakout level and hold above it.

That week holds the whole tension of a Break. A breakout happens when buyers and sellers have been fighting over the same prices inside a sideways range, until one side wins and price escapes, sometimes very fast, because the pressure built up inside the range gets released at once.

The catch is the false breakout. Price pokes out of the range, traps everyone who chased it, and falls straight back inside. Ranges are noisy, so they produce plenty of these. Hence a breakout trader should care less about the breakout and more about the proof.

So I want proof that buyers have really taken over, not just a wick poking through the level. Often the cleaner moment is the retest, when price comes back to the broken level and it holds as support.

You do not need to watch every breakout live to use this. My free 15-minute swing trader checklist is the daily routine I use myself.

Why is Swing the type I trade most?

The most boring of the four is the one I lean on most. A Swing trade follows a trend that already exists, so nothing needs predicting, and the job is to wait for a market that is moving, let it pull back a little, and join it as it starts moving again.

My rules here are quite mechanical. I only go long when the longer-term trend is up and the moving averages agree with it. When the lines are tangled together, there is no trend worth riding, and the answer is to wait. When they agree, I wait for a small pullback and join as price starts moving again.

Plenty of traders reach for the RSI to time that entry. I once wrote in my trading channel that “in a strong trending market, oscillator indicators (such as RSI) are not going to be much use”. A strong trend can stay overbought for weeks, and the oscillator keeps telling you to sell the whole way up.

The danger with Swing sits at both ends. Join too late and the move is mostly gone. Mistake a brief pop for a trend and you get chopped up, one small stop after another. So the skill comes down to two questions. Is this a real trend, and is it still early enough to join?

When does a Bounce trade make sense?

In early February 2026, gold had just fallen hard, and in my weekly outlook I said I had started buying a little for my long-term portfolio. For trading, I passed. As I put it in the video, “this bounce trade was kind of too fast to actually trade”.

That is a Bounce in one decision. You are judging whether a move has stretched far enough to snap back, and whether it is moving slowly enough for you to get in.

The idea underneath is mean reversion, which says price tends to come back towards its average after stretching too far from it. Panic selling or a news shock can push a market well past where it normally trades, and the Bounce fades that stretch and rides the snap-back towards normal, usually over a few days rather than weeks.

My rules want a sharp, fast drop into a level where support is strong, such as a previous swing low or a moving average. A slow drift does not qualify. Then I want signs that the selling has exhausted itself before I go near it.

Do note that this is the riskiest of the four to get wrong, because you are trading against the momentum. If the fall is not exhausted, you are catching a falling knife, and a few of those can wipe out weeks of patient Swing trades. That fear is healthy, and it is why I treat Bounce trades with more caution than the other three.

Why is a Turn trade so hard to time?

On 9 October 2025, QQQ, the fund that tracks the Nasdaq 100, had just broken to new highs again and looked very overbought. I told viewers that “you never know how long it can continue going”, and pointed to the stretch before it, when it had simply kept creeping up for a really long time.

Every Turn trader lives with that problem. All markets move in cycles, so however strong a trend is, it eventually runs out of buyers or sellers and changes direction. Catch a real top or bottom and you are in at the start of the next big move, with a stop close by. But trends almost always run longer than anyone expects, and so the chronic problem with a Turn is being early. Call the top, get stopped out, call it again, get stopped out again, and by the time the market really turns, regret has worn your conviction down to nothing.

So my Turn rules carry the highest bar of the four. I want the old trend’s structure to break first, such as a long trendline giving way, a double bottom, or a head and shoulders. My trading notes put the reason in one line: it is “easier to make money from strong up-trends than to buy reversals”.

When the conditions line up, a Turn can be surprisingly clean. In November 2025 I pointed out a double bottom in USD/SGD, the US dollar against the Singapore dollar, that I had mentioned for weeks. Price had finally broken above it.

How do you know which type to use?

In March 2026, a trader on Reddit’s r/swingtrading, new to swing trading, made a fair point about breakouts: “it’s much easier for these patterns to emerge during bull market.”

They are right. A Break or a Swing needs a market with buyers in it, which is why my rules only buy when the longer-term trend is up, and that is also the whole argument for having four types instead of one. When the market changes, the type changes with it.

  • A range with no trend points to a Break.
  • A clean trend points to a Swing.
  • A violent, overstretched spike points to a Bounce.
  • An old trend whose structure is breaking points to a Turn.

The usual mistake is forcing a favourite type onto the wrong market. That looks like hunting breakouts in a quiet drift, fading every small pop as if it were a climax, or calling a top on a trend with plenty left in it.

So which type wins? My own records cannot tell you yet, and I would rather say so. Only a small share of my logged trades carry a setup tag, and the Bounce and Turn groups are far too small to rank anything. So no type has proved itself better than the others in my own book. Each one earns its place by fitting its own market.

Reading the market every day is a habit, and habits are easier to keep with a routine. The free 15-minute swing trader checklist is the one I run.

FAQ

What are the four types of trading strategies?
Break, which trades breakouts from a range, Swing, which follows a trend, Bounce, which fades an overstretched move, and Turn, which positions for a major reversal. Almost every strategy is a version of one of these.

What is the difference between a Bounce and a Turn?
A Bounce is a short-term trade against a sharp spike, with no claim that the bigger trend has changed. A Turn bets that the bigger trend itself is reversing, so it needs the trend’s structure to break first.

Which type of trading strategy is best for beginners?
Swing is usually the most forgiving, because you follow a move that already exists. Bounce and Turn trade against momentum and punish bad timing.

What is a false breakout?
It is when price pokes out of a range and falls back inside, trapping the traders who chased it. Waiting for a candle to close beyond the level, on strong volume, filters out many of them.

Can one trader use all four types?
Yes, though rarely at once. You use the type that fits the current market and stand aside with the rest.


Which of the four do you trade most, and have you ever caught yourself forcing it onto the wrong market? Let me know in the comments.

If you are just starting out, my Beginner’s Guide to Trading and Technical Analysis puts these four in order. The patterns behind most Break and Turn trades are in my guide to trading price chart patterns, and my free trading guides collect the rest.

thumbnail beginner guide to trading and TA

If you would like to learn how to get started in trading, also check out: “The Beginner’s Guide to Trading & Technical Analysis”

And if you want a routine that matches the type to the market without hours at the screen, grab the free 15-minute swing trader checklist.


About the author. Spencer Li is The 15-Minute Trader and the founder of Synapse Trading. He is a Certified Financial Technician (CFTe) with 15+ years of trading, run from 70+ countries. He holds a B.Acc and B.BM from SMU. Every trade he takes is public, dated, losses left in. He teaches low-risk swing trading in 15 minutes a day, one system for any market.

Education, not financial advice. Synapse Trading is not licensed by MAS to advise on investment products. Trading carries risk of loss, and past performance is not indicative of future results.

by Spencer Li
https://synapsetrading.com/wp-content/uploads/2026/10/types-trading-strategies-card.webp 630 1200 Spencer Li https://synapsetrading.com/wp-content/uploads/2026/10/synapse-logo-horizontal-light.png Spencer Li2021-06-18 16:41:372026-10-10 23:14:46The 4 Types of Trading Strategies: Break, Swing, Bounce and Turn, and When Each One Works
Spencer Li

The Different Styles of Trading (Holding Period, Timeframe, Products, etc)

Trading Foundations
Find your trading style - trading strategies

The 3 Styles of Trading: Short-Term vs Medium-Term vs Long-Term (and Which Fits You)

Last updated: 27 September 2026 · By Spencer Li, CFTe


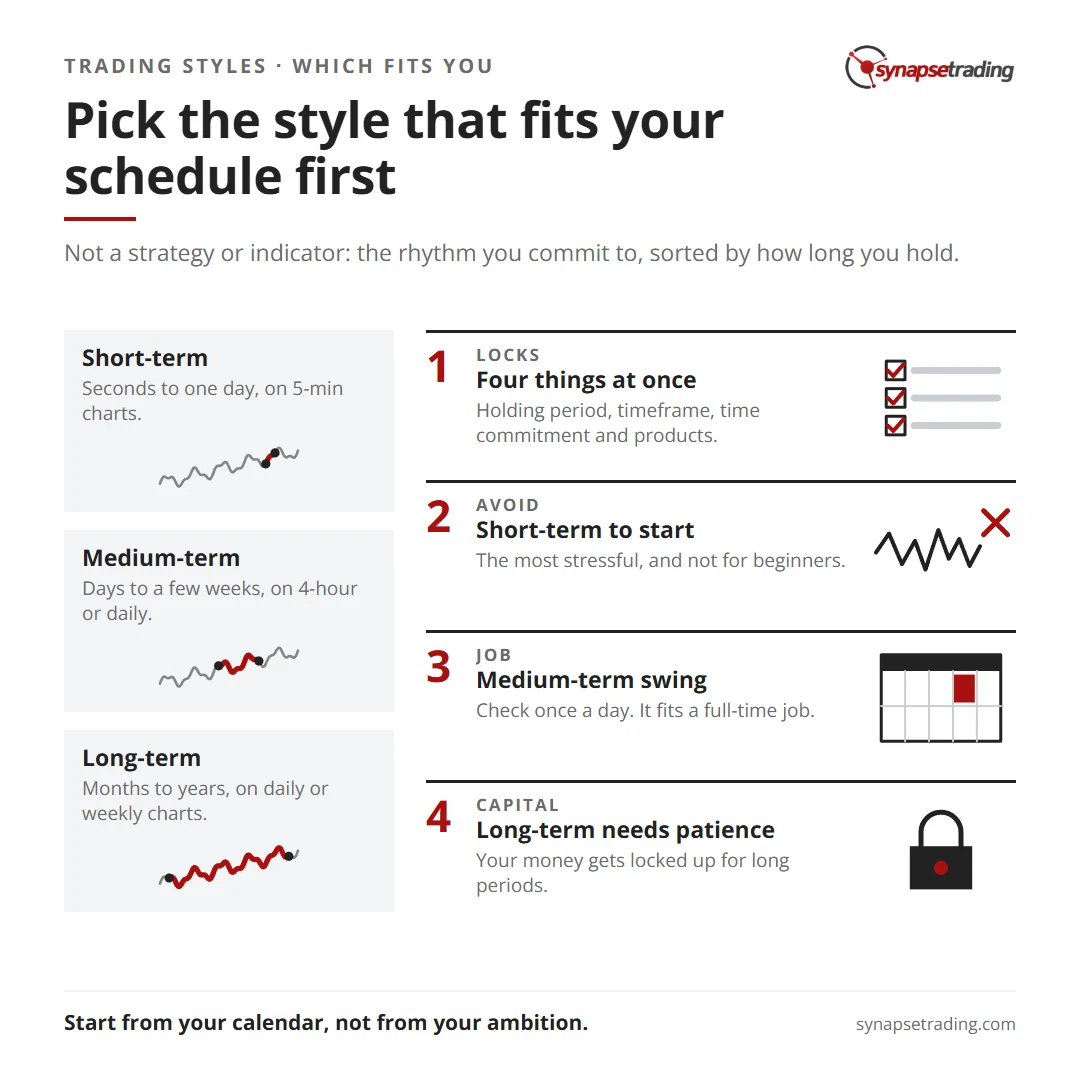
There are three main styles of trading, sorted by how long you hold a position: short-term, medium-term, and long-term. Short-term trading (day trading and scalping) means closing positions within the same day or even within seconds, using 5-minute or 15-minute charts, and it suits full-time traders who can watch the screen constantly. Medium-term trading, also called swing trading, holds for days to a few weeks on the 4-hour or daily chart, and it is the best fit for part-time traders with a full-time job. Long-term trading holds for months to years on the daily or weekly chart, and it suits people who want to check in only weekly or monthly. Your style decides your holding period, your timeframe, your time commitment, and the products you trade. For most people with a job, medium-term swing trading is the sensible starting point. Short-term trading is the most stressful and the least beginner-friendly, so I do not recommend it to people just starting out.

Here is how each style works, who it suits, and where it goes wrong.

Pick the style that fits your schedule first. Summary card for the post: The Different Styles of Trading (Holding Period, Timeframe, Products, etc).

What does “trading style” actually mean?

By style, I mean the way you approach trading. It is not the strategy or the indicator. It is the rhythm you commit to.

That rhythm then locks in four things at once:

  • Your holding period (seconds, days, or months)
  • Your timeframe (which chart you read)
  • Your time commitment (how often you have to look)
  • The products you can realistically trade

Get the style wrong for your life, and nothing downstream will work. A person with a 9-to-5 who tries to scalp 5-minute charts will lose to the people doing it full time. Pick the style that fits your schedule first, then build the strategy on top.

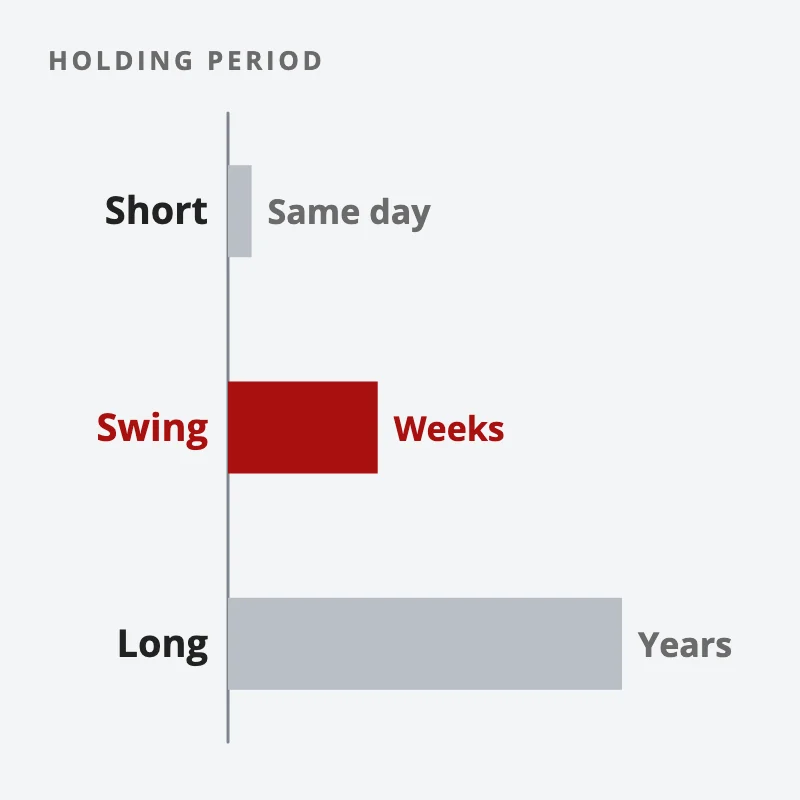
Bars for the three trading styles by holding period: short-term closes the same day, swing holds for weeks (highlighted), long-term holds for years
Your style sets how long you hold, and swing trading fits a full-time job.

The 3 styles, side by side

Holding periodMain timeframeHow often you checkBest forTypical products
Short-term (day trading, scalping)Seconds to one day5-min, 15-min, or shorterConstantly, every few minutesFull-time tradersForex, futures, larger stock markets
Medium-term (swing trading)Days to a few weeks4-hour or dailyEvery few hours or once a dayPart-time traders with a jobForex, CFDs, lower-cost stock markets
Long-term (position trading, investing)Months to yearsDaily or weeklyWeekly, monthly, even quarterlyPeople with no time, more capitalStocks, ETFs, REITs, dividend assets

The products differ for a reason. Short-term traders need things that are very liquid, have low commissions, and move enough during a single day to be worth trading. Medium-term traders want products built for retail, with transaction costs low enough that holding for days still pays. Long-term traders want assets that appreciate over time and pay you to wait, which is why dividends and REITs show up here and not in scalping.

Is short-term trading right for me?

Short-term trading is mainly for people doing it full time. It includes day trading (closing all positions by the end of the day, so you never hold overnight) and scalping (taking extremely short-term positions that can last seconds).

You will mainly be using 5-minute or 15-minute charts, or even shorter timeframes. That means checking your screen every few minutes, or staring at it constantly.

This can be quite stressful for beginners. Hence, it is strongly not recommended as a starting point. The people on the other side of your trades are often full-timers with faster tools and years of screen time, and you are paying commissions on every fast in-and-out.

Is medium-term (swing) trading right for me?

Medium-term trading is the most ideal for part-time traders, because it does not require much monitoring of the markets. It is also known as swing trading, because it captures the “swings” in the market.

You will mainly be using the 4-hour or daily chart. So you only need to check your charts every few hours, or even once a day. That makes it ideal for people who have a full-time job and do not want to spend all day looking at charts.

Personally, this is the style I teach and trade. The products tend to be the ones better suited to retail traders: forex, CFDs (contracts for difference, where you trade the price move without owning the asset), and stock markets that do not carry too-high transaction costs. You get most of the opportunity without the screen addiction.

Is long-term trading right for me?

Long-term trading is suited for people who do not have any time at all. It includes position traders and investors who take positions that can last months or years. For how it differs from swing trading, see what position trading is and how it compares with swing trading and investing.

You will mainly be using the daily or weekly chart, so you will probably only be checking your positions weekly, monthly, or even quarterly. This is the most hands-off option.

Do note that, it also requires a lot of patience. And it is not suitable for people with little capital, because your money is going to get locked up for long periods. The products tend to be more asset-based: stocks, ETFs (exchange-traded funds, baskets of assets you buy in one ticker), REITs (real estate investment trusts), and other assets that can appreciate over time and pay dividends.

So which style should you pick?

Start from your calendar, not from your ambition. The honest order for most people:

  1. Have a full-time job and limited screen time? Medium-term swing trading. This is the default I point beginners to.
  2. Trading full time and able to watch the market all day? Short-term becomes possible, but go in knowing it is the most stressful and the most competitive.
  3. Have spare capital, plenty of patience, and almost no time to watch? Long-term position trading lets your money work while you do other things.

There is no “best” style in the abstract. There is only the one that fits your time, your capital, and your temperament. The traders who blow up usually picked a style that fought their own life.

A screener can tell you what a chart is doing on any timeframe. It cannot tell you which timeframe you can actually sustain at 11pm after a full day of work. That choice, matching the style to your real life and then holding the discipline to stay in it, is judgment, and it is the first of the Human Edges no tool trades for you.

FAQ

What are the 3 main styles of trading?
Short-term (day trading and scalping), medium-term (swing trading), and long-term (position trading and investing). They differ by holding period, timeframe, time commitment, and the products traded.

Which trading style is best for beginners with a full-time job?
Medium-term swing trading. It uses the 4-hour or daily chart, so you only need to check your positions every few hours or once a day, which fits around a full-time job.

What is the difference between day trading and swing trading?
Day trading closes all positions within the same day, using very short timeframes like 5-minute or 15-minute charts and constant screen time. Swing trading holds for days to a few weeks on the 4-hour or daily chart, needing only a daily check.

Why is short-term trading not recommended for beginners?
It uses 5-minute or 15-minute charts that demand near-constant attention, which is stressful, and you are competing against full-time traders with faster tools while paying commissions on frequent trades.

What products suit each trading style?
Short-term suits liquid, low-commission, high-movement markets like forex, futures, and large stock markets. Medium-term suits retail-friendly forex, CFDs, and lower-cost stocks. Long-term suits asset-based holdings like stocks, ETFs, REITs, and dividend payers.


Now that you have the three styles side by side, which one actually fits your week? Let me know in the comments.

And if you are still deciding where to start, read the pillar: The Beginner’s Guide to Trading and Technical Analysis.

Want a style that fits a busy schedule? Grab the free 15-Minute Swing Trading Starter Kit. It’s the exact routine I use to scan once a day and trade any market in 15 minutes.


About the author. Spencer Li is The 15-Minute Trader and the founder of Synapse Trading. He is a Certified Financial Technician (CFTe) with 15+ years of trading, run from 70+ countries. He holds a B.Acc and B.BM from SMU. Every trade he takes is public, dated, losses left in. He teaches rules-based swing trading in 15 minutes a day, one system for any market.

Education, not financial advice. Synapse Trading is not licensed by MAS to advise on investment products. Trading carries risk of loss; past performance is not indicative of future results.

Related

Beginner’s Guide to Trading and Technical Analysis (pillar) · What is swing trading? · Day trading vs swing trading · How much capital do you need to start trading?

by Spencer Li
https://synapsetrading.com/wp-content/uploads/2026/10/different-styles-trading-card.webp 630 1200 Spencer Li https://synapsetrading.com/wp-content/uploads/2026/10/synapse-logo-horizontal-light.png Spencer Li2021-06-18 16:38:002026-09-27 17:35:02The Different Styles of Trading (Holding Period, Timeframe, Products, etc)
Spencer Li

Exotic & Uncommon Technical Analysis Methods

Trading Foundations
Exotic technical analysis methods - technical analysis

Uncommon Technical Analysis Methods: 11 Exotic Trading Tools (And Whether They Still Work)

Last updated: 4 September 2026 · By Spencer Li, CFTe


Uncommon technical analysis methods are the exotic, less-mainstream ways of reading charts, like Fibonacci, Elliott Wave, Gann theory, harmonic patterns, Ichimoku, and Market Profile. Most were genuinely popular at some point, then faded as the hype died down or simpler methods replaced them, and today their use is mostly confined to hobbyists and niche bloggers. Are they worth your time? None of them is a shortcut. The trader matters more than the method. Below is the full list of 11 and what each one actually does in plain language.

You can spend a year mastering an exotic method and still lose money, because the method was never the hard part.

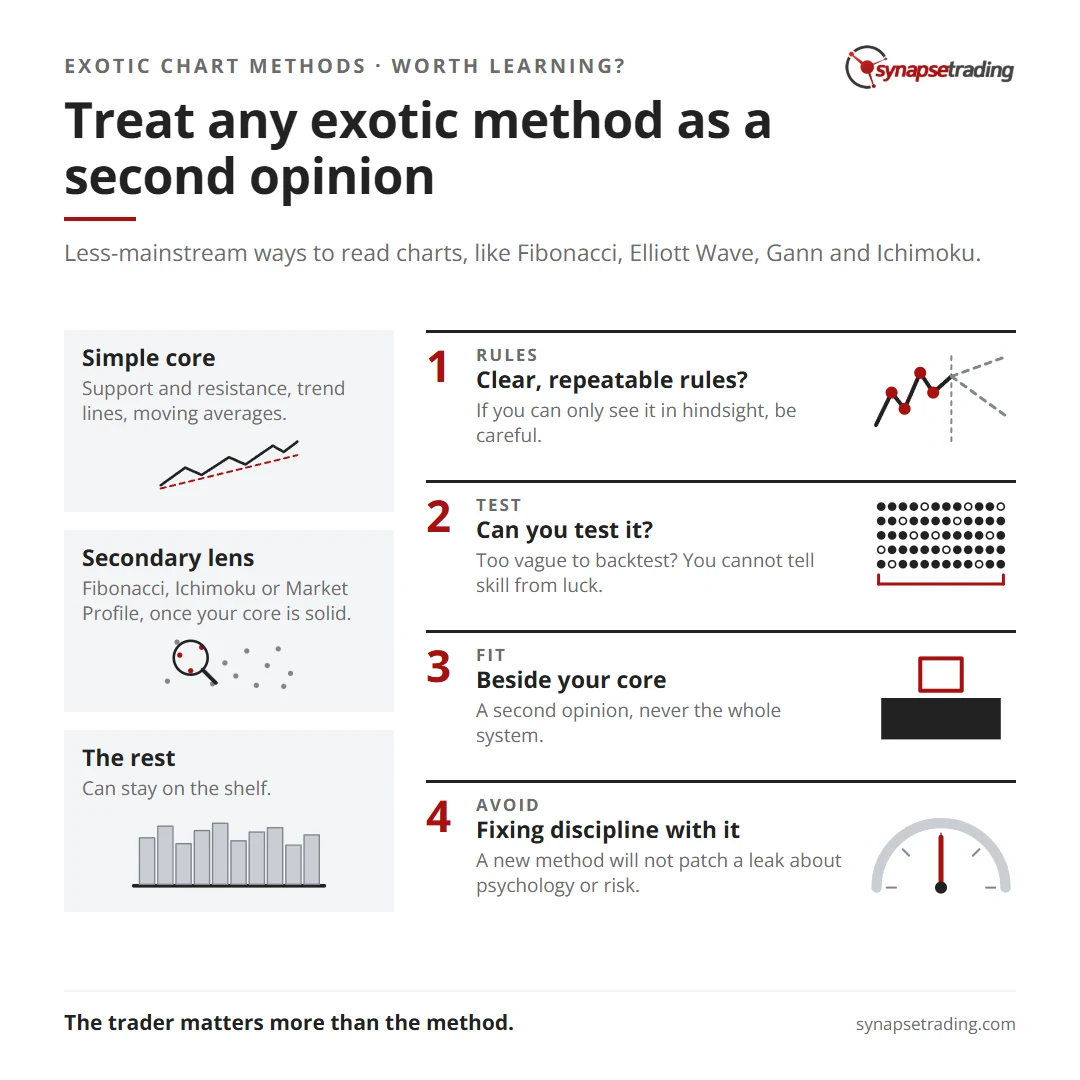
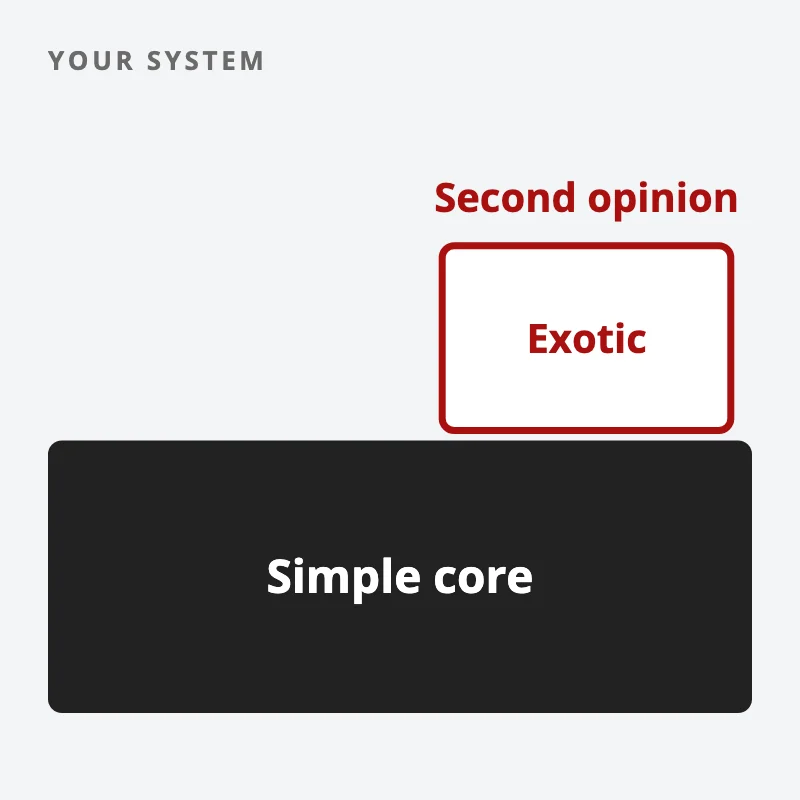
Treat any exotic method as a second opinion. Summary card for the post: Exotic & Uncommon Technical Analysis Methods.

What counts as “uncommon” technical analysis?

Mainstream technical analysis is the stuff most professionals lean on: support and resistance, trend lines, moving averages, basic chart patterns, and a handful of momentum indicators. It is common because it is simple and it travels well across markets.

Uncommon technical analysis (sometimes called exotic, unorthodox, or alternative TA) is everything past that fence. These are methods with their own rulebooks, their own jargon, and often their own devoted following. Some are rigorous. Some are closer to numerology with a chart attached. The label “uncommon” is not an insult, it just means fewer traders use it day to day.

The 11 uncommon methods, side by side

Here they are with a one-line definition (jargon explained) and my honest take.

MethodWhat it actually doesMy take
Fibonacci analysisUses ratios from the Fibonacci sequence (0.382, 0.5, 0.618) to mark likely retracement and extension levels on a moveUseful as a secondary lens for picking levels; do not treat the lines as magic
Elliott Wave theoryReads price as repeating 5-wave and 3-wave cycles driven by crowd psychologyBeautiful in hindsight, hard to call in real time; the count changes after the fact
Gann theoryW.D. Gann’s system linking price, time, and geometric angles (the “Gann fan”) to forecast turnsFamous, complex, and to me more mystique than edge
Harmonic patternsGeometric patterns (Gartley, Bat, Butterfly, Crab) defined by precise Fibonacci ratios between swing pointsA more structured cousin of Fibonacci; precise rules, demanding to trade well
Dow theoryThe original trend-following framework: trends have phases, and indices should confirm each otherFoundational and still sound; most modern TA quietly rests on it
Ichimoku Kinko Hyo (Cloud charting)A Japanese all-in-one indicator: the “cloud” (Kumo) shows support, resistance, trend, and momentum at a glanceGenuinely useful once you learn it; busy on the chart at first
Volume Spread Analysis (VSA)Reads the relationship between price spread, volume, and the close to infer what large players are doingSensible logic (volume confirms price); interpretation is subjective
Market ProfilePlots price against time-at-price to show where the market accepted value (the “value area”)Strong for understanding where trade actually happened; popular with futures traders
Pitchfork analysisAndrews’ Pitchfork draws three parallel trend lines from three pivots to map a channelA clean way to frame a channel; one tool, not a system
Point and Figure (P&F)Plots price moves only (Xs and Os), ignoring time entirely, to filter out noiseOld-school noise filter; a niche taste today
Cycle analysisLooks for repeating time cycles (highs and lows recurring on a rhythm) to anticipate turnsTempting, but cycles drift and break right when you start trusting them

If one row jumps out at you, good. That is the row worth a weekend of reading. The other ten can stay on the shelf.

Were these methods ever actually popular?

Yes, and that history matters. Many of these were the cutting edge of their day. Dow theory underpins almost everything that came after it. Gann and Elliott had cult followings for decades. Ichimoku has been standard in Japan for generations.

What happened is ordinary. The hype around a method cools, or a simpler tool does most of the same job with less effort, and usage drifts to a smaller circle of specialists, hobbyists, and bloggers who keep the flame alive. That is not proof a method is useless. It is just how attention moves.

Are uncommon technical analysis methods worth learning?

Here is my honest position. A small number of these earn a place as a secondary lens once your core is solid. Fibonacci for levels, Ichimoku for an at-a-glance read of trend, Market Profile for understanding where value sits. The rest are worth knowing about, mostly so you can recognise them when someone online presents one as a holy grail.

A wide dark block labelled simple core, with a small red-outlined block labelled exotic sitting on top as a second opinion
Build on a simple core and treat any exotic method as a second opinion.

The trap is the same with every exotic method. It looks complicated, so it feels powerful, so a beginner assumes the complexity is what is missing from their results. It usually is not. I trade a simple core, scan once a day, and the edge lives in the decisions, not in the indicator count.

A method can flag a setup. It cannot tell you to size it down, sit out a coin-flip, or walk away after two losses. That gap is the first of the Five Edges, judgment, and no chart tool, exotic or plain, closes it for you.

How to decide if an exotic method is for you

A quick filter before you sink a month into any of these:

  • Does it give clear, repeatable rules, or does it only make sense after the move? If you can only “see it” in hindsight (the classic Elliott Wave complaint), be careful.
  • Can you test it? If the rules are too vague to backtest, you cannot tell skill from luck.
  • Does it replace your core, or sit beside it? Treat any exotic method as a second opinion, never the whole system.
  • Are you reaching for it to fix a discipline problem? A new method will not patch a leak that is really about psychology or risk.

If a method survives that filter, learn it properly. If it does not, you just saved yourself a month.

FAQ

What are uncommon technical analysis methods?
They are the less-mainstream ways of reading charts, including Fibonacci analysis, Elliott Wave theory, Gann theory, harmonic patterns, Dow theory, Ichimoku (Cloud charting), Volume Spread Analysis, Market Profile, Pitchfork analysis, Point and Figure, and cycle analysis. Most were once popular and are now used mainly by specialists and hobbyists.

Which uncommon method is the most useful?
In my view, a few earn a place as a secondary lens: Fibonacci for picking levels, Ichimoku for a quick read of trend and momentum, and Market Profile for seeing where the market accepted value. Dow theory is foundational and still sound.

Do professional traders use exotic technical analysis?
Some do, but most professionals build on a simple mainstream core (support and resistance, trends, moving averages, basic patterns) and add at most one or two of these as a supporting view. Very few trade an exotic method on its own.

Is Elliott Wave or Gann theory reliable?
Both have devoted followings, but both are hard to apply consistently in real time, because the interpretation often only becomes clear after the move has happened. Know what they are, but be skeptical of anyone selling them as a sure thing.

Should a beginner learn these first?
No. Master a simple mainstream core and your risk and psychology first. Exotic methods are a second opinion, not a foundation, and the complexity can distract a beginner from the parts that actually move the needle.


So which of the 11 are you tempted to study, and which have you already written off? Let me know in the comments.

And if you want the simple core before the exotic stuff, start with the basics: The Beginner’s Guide to Trading and Technical Analysis.

Want the system, not another indicator? Grab the free 15-Minute Swing Trading Starter Kit. It’s the exact routine I use to scan once a day and trade any market in 15 minutes, no exotic tools required.


About the author. Spencer Li is The 15-Minute Trader and the founder of Synapse Trading. He is a Certified Financial Technician (CFTe) with 15+ years of trading, run from 70+ countries. He holds a B.Acc and B.BM from SMU. Every trade he takes is public, dated, losses left in. He teaches rules-based swing trading in 15 minutes a day, one system for any market.

Education, not financial advice. Synapse Trading is not licensed by MAS to advise on investment products. Trading carries risk of loss; past performance is not indicative of future results.

Related

The Beginner’s Guide to Trading and Technical Analysis (pillar) · Definitive Guide to Price Chart Patterns · Fibonacci retracement strategy · Ichimoku Cloud explained

by Spencer Li
https://synapsetrading.com/wp-content/uploads/2026/10/uncommon-technical-analysis-card.webp 630 1200 Spencer Li https://synapsetrading.com/wp-content/uploads/2026/10/synapse-logo-horizontal-light.png Spencer Li2021-06-18 16:29:362026-09-04 09:56:32Exotic & Uncommon Technical Analysis Methods
Spencer Li

The 3 Main Types of Technical Analysis

Trading Foundations
Three ways to read charts - technical analysis

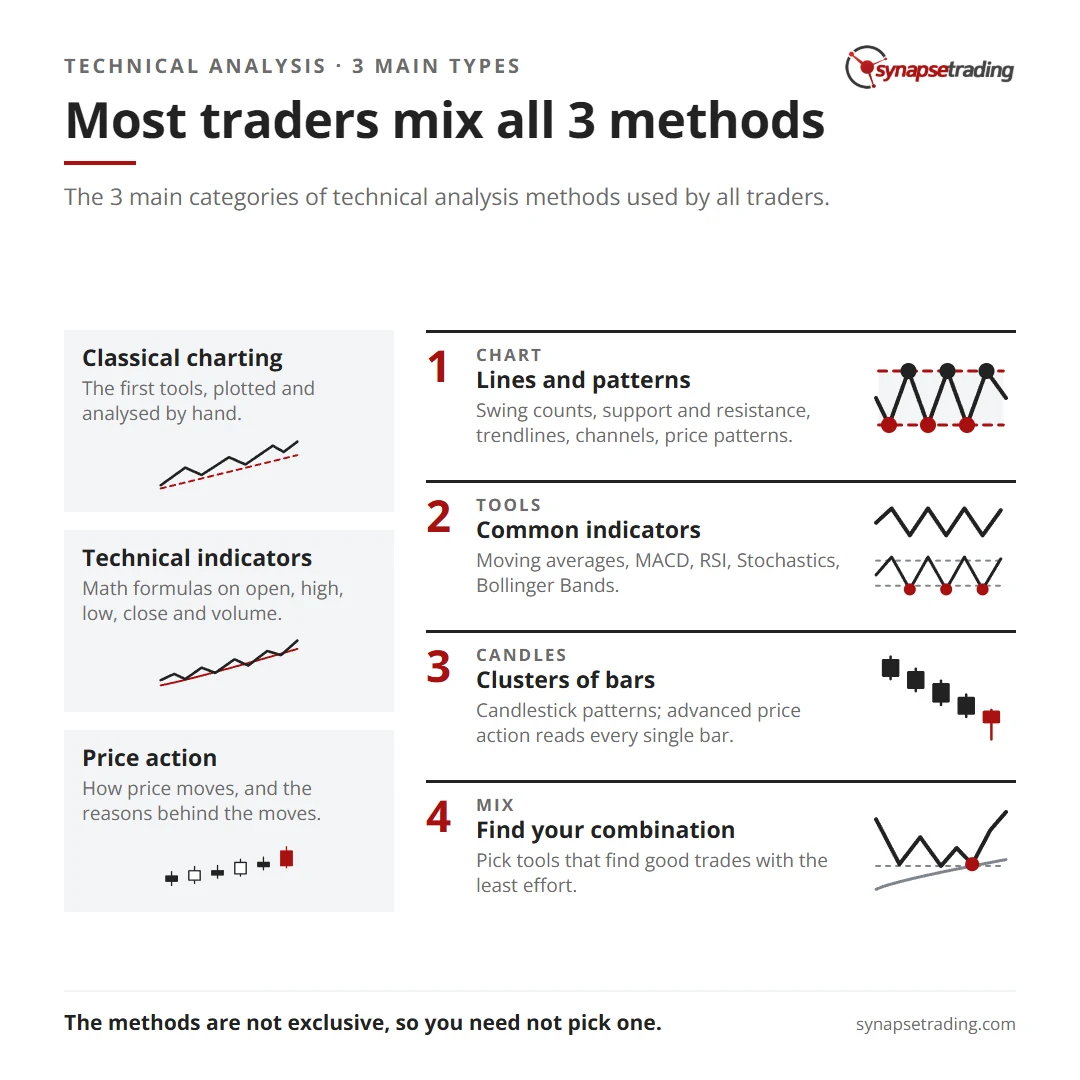
There are 3 main categories of technical analysis methods that are used by all traders:

  • Classical charting
  • Technical indicators
  • Price action

Since I will be doing separate guides for each of these methods, for now I will be briefly going through each one.


Most traders mix all 3 methods. Summary card for the post: The 3 Main Types of Technical Analysis.


1. Classical Charting

These were the very first tools developed by traders, back when there were no computers and charts had to be plotted and analysed manually.

They include things like swing counts, support and resistance levels, trendlines, channels, price patterns, etc.

Even today, most traders still use these methods, usually in conjunction with other methods.

2. Technical Indicators

With the advent of computers, traders started using them to crunch numbers, and by applying mathematical formulas (using the open, high, low, close, volume data) were able to add another dimension of analysis which was not always obvious by visual observation.

There are thousands of indicators, but the common ones used are moving averages, MACD (moving average convergence divergence), RSI (relative strength index), Stochastics, Bollinger Bands, etc.

3. Price Action

Price action is a pretty broad category, but the main idea is to study the movement of price, while understanding the underlying reasons for such moves.

In the past, one such method was tape-reading, which has now evolved to reading the price ladder and order flow. but these are more for intraday traders on very short timeframes. I used to do that when I was trading for funds.

For retail traders, the more common approach is to study candlestick patterns, which is to identify unique clusters of bars, but for more advanced price action, it involves studying every single individual bar.

Most traders will use a combination of all 3 methods, since they are not mutually exclusive. The idea is to find a combination of tools that can enable you to find good trading opportunities with the least amount of effort.


thumbnail beginner guide to trading and TA

If you would like to learn how to get started in trading, also check out: “The Beginner’s Guide to Trading & Technical Analysis”

by Spencer Li
https://synapsetrading.com/wp-content/uploads/2026/10/types-technical-analysis-card.webp 630 1200 Spencer Li https://synapsetrading.com/wp-content/uploads/2026/10/synapse-logo-horizontal-light.png Spencer Li2021-06-18 16:26:562026-09-03 21:38:43The 3 Main Types of Technical Analysis
Page 8 of 12«‹678910›»

Free checklist

The 15-Minute Swing Trader’s Checklist

The daily and weekly routine I use to find, manage and review trades in about 15 minutes a day, on the record since 2014.

Get the free checklist

Topics

  • Trading foundations
  • Technical analysis
  • Strategies and systems
  • Risk and money
  • Trading psychology
  • Markets and products

Synapse Trading

Swing trading for busy professionals, in 15 minutes a day.

Start free

Learn

  • Start here
  • Free trading guides
  • Blog
  • Tools and resources

Programs

  • Trading Mastery Program
  • Daily trading signals
  • Student results
  • Public trade log

Company

  • About
  • Contact me
  • Partnerships
  • Disclaimer
  • Privacy policy
  • Terms & Conditions

Synapse Trading Pte Ltd
Registration No. 201316168H
WhatsApp +65-8897-1204
info@synapsetrading.com

Contact Us

Synapse Trading Pte Ltd
Registration No. 201316168H

Whatsapp: +65-8897-1204
Telegram: @iamrecneps
Email: info@synapsetrading.com

Links

Disclaimer
Privacy policy
Terms & Conditions
Contact us
Partnerships

© 2012-2026 Synapse Trading | All rights reserved. Educational content only, not personalised financial advice. Trading carries risk, including loss of capital. Past performance is not indicative of future results. Synapse Trading is not licensed or regulated by MAS.
  • Link to Facebook
  • Link to X
  • Link to Instagram
  • Link to Youtube
  • Link to LinkedIn
  • Link to Mail
Scroll to top Scroll to top Scroll to top