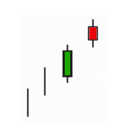
Bullish Irikubi & Bearish Irikubi Pattern
Join our Telegram channel for more market analysis & trading tips: t.me/synapsetrading
In Neck Pattern – Bullish Irikubi
Definition
A bullish Irikubi (line in the neck) structure is comprised of two Japanese candlesticks.
The first is a large bullish candlestick (green) followed by a small bearish candlestick (red) with a closing just below the closing level of the previous candlestick.
The second candlestick must be significantly smaller than the first.
Illustration
Characteristic
A bullish Irikubi often forms after a significant increase characterized by several large green Japanese candlesticks.
Significance
The in neck pattern (bullish Irikubi) is a continuation pattern, indicating a continuation of the bullish movement.
The small red candlestick signifies a hedge on long positions.
Note
For the structure to be validated, the next candlestick must be bullish and close above the opening price of the small bearish candlestick (red).
Invalidation
If the lowest point of the small bearish candlestick surpasses the next candlestick, the structure can be considered invalidated.
In Neck Pattern – Bearish Irikubi
Definition
A bearish Irikubi (line in the neck) structure is comprised of two Japanese candlesticks.
The first is a large bearish candlestick (red) followed by a small bullish candlestick (green) with a closing just above the closing level of the previous candlestick.
The second candlestick must be significantly smaller than the first.
Illustration
Characteristic
A bearish Irikubi often forms after a significant decline characterized by several large red Japanese candlesticks.
Significance
The in neck pattern (bearish Irikubi) is a continuation pattern, indicating a continuation of the bearish movement.
The small green candlestick signifies a hedge on short positions.
Note
For the structure to be validated, the next candlestick must be bearish and close below the opening price of the small bullish candlestick (green).
Invalidation
If the highest point on the small bullish candlestick surpasses the next candlestick, the structure can be considered invalidated.
Concluding Thoughts
The bullish and bearish Irikubi patterns, as in neck patterns, serve as important continuation signals within the context of ongoing trends.
While these patterns provide valuable insights into potential trend continuations, traders must always validate the structure with subsequent candlestick behavior to avoid false signals.
As with other candlestick patterns, combining these with additional technical indicators and analysis is recommended to strengthen trading strategies and enhance the accuracy of predictions.
 Our flagship mentoring program is suitable for both beginners and advanced traders, covering the 4 strategies which I used over the past 15 years to build up my 7-figure personal trading portfolio.
 If you're looking for a reputable brokerage that covers all products (SG stocks, US stocks, global stocks, bonds, ETFs, REITs, forex, futures, crypto) and has one of the lowest commissions, this is what I currently use.
The Synapse Network is our dedicated global support team, including event managers, research teams, trainers, contributors, as well as the graduates and alumni from all our previous training program intakes.


Leave a Reply
Want to join the discussion?Feel free to contribute!