
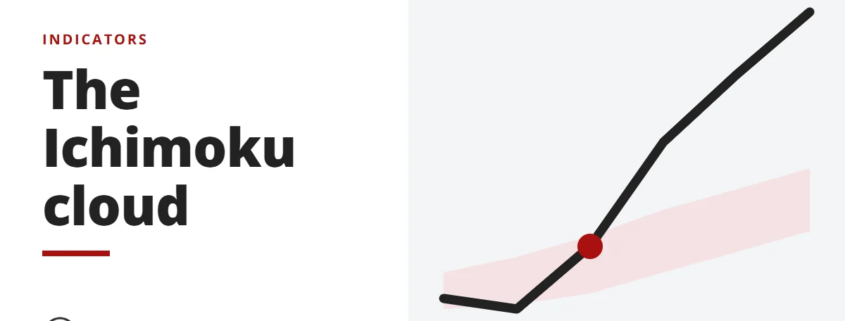
The Ichimoku Cloud combines several averages to show support, resistance, momentum and trend in one view. See how each line and the cloud are read.

Every guide and post on the site, newest first.
The Ichimoku Cloud combines several averages to show support, resistance, momentum and trend in one view. See how each line and the cloud are read.
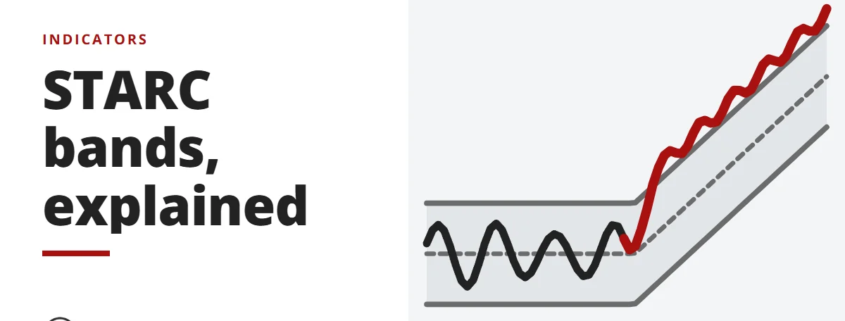
STARC bands, from Manning Stoller, sit above and below a simple moving average at a multiple of the average true range. See how traders use them.
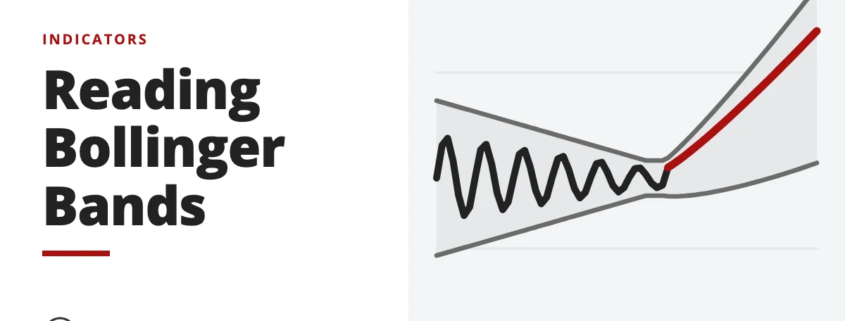
Bollinger Bands, developed by John Bollinger in the 1980s, plot three lines that move with price to gauge volatility. See how to read the bands on a chart.
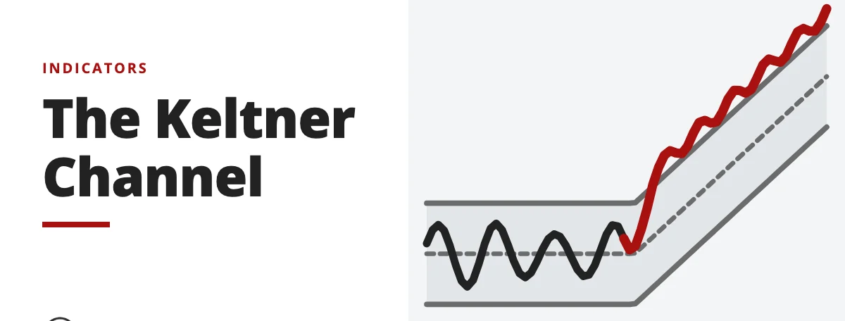
Keltner Channels are volatility bands set either side of price using the average true range. See how breaks above or below the bands signal a continuation.
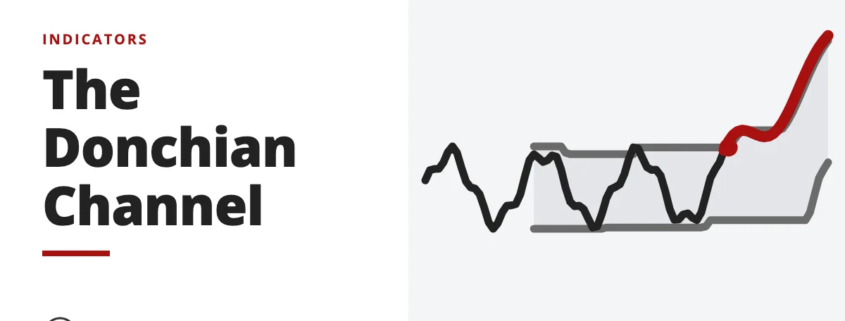
The Donchian channel rests on a simple formula that most platforms plot for you. See how it is calculated and how traders use it to read price trends.