Despite what people may otherwise tell you or any preconceived ideas you may have, there are only two things that move stock prices.
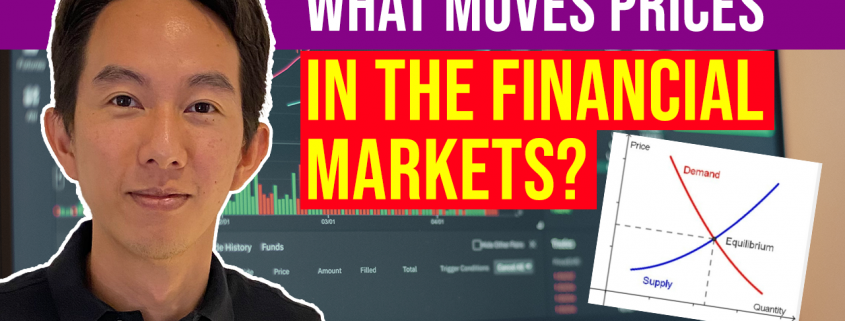
They are supply and demand – nothing more and nothing less. This is the foundation of basic economics as shown in the graph below.
Since quantity remains the same, price is what fluctuates as a results of supply and demand.
If there is more demand than supply for a stock, then the price shall rise.
Conversely, if there is more supply than demand for something, then the price shall fall.
This is absolutely true in any market.

The next question is what affects the supply and demand for a particular security or traded instrument.
Is it the profits in the financial statements? The upcoming expansion plans? The new product? Is it dividend payments?
No one can be absolutely sure at any point why people may be buying and selling shares.
That’s where technical analysis comes into play.
At no time does technical analysis attempt to determine why there might be supply and demand, only that there are certain levels of supply and demand.
By studying actual movements in the price and volume, we can go a long way to determining what the present demand and supply is and therefore predicting the future direction price will take.
All fundamental and economic influences on a share price are already taken into consideration in the market, which is reflected in the price.
As a trader, what you are buying and selling is the actual price, not financial statements or ratios like the P/E ratio or ROE figures.
Ultimately, it is the price that ultimately determines whether you make money or not, and what you think the price should be has NO influence whatsoever on the price.
The next big revelation is that the bulk of supply and demand does not come from retail traders or retail investors.
They come from the big boys (BB) and smart money (SM) like traders and fund managers in banks, funds and other institutions.
They are the ones who move the market.
Learning to interpret price action and volume is our window to tap into their psyche and profit from their actions.
Supply refers to the sellers (bears) who are looking to sell (which pushes prices down), whereas demand refers to the buyers (bulls) who are looking to buy (which pushes prices up).
The constant battle between the buyers and sellers creates fluctuations in prices, which can be as short as a few seconds, or create trends which can last for years.
As a trader, finding the sweet spot where there is an imbalance in the forces (such a a huge build-up of buyers or sellers on either side) can give you an edge in the market, so that you can enter the market just as a big move is about to occur.