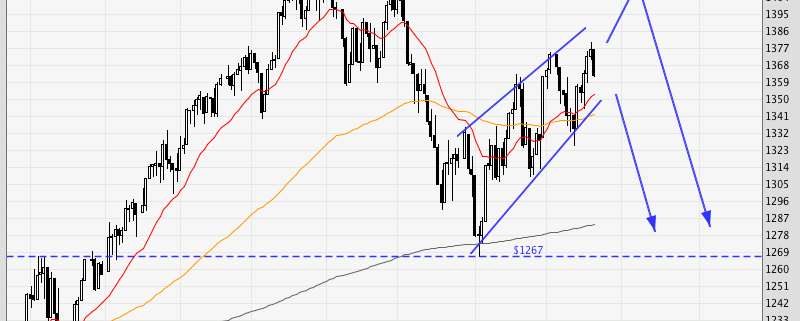
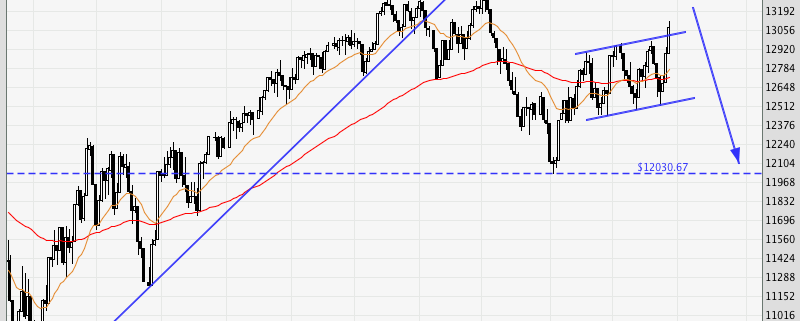
Rising Wedge

Making a great effort to rise, giving rise to a wedge-shaped pattern.
Market could either aim to test the old high of 1415 before coming back down, or go straight down from here to test the previous low of 1267.
For the former to occur, the market would have to take out the most recent swing high. Let’s see which plays out.

Breakout to New Lows

Breakout to new lows on the daily chart
Expecting more opportunities to the downside

Breakout to New Lows 2

Intraday wedge breakdown which coincided with news release…
Stars in Alignment: Price, Pattern, Time

Breakout to New Lows 3

An intraday double bottom near support after a long decline.
A pullback after the double bottom provided another long opportunity.
Let’s see if it can hit the top where the arrow is.

Wedge Breakdown

Shorted on wedge breakdown, target at where the arrow is.
Level is 1.0360.

Initiate Longs

Initiated longs in anticipation of inverted H&S breakout
Took partial profits near neckline, and added longs after breakout
Exited all positions on weakness

Intraday Trading with Price Action

Using 3 timeframes of 5-min, 1-hour and 1-min, this is a simple way to pinpoint entries and exits to scalp the EUR/USD, as well as take longer term intraday swing positions.

From the chart, it is obvious the price action is contained in a downwards sloping channel, which means that most opportunities will have a short bias, since the edge lies in that direction – the path of least resistance.

In total, there were at least 20 good entry opportunities which provided a scalp/swing ranging from 4 to 16 ticks (each tick is USD 12.50 per contract), for those who are thinking of trading intraday. I am waiting for it to pull back to the top of the channel for another opportunity to catch another major swing down.