Monthly Market Wrap (April 2026)
Join our Telegram channel for more market analysis & trading tips: t.me/synapsetrading
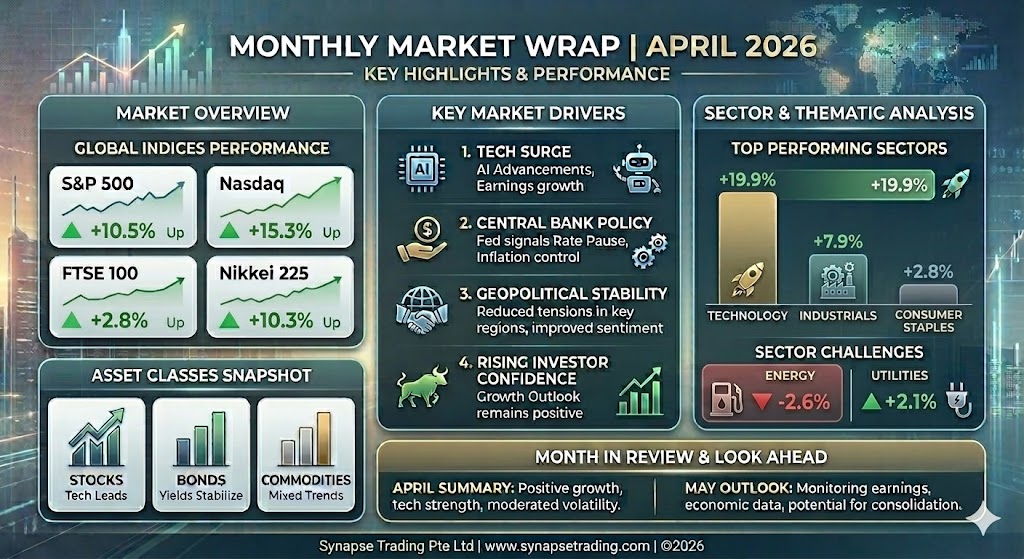
The global financial ecosystem in April 2026 operated at the intersection of a significant regional war and a transformative technological supercycle. While the month of March was characterized by the initial shock of open hostilities between the United States and Iran, leading to the effective closure of the Strait of Hormuz, April witnessed a profound decoupling of financial assets from geopolitical volatility. This period was marked by the S&P 500 delivering a 10.5% monthly return, a rare occurrence documented only 13 times in the last half-century, as investors looked past the immediate fog of war to capitalize on the accelerating artificial intelligence (AI) infrastructure build-out. The narrative of the month was one of structural economic resilience, where robust corporate earnings and productivity-enhancing business investment countered the headwinds of double-digit energy inflation and a hawkish shift in global monetary expectations.
Table of Contents
1. Macroeconomic Momentum: The Transition to Investment-Led Growth
The U.S. economy demonstrated a notable acceleration in the first quarter of 2026, with the advance estimate of Real Gross Domestic Product (GDP) rising at an annual rate of 2.0%. This performance was particularly significant as it followed a period of stagnation at the end of 2025, where growth had slowed to a mere 0.5% amidst a federal government shutdown. The rebound suggests that the underlying momentum of the private sector remained intact despite fiscal disruptions. A critical driver of this growth was the quadrupling of Business Fixed Investment (BFI), which contributed 1.4 percentage points to the topline GDP figure. This surge in capital expenditure was led by an annualized 17.2% increase in business equipment and a 13.0% rise in intellectual property products, reflecting a strategic pivot by American corporations toward automation and software-driven productivity.
Table 1: U.S. Economic Indicators and GDP Composition (Q1 2026)
| Indicator | Value / Rate | Quarterly Change / Contribution |
| Real GDP (Advance Estimate) | +2.0% | +1.5% from Q4 2025 |
| Personal Consumption Expenditures (PCE) | +1.6% | +1.1 ppts |
| Business Fixed Investment (BFI) | +10.0%+ | +1.4 ppts |
| – Real Business Equipment | +17.2% | Leading Component |
| – Intellectual Property Products | +13.0% | Software Acceleration |
| – Data Center Structures | +22.0% | Infrastructure Boom |
| Private Domestic Final Purchases (PDFP) | Solid Rate | +2.2 ppts |
| Government Spending (State & Local) | Rebound | +0.7 ppts |
| Residential Investment | Contraction | 5th Consecutive Decline |
The composition of growth indicates a bifurcated economy. While business investment flourished, residential investment continued its moderate contraction, marking the fifth consecutive quarter of decline. This downturn was primarily driven by a fall in single-family residence construction and a decrease in brokers’ commissions, highlighting the continued sensitivity of the housing market to elevated mortgage rates. However, the resilience of Private Domestic Final Purchases (PDFP)—which includes personal consumption, BFI, and residential investment—suggests that the domestic core of the economy is on a stable path, contributing 2.2 percentage points to growth. The labor market supported this stability, with initial jobless claims holding near 209,000 in early May, reinforcing the narrative of a “higher-for-longer” economic equilibrium where employment remains tight despite restrictive monetary conditions.
2. Inflationary Complexities: The Energy Shock and Pipeline Pressures
Inflation in April 2026 presented a challenging puzzle for policymakers, as core price moderation was offset by a massive energy-driven headline spike. Twelve-month core Consumer Price Index (CPI) inflation stood at 2.6% in March, showing a slight moderation from the previous year, yet monthly core inflation ticked up to an average of 0.2% per month in the first quarter. The primary source of concern, however, was the energy sector. Energy price inflation reached 12.5% on a twelve-month basis through March 2026, a stark contrast to the 3.3% decline recorded a year earlier. Gasoline prices, specifically, surged 18.9% over the twelve months ending in March, reflecting the immediate impact of the Persian Gulf disruptions on domestic fuel costs.
Table 2: U.S. Inflation Metrics – March 2026 (Released April 2026)
| Category | 1-Month % Change | 12-Month % Change | Key Drivers |
| All Items (Headline CPI) | +1.0% (NSA) | +3.3% | Energy, Gasoline |
| Core CPI (Less Food & Energy) | +0.2% | +2.6% | Shelter, Airfares |
| Energy Goods and Services | +0.6% | +12.5% | Fuel Oil (+44.2%), Gasoline |
| Food at Home | +0.2% | +2.7% | Meats (-0.9% YoY), Eggs (-3.4%) |
| Food Away from Home | Stable | +3.8% | Service Labor Costs |
| Shelter | +0.3% | Elevated | Rent, Owners’ Equivalent Rent |
| Airline Fares | +2.7% | +14.9% | Energy Pass-through |
| Producer Price Index (PPI) | +0.5% (SA) | +4.0% | Energy (+8.5%), Goods (+1.6%) |
The Producer Price Index (PPI) data released in mid-April signaled that further consumer-level price hikes may be imminent. Final demand PPI rose 0.5% in March, with goods prices jumping 1.6%, driven largely by an 8.5% surge in energy components. Of particular concern to analysts is the widening gap between PPI core consumer goods and CPI core goods, which expanded to 2.1 percentage points in March from 1.0 percentage point in September 2025. This suggests that manufacturers and retailers are currently absorbing higher input costs that have not yet been fully reflected in consumer retail prices. Furthermore, the persistent elevation of “food away from home” inflation, which has remained in the 3.6%-4.0% range since mid-2024, points to a structural wage-price floor in the services sector that may resist the Federal Reserve’s efforts to reach its 2% target.
3. Central Banking and the Transition of Power at the Federal Reserve
The month of April was a period of high-stakes transition for the Federal Reserve. On March 4, 2026, President Trump formally sent the nomination of Kevin Warsh to the Senate to serve as the next Chairman of the Federal Reserve. The nomination aimed to replace Jerome Powell, whose term as chair expires on May 15, 2026. Warsh’s path to confirmation, however, was initially clouded by a criminal investigation into Jerome Powell regarding a $2.5 billion renovation of the Fed’s headquarters, a situation Senator Thom Tillis used as leverage to block Warsh’s hearing. The impasse broke on April 24, when U.S. Attorney Jeanine Pirro announced the end of the probe into Powell, clearing the way for Warsh to testify before the Senate Banking Committee.
During his testimony, Warsh sought to project an image of strict independence, stating that the President had never asked him to predetermine interest rate decisions. However, market participants noted that Warsh has echoed administration rhetoric regarding the role of AI in boosting productivity, suggesting that the economy can grow faster without triggering inflation—a stance that implies a more dovish outlook on the neutral rate. Despite this potential shift, the FOMC, still under Powell’s leadership, voted unanimously at the April 28-29 meeting to maintain the federal funds target range at 3.50%-3.75%. The committee’s implementation note also directed the Open Market Desk to continue increasing Treasury holdings to maintain an ample level of reserves, signaling a preference for stability during the leadership handover.
Table 3: Global Central Bank Posture (April 2026)
| Institution | Policy Rate | April Action | Policy Outlook |
| Federal Reserve | 3.50% – 3.75% | Hold (Unanimous) | Warsh nomination; 0 cuts priced for 2026. |
| Bank of Japan | ~0.75% | Hold (6-3 Vote) | Increasing hawkish dissent; June hike possible. |
| European Central Bank | 2.00% | Hold | June hike signaled if energy prices stay high. |
| Bank of England | 5.00%+ (implied) | N/A | Gilt yields at 18-year highs; inflation concern. |
Internationally, the trend toward tighter policy was more pronounced. The Bank of Japan (BoJ) kept its overnight call rate at 0.75% at its April 28 meeting, but the decision was a narrow 6-3 majority. Three board members—Nakagawa, Takata, and Tamura—voted for an immediate hike to 1.0%, citing the achievement of price stability targets and the upside risks posed by overseas developments and second-round price effects. This high level of internal dissent suggests that Japan’s exit from accommodative policy is accelerating. Similarly, the European Central Bank (ECB), while holding its deposit rate at 2.0% on April 30, noted that officials debated a rate increase during the meeting. President Lagarde signaled that a June hike is likely if energy prices continue to pressure Eurozone CPI, which was estimated at 3.0% for April.
4. Geopolitical Turmoil: The Strait of Hormuz and Peace Proposals
The ongoing conflict between the United States and Iran remained the most volatile variable in global markets throughout April 2026. Since military strikes began in early March, the Strait of Hormuz has been functionally closed, choking off 20% of global oil supply. The resulting logistical nightmare has left approximately 1,500 ships and 20,000 crew members trapped in the region. On April 7, a temporary two-week ceasefire was brokered by Pakistan, during which President Trump announced that Iran would immediately open the strait and work toward a final peace agreement. However, by April 9, Iran accused the U.S. and Israel of violating the truce with strikes in Lebanon, and ships remained unable to move.
Diplomatic efforts intensified in late April as Axios reported that Iran, through Pakistani mediators, had submitted a “one-page memorandum” to end the war. The Iranian proposal offered to reopen the Strait of Hormuz and extend the ceasefire in exchange for the lifting of the U.S. naval blockade on Iranian ports. Notably, the proposal suggested postponing nuclear negotiations to a later date, a move the White House viewed with skepticism as it would remove U.S. leverage over Iran’s enriched uranium stockpile. Furthermore, Iran introduced a controversial plan to charge vessels a fee for transiting the strait, with Supreme Leader Mojtaba Khamenei referring to a “new management” that would reap economic benefits for the regime.
In early May, the U.S. launched “Project Freedom,” a military effort to coordinate and guide stranded vessels out of the strait. While the Pentagon initially reported success in clearing a path, the operation saw immediate escalation, with U.S. forces destroying six Iranian small boats and intercepting cruise missiles. Within twenty-four hours of its launch, President Trump paused “Project Freedom” to allow for further peace talks, causing Brent crude prices to dip from $114 to $109 per barrel. The fragility of these negotiations continues to keep the energy premium high across all commodity classes.
5. Equity Market Performance: The Tech-Led Rebound
Despite the geopolitical backdrop, U.S. equity markets staged a historic rally in April 2026. The S&P 500 rose 10.5%, and the Nasdaq-100 surged 15.7%, marking its best month in 23 years. This “risk-on” rotation was driven by a powerful combination of oversold conditions and a renewed frenzy surrounding AI, cloud infrastructure, and semiconductors. Leadership was heavily concentrated, with Communication Services (+18.5%) and Information Technology (+17.5%) sectors outperforming all others.
Table 4: U.S. Equity Index and Sector Performance (April 2026)
| Index / Sector | Monthly Return | YTD Return (as of 4/30) | Significance |
| S&P 500 | +10.5% | +5.7% | 13th 10% month in 50 years. |
| Nasdaq-100 | +15.7% | +8.2% | Best performance since Oct 2002. |
| Russell 2000 | +12.3% | N/A | Small-cap tech rebound. |
| SOX (Semiconductors) | +38.0% | +211% (Rolling 12M) | Best month since Feb 2000. |
| Communication Services | +18.5% | Leading Sector | Driven by Mag 7. |
| Technology (XLK) | +17.5% | Second Leading | Data Center/AI Capex. |
| Financials | +5.6% | Solid | Rebound in capital markets activity. |
| Health Care | -0.4% | Lagging | Specific device recalls/regulatory. |
| Energy | -3.5% | Declining | Profit-taking from March highs. |
The semiconductor sector achieved a legendary performance in April, with the PHLX Semiconductor Index (SOX) gaining 38%, more than double any monthly gain in the prior 23 years. This was fueled by extraordinary individual stock performances: Intel (INTC) surged 114.1% in April after shattering earnings expectations and announcing a manufacturing deal for Elon Musk’s “Terafab” AI chip complex in Austin. Advanced Micro Devices (AMD) followed with a 74.3% gain, while ON Semiconductor (ON) rose 62.8%. Memory chip manufacturers also saw parabolic moves, with SanDisk (SNDK) up 72.6% and Micron (MU) up 53.1%, as AI data center demand for high-bandwidth memory reached new peaks.
The strength of the rally was corroborated by massive capital inflows. Technology sector ETFs attracted a record $14.2 billion in monthly inflows. The Invesco QQQ Trust (QQQ) alone pulled in $10.1 billion, its best month of flows on record. Conversely, leveraged equity ETFs saw outflows of $17.1 billion as traders cashed out of high-octane positions following the rapid gains, suggesting a tactical de-risking amidst the volatility.
6. Corporate Earnings: Mag 7 and Market Movers
The Q1 2026 earnings season was one of the strongest in recent years. Blended earnings growth for the S&P 500 tracked at +27.1%, the fastest pace since late 2021. Profit margins remained exceptionally high, with the blended net profit margin for the index reaching 13.4%, the highest level in 15 years. However, the “Magnificent Seven” results revealed a complex narrative where robust revenue growth was often overshadowed by staggering capital expenditure guidance for AI infrastructure.
Table 5: Major Stock Highlights – Q1 2026 Results (April Reporting)
| Company | Result | Market Reaction | Context / Driver |
| Intel (INTC) | EPS $0.29 vs $0.01 est. | +114% (Monthly) | Terafab partnership; massive beat. |
| Apple (AAPL) | $111.2B Revenue | +5% (After-hours) | Record iPhone 17 demand. |
| Alphabet (GOOGL) | Strong Revenue Beat | Surged | Cloud computing division engine. |
| Microsoft (MSFT) | Q3 Strong Growth | Initial Pressure | Aggressive AI data center Capex. |
| Meta (META) | Strong Revenue | Negative | Investors wary of AI spending levels. |
| Amazon (AMZN) | Strong Revenue | Mixed | Cloud growth vs infrastructure costs. |
| J.P. Morgan (JPM) | $50.5B Revenue | Strong | Payments revenue up 12% YoY. |
| Nasdaq (NDAQ) | +14% Net Revenue | Strong | FinTech organic growth at +18%. |
While the tech sector provided the momentum, several high-profile losers highlighted the risks of structural decline or execution failures. Charter Communications (CHTR) tumbled 23.5% in April after reporting the net loss of 120,000 Spectrum Internet customers, a sign of intensifying competition in the broadband space. Tractor Supply (TSCO) fell 22.5% as it missed earnings and sales estimates due to softening discretionary demand and the impact of higher tariffs and transportation costs. Insulet (PODD) dropped 18.0% following an expansion of its Omnipod insulin delivery system recall to a Class I level—the most serious FDA category—following reports of 29 serious injuries.
7. Fixed Income, Commodities, and Forex
The bond market remained a source of tension in April, with the “higher-for-longer” narrative becoming the dominant theme. U.S. Treasury yields building on a sharp bear flattening trend from March, with the 10-year yield ending the month at 4.37%. In the UK, the 10-year Gilt yield rose to over 5.0% for the first time in nearly two decades, as investors weighed the inflationary impact of higher energy prices against a resilient labor market. This environment provided a strong tailwind for the U.S. Dollar, though the DXY index actually declined 1.9% in April as risk appetite returned to global equity markets.
Table 6: Asset Class Returns and Key Benchmarks (April 30, 2026)
| Asset Class | Indicator / Price | Monthly Change | 12-Month / YTD |
| Commodities | Brent Crude Oil | $115.00/bbl | +57% YTD |
| Gold Bullion | $4,617.85/oz | -1.08% (MoM) | |
| Silver Bullion | $73.75/oz | -1.89% (MoM) | |
| Copper | $6.00/lb | Sideways | |
| Fixed Income | US 10-Year Yield | 4.37% | Building on Mar Bear Flat |
| UK 10-Year Yield | 5.01% | 18-Year High | |
| Forex | US Dollar (DXY) | 104 – 105 range | -1.9% (MoM) |
| Digital Assets | Bitcoin (BTC) | $81,000+ | +12.1% (MoM) |
| Ethereum (ETH) | $2,360 | Record ETF Inflows |
In the commodities space, precious metals faced headwinds from rising yields. Gold prices retreated 2.29% across the month, ending at approximately 1,009.82 RMB/g (spot) or $4,617.85 per ounce. This decline was driven by a reversal of the safe-haven trade as peace talks progressed and profit-taking occurred at elevated levels. However, analysts noted that gold and silver began to trade more like high-beta risk assets late in the month, surging alongside equities as oil prices tumbled on peace hopes. Industrial metals like copper traded sideways at $6/lb, as a supply squeeze in sulfuric acid—a byproduct of the Middle East conflict—offset the dampening effects of high rates.
8. Digital Assets: The Convergence of Crypto and Macro
Bitcoin and Ethereum continued their integration into the broader macro-financial framework in April. Bitcoin rose 11.87% for the month, mirroring the 10.42% advance of the S&P 500, which analysts cite as further evidence that crypto is currently behaving as a high-beta risk asset rather than a traditional safe haven. April was the strongest month of the year for U.S. spot Bitcoin ETFs, which recorded net inflows of $1.97 billion. Ethereum also saw a reversal of fortunes, with its ETFs recording $356 million in inflows, ending a prolonged streak of outflows.
Technical levels remain critical, with Bitcoin trading above $81,000 for the first time in three months before facing rejection at its 200-day EMA in early May. Despite short-term pullbacks, the structural demand for digital assets as a “debasement trade” against fiat currency erosion remains a key theme, especially with U.S. government debt and energy-driven inflation remaining elevated. Regulatory developments also provided support, with Virginia enacting new legislation to protect dormant cryptocurrency accounts, a move expected to prevent unintended liquidations.
9. The Political Dimension: Midterms and Affordability
As the U.S. enters the primary season for the November 2026 midterm elections, the political landscape is being reshaped by economic anxiety. “Affordability” has become the central campaign issue, as the cost of living remains the top concern for voters. Household utility costs have risen 41% since 2021, and the median age for first-time home purchases has climbed to 40 years. Republican control of the House is viewed as vulnerable, with Democrats leading in 213 races and 14 of the 17 “toss-up” races featuring Republican incumbents.
Table 7: U.S. Midterm Political and Market Outlook
| Metric | Status / Value | Market Implication |
| House Control | GOP (217) – DEM (213) | Gridlock historically favored. |
| Senate Control | GOP (53) | High hurdle for Democrats to flip. |
| Key Issue | Affordability / Cost of Living | Risks to Pharma/Financial stocks. |
| Approval Rating | 23% on Cost of Living | Headwind for incumbent GOP party. |
| Redistricting | FL/TX Maps Approved | Potential for 4-5 GOP seat gains. |
Political uncertainty is expected to increase market volatility in the second half of the year, a trend consistent with historical midterm patterns where returns often lag in election years before rebounding strongly in the following year. The administration is rolling out targeted measures to reduce credit card interest rates and prescription drug costs to aid consumers, though these initiatives create specific market risks for the financial and pharmaceutical sectors.
10. Global Market Quick-Take: Regional Divergence
Outside of the U.S., equity markets delivered mixed but generally positive results. South Korea’s Kospi Index provided one of the most stunning moves in early May, soaring 6.5% to shatter the 7,000 milestone for the first time. This was led by a 14.4% gain in Samsung Electronics, which pushed its market capitalization above $1 trillion. In Japan, the Nikkei 225 hit fresh record highs, finishing April with a YTD gain of 20.3%, the highest among major indexes.
European markets also rallied, with the Stoxx Europe 600 climbing 2.2% in a single session in early May on peace hopes. Germany’s DAX rose 9% in April, though it remained slightly lower on the year as business confidence indicators, such as the Ifo index, fell to pandemic-era lows. In the UK, the FTSE 100 gained 2.8% in local currency but rose 5.6% in U.S. dollar terms due to sterling strength, even as consumer sentiment hit its lowest level since 2023.
11. Summary and Outlook
April 2026 will be remembered as the month the financial markets successfully decoupled from a localized but severe energy war. The resilience of the U.S. economy, characterized by a transition toward high-tech business investment and a historic surge in semiconductor valuations, allowed equities to ignore the immediate inflationary pressures of the Strait of Hormuz closure. The 10.5% gain in the S&P 500 and the 38% explosion in the SOX index underscore a structural shift in investor sentiment, where the long-term productivity gains from artificial intelligence are being priced in with unprecedented speed.
However, the outlook remains complicated by the transition at the Federal Reserve and the fragility of the U.S.-Iran peace negotiations. With Kevin Warsh poised to take the helm at the central bank, markets are anticipating a shift toward a policy framework that favors productivity-led growth but remains wary of the “higher-for-longer” interest rate environment. The persistence of double-digit energy inflation and the widening gap between producer and consumer prices suggest that the “Oil Shock” is not yet fully neutralized. As the 2026 midterm elections approach, the focus on affordability and the potential for a shift in congressional control will likely introduce a new layer of domestic political risk. For professional investors, the current environment demands a careful balance between riding the AI momentum and hedging against a potential second-round inflationary wave driven by geopolitical instability and a possible policy pivot at the world’s most powerful central bank.
The record-breaking performance of the U.S. markets in April 2026 serves as a testament to the power of secular growth themes to override cyclical geopolitical shocks. While the month saw extreme volatility in energy and individual stocks like Intel and Charter, the aggregate market movement was a resounding vote of confidence in the technological future. As the global community waits for the finalization of a peace agreement in the Middle East, the structural resilience of the global economy appears well-positioned to navigate the remaining uncertainties of the year.
 Our flagship mentoring program is suitable for both beginners and advanced traders, covering the 4 strategies which I used over the past 15 years to build up my 7-figure personal trading portfolio.
 If you're looking for the best trading opportunities every day across various markets, and don't want to spend hours doing the research yourself, check out our private Telegram channel!

Leave a Reply
Want to join the discussion?Feel free to contribute!