

What Is Supercore Inflation? The Services Number That Tells You Where US Rates Are Heading
Want the daily routine? Get the free 15-Minute Swing Trader’s Checklist. Get it free →
By Spencer Li, CFTe · Last updated: 26 October 2026
Supercore inflation is the price change of core services excluding housing, so it covers things like haircuts, medical care, insurance and restaurant meals, with food, energy, goods and rent all taken out. The US Federal Reserve watches it closely because the biggest cost in these services is wages, and wages are something interest rates can actually reach. For a trader, that makes supercore one of the better clues to where US rates go next, and rates sit underneath bonds, the dollar and a large part of the stock market.
When this post first went up in February 2023, the Fed had just raised rates again, and “supercore” was suddenly the word every economist on TV wanted to say. In September 2026 the Fed raised rates again, so the word is back.
Where did the word “supercore” come from?
On 30 November 2022, Jerome Powell, who chaired the Fed at the time, gave a talk at the Brookings Institution in Washington called Inflation and the Labor Market. Inflation was running hot at the time, and he split core inflation into three pieces: core goods, housing services, and what he called “core services other than housing”.
He said this third group covers “a wide range of services from health care and education to haircuts and hospitality”, and makes up more than half of the core PCE index. So it “may be the most important category for understanding the future evolution of core inflation.” Then came the line that explains the whole idea: “Because wages make up the largest cost in delivering these services, the labor market holds the key to understanding inflation in this category.”
Markets took the hint. On 1 February 2023, a week before this post first went up, the Fed raised its target range for the federal funds rate to 4.5% to 4.75%. Traders were reading every services number for signs that the hikes were working.
What is supercore inflation, exactly?
Think of inflation measures as a set of filters, each one taking out a noisier piece of the basket.
| Measure | What it keeps | What it takes out |
|---|---|---|
| Headline inflation | Everything people buy | Nothing |
| Core inflation | Everything except food and energy | Food, energy |
| Supercore inflation | Core services only, minus housing | Food, energy, goods, housing |
Food and energy come out of core because they swing with the weather and the oil price. Housing comes out of supercore for a different reason. The rents in the index catch up slowly, as old leases turn over at new prices, so housing tends to tell you more about last year’s market than this month’s.
What is left is a long list of services where the main input is people. A haircut is mostly the barber’s time, and a dental check-up is mostly the dentist’s. So when supercore runs hot, it usually means pay is rising faster than prices can absorb, and businesses are passing it on to customers.
How is supercore calculated?
Supercore has one slightly annoying feature for anyone who wants a single number. Nobody publishes it as one headline figure, so you have to work it out.
The Fed’s own version uses the Personal Consumption Expenditures price index, or PCE, which the Bureau of Economic Analysis publishes every month in its Personal Income and Outlays report. You start with core services and take housing out.
You can build a CPI version from the Bureau of Labor Statistics’ monthly inflation report in the same way. Take services excluding energy services, then remove shelter. I will show you with the latest numbers, from the September 2026 CPI report released on 14 October 2026:
- Services excluding energy services rose 3.1% over the 12 months.
- Shelter, the biggest piece inside it, rose 3.2%.
If the whole group rose 3.1% and its largest part rose 3.2%, the rest of the group had to rise a little less than 3.1%, whatever the exact weights are. So supercore on the CPI measure was running at roughly 3% a year in September 2026, which is still well above the Fed’s 2% target.
Do note that each bank picks its own index and weights, so readings differ by a few decimals, but the direction usually agrees, and the direction is what you care about.
If you would rather spend 15 minutes a day on the charts than an evening on inflation tables, my free 15-minute swing trader checklist is the routine I use myself.
Why does the Fed watch services and not goods?
Picture a thermostat that measures the temperature in the kitchen while the heater sits in the bedroom. It would keep switching on and off for reasons that have nothing to do with the room it heats. Any system that steers by feedback has to measure the thing its own lever can actually move, and that is a fair way to understand why supercore exists.
The Fed’s lever is the interest rate. Higher rates make borrowing more expensive, so companies hire more slowly, wage growth cools, and the price of labour-heavy services follows, usually with a long lag. Goods prices answer to different forces, like shipping costs, factory output in Asia and the price of oil. The Fed has no lever for any of those.
The September 2026 CPI report shows the problem quite clearly. Over the 12 months to September, headline inflation was 3.7%, while core inflation was 2.6%. The gap came mostly from energy, which rose 20.4%, with gasoline up 34.2%.
A rate hike will not pump more oil. What the Fed can watch is whether an energy shock leaks into wages and services, because that is the part that tends to stick around long after the oil price has calmed down. Supercore is the gauge for that leak.
What has the Fed done with rates since 2023?
In my weekly outlook on 17 December 2025, a week after the Fed had cut rates, I said that “inflation there is a risk that it might come back” in 2026. Rates, jobs and inflation were “kind of a constant like balancing act”. Cutting rates raises inflation, good jobs raise inflation, and bad jobs drag the economy down, so the Fed is always trading one risk for another.
Here is how the rate path has actually played out, taken from the Fed’s own statements:
- 26 July 2023: the last hike of that cycle, to 5.25% to 5.5%.
- September 2024 to December 2025: a run of cuts, ending at 3.5% to 3.75% on 10 December 2025.
- January to July 2026: five meetings, five holds.
- 16 September 2026: a hike of a quarter point, to 3.75% to 4%, the first rise since July 2023. The statement said, simply, “Inflation remains elevated.”
So the same Fed that spent 2025 cutting is raising again, and that is exactly the kind of turn where services inflation starts to matter more than the headline. If energy stays high and supercore starts climbing with it, the market will price in more hikes. If supercore stays near where it is while oil cools, the case for further hikes gets weaker.
The next two dates on the calendar are the Fed’s meeting on 27 and 28 October 2026, and the October CPI report on 10 November 2026.
How do traders read a supercore number?
The number itself is rarely what moves the market. What moves it is the surprise, which means how far the reading lands from what economists expected. I explain how that works in my post on the US jobs report, and inflation works the same way.
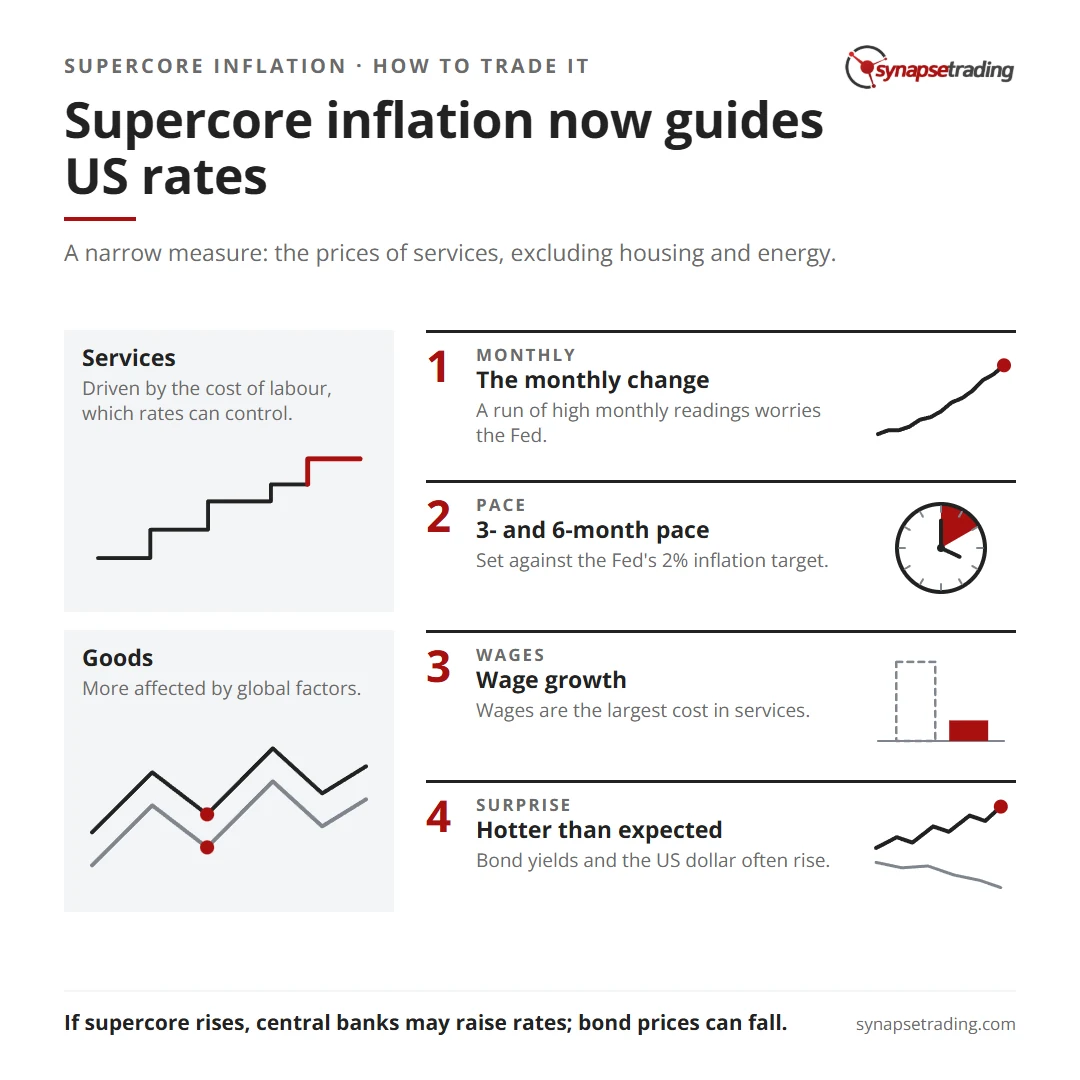
When the CPI or PCE report comes out, these are the parts of supercore that traders usually check:
- The monthly change. One hot month can be noise. Three in a row starts to worry the Fed.
- The 3-month and 6-month pace, turned into an annual rate. They catch a turn sooner than the 12-month figure, and they get compared with the 2% target.
- The 12-month rate. It is slow, but it tells you how far services inflation still is from target.
- Wage growth. Average hourly earnings, from the jobs report, and the Employment Cost Index often hint at where supercore goes next.
The reaction then runs through rates into everything else.
| What the data shows | What it says about rates | The usual first reaction |
|---|---|---|
| Hotter than expected | Higher for longer, maybe another hike | Bond yields and the US dollar rise, rate-sensitive stocks fall |
| Cooler than expected | Less pressure to hike, cuts back on the table | Yields and the dollar fall, stocks often rise |
How a move in yields spreads into the dollar, gold and stocks is in my guide to intermarket analysis.
Should you trade the inflation release itself?
On 26 September 2026, a trader on Reddit’s r/swingtrading said they could understand a CPI print, but “turning that into an actual position is where I keep falling over.”
That is a fair complaint, and I think the honest answer is that you are not supposed to turn the print into a position. The data gives you the backdrop. It does not give you the trade.
In the first few minutes after an inflation report, spreads widen and prices often jump one way and then reverse. Plenty of stops get hit on both sides of the same candle. As a swing trader, I would rather let the release pass, see which way the market settles over the next few days, and only then look for setups that agree with it.
The market itself also has a habit of ignoring the story. In my outlook on 14 May 2026, I pointed out that the “cpi wasn’t that good”, the jobs data also wasn’t that good, “but somehow you know the market just continues climbing”. If you had sold everything on that inflation report, you would have been right about the data and wrong about the price, and only the price pays.
I should also concede the limit of supercore itself. On the CPI measure, core inflation rose only 2.4% in the 12 months to August 2026, which looks fairly calm, and the Fed still raised rates on 16 September 2026. No single inflation number would have told you that decision in advance, supercore included. It tells you which way the pressure leans, and the Fed weighs it with everything else.
So personally, I treat supercore as context. It tells me what the market is likely to be afraid of that month, and the chart tells me what the market is actually doing about it. If you want a routine that keeps those two jobs apart, my free 15-minute swing trader checklist is the one I run every day.
FAQ
What is supercore inflation in simple terms?
It is the price change of services such as haircuts, medical care and insurance, with food, energy, goods and housing taken out. It isolates the part of inflation that is driven mainly by wages.
What is the difference between core and supercore inflation?
Core inflation removes food and energy. Supercore goes further and keeps only core services, minus housing, so it is narrower and usually slower to change.
Is supercore an official number?
It is not published as one line. You work it out from the PCE data of the Bureau of Economic Analysis or the CPI data of the Bureau of Labor Statistics, so analysts get slightly different readings.
When is the next CPI report?
The Bureau of Labor Statistics is due to publish the October 2026 CPI report on 10 November 2026 at 8:30am New York time, which is 9:30pm in Singapore.
What was supercore inflation in 2026?
On the CPI measure, roughly 3% over the 12 months to September 2026, worked out from services excluding energy at 3.1% and shelter at 3.2% in the BLS report of 14 October 2026.
How should a swing trader use supercore inflation?
As a read on the direction of interest rates, with the trade itself coming from the chart once the first reaction has settled.
Do you check the services numbers when the CPI report comes out, or only the headline? And has an inflation report ever moved the market the opposite way from what you expected? Let me know in the comments.
If you want the basics of the report that supercore comes from, start with my post on what the CPI is. The rest of the macro calendar, and how it fits into a trading routine, is in my free trading guides.
And if you want a routine that does not need you awake for every US data release, grab the free 15-minute swing trader checklist.
About the author. Spencer Li is The 15-Minute Trader and the founder of Synapse Trading. He is a Certified Financial Technician (CFTe) with 15+ years of trading, run from 70+ countries. He holds a B.Acc and B.BM from SMU. Every trade he takes is public, dated, losses left in. He teaches rules-based swing trading in 15 minutes a day, one system for any market.
Education, not financial advice. Synapse Trading is not licensed by MAS to advise on investment products. Trading carries risk of loss, and past performance is not indicative of future results.
Want the daily routine? Enter your email for the free 15-Minute Swing Trader's Checklist.
Free 5-page PDF, then occasional trading emails. Education only, not financial advice. Unsubscribe anytime. Kit stores your email in the US: see our privacy policy.
Want to learn the full method? The Trading Mastery Program teaches the 4 strategies I have traded since 2011. It suits beginners and experienced traders.
Rather follow the trades as they happen? Daily Trading Signals is our Telegram channel: my trade ideas with entry, stop and exit, and every trade is public.
Questions about this post? Ask in the free Telegram channel →
Educational content only, not personalised financial advice. Trading carries risk, including loss of capital. Past performance is not indicative of future results. Synapse Trading is not licensed or regulated by MAS.

