

How to Trade Using the Forex Currency Strength Meter to Pick a Better Pair
Want the daily routine? Get the free 15-Minute Swing Trader’s Checklist. Get it free →
By Spencer Li, CFTe · Last updated: 16 October 2026
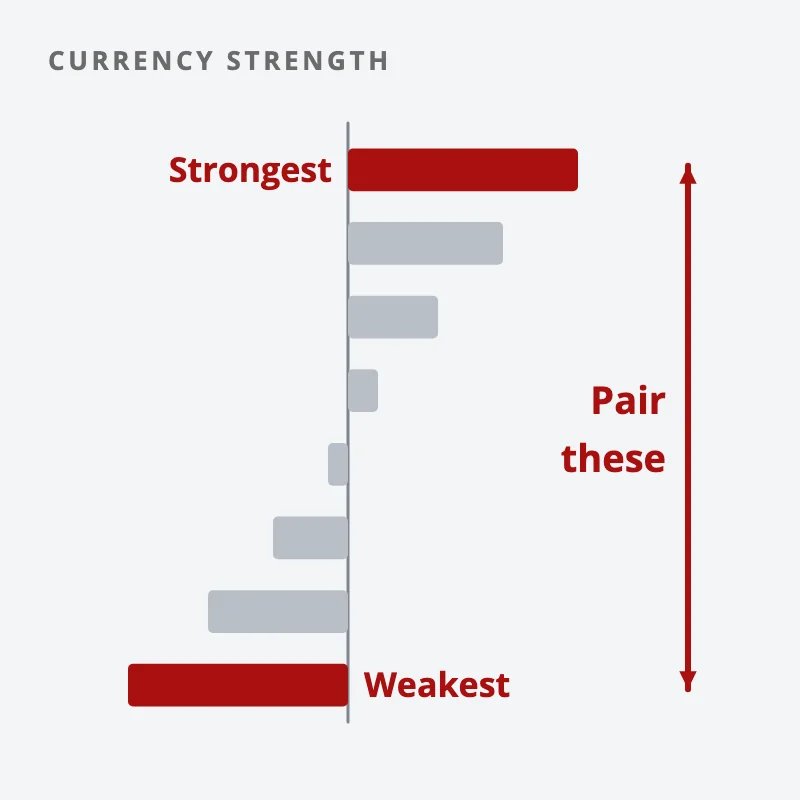
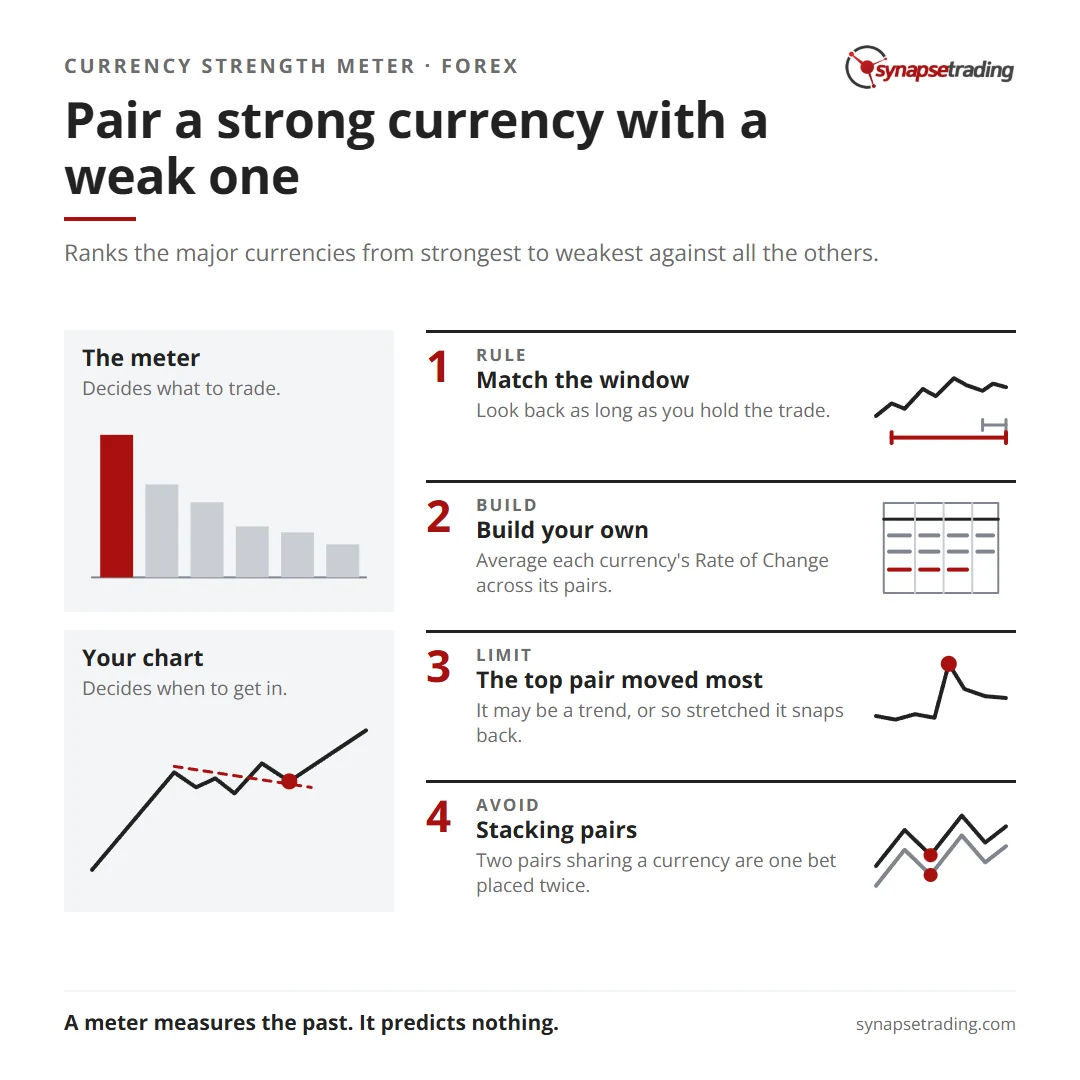
A forex currency strength meter is a tool that ranks the major currencies from strongest to weakest by how each one has moved against all the others over a set window. Most meters do this for the eight majors, across the 28 pairs they form between them. You use it to decide what to trade, by pairing a currency near the top against one near the bottom, and then you go to your own chart to decide when to get in.
Most people get the window wrong. A 24-hour meter and a three-week swing trade answer two different questions, and mixing them up causes most of the frustration with these tools.
I should be upfront about where I stand. I trade mostly stocks and commodities, and as at June 2026, only 8 of the 450 closed trades in my trade log since April 2024 were forex pairs. But the first chart in my weekly market outlook is the US dollar index, which is really a strength meter for one currency.
Why is more than half of the dollar index the euro?
The US dollar index, the DXY you see on financial news, was first built by the Federal Reserve in 1973. Today it is run by ICE Futures U.S., and its basket holds just six currencies: the euro, yen, pound, Canadian dollar, Swedish krona and Swiss franc.
They do not count equally. The euro alone carries 57.6% of the weight, and ICE says the index has been adjusted only once, when the euro arrived.
So when a news anchor says “the dollar is strong”, the DXY is mostly telling you the dollar is strong against the euro. The Australian and New Zealand dollars are left out. The yen counts for less than a quarter of what the euro does. For a number that moves gold, stocks and bonds, it is a surprisingly lopsided one.
A strength meter tries to fix that. It compares every major currency with every other one and gives each a score on the same scale.
How does a currency strength meter actually work?
Every forex price is a ratio of two currencies, so how can you measure the strength of just one? When EUR/USD rises, that chart alone cannot tell you whether the euro got stronger or the dollar got weaker.
The answer is to look at the same currency in every pair it trades in. Each of the eight majors appears in seven pairs, which is where the 28 comes from. If the euro rose against all seven of its partners, that is euro strength, but if it only rose against the dollar, the move is probably about the dollar rather than the euro.
The two vendor pages I checked describe the same basic recipe. currencystrengthmeter.org matches each currency with all of its pairs, scores it in each and averages the scores. LiveCharts.co.uk takes readings from every pair over the last 24 hours and uses the average gain or loss for each currency. currencystrengthmeter.org adds that simple meters do not weight the pairs, while more advanced ones, its own included, apply weighting factors.
Do note that both look back over the last 24 hours. That suits a day trader. If you hold trades for a week or more, you need a longer window, and the easiest way to get one is to build the meter yourself.
How do you build a currency strength meter without coding?
All you need is a spreadsheet and the Rate of Change, an indicator that measures how far a price has moved, in percent, over a set number of bars.
Choose a window that matches how long you hold a trade, take the Rate of Change of each pair over that window, and then average each currency’s numbers across every pair it appears in.
There is one twist the quick guides tend to skip. When the currency is first in the pair, you use the number as it is. When it is second, you flip the sign, because EUR/USD rising 1% means the dollar fell against the euro.
Let me show you with three currencies and made-up round numbers. Suppose that over your window:
- EUR/USD rose 1.0%
- USD/JPY fell 0.5%
- EUR/JPY rose 0.5%
The euro is first in both of its pairs, so its score is the average of +1.0 and +0.5, which is +0.75. The dollar is second in EUR/USD and first in USD/JPY, so its numbers are −1.0 and −0.5, an average of −0.75. The yen is second in both, so its numbers flip to +0.5 and −0.5, and the average is zero.
So the ranking is euro, yen, dollar. It points you to EUR/USD. With all eight majors you do the same with seven numbers per currency, which is tedious to set up once and quick after that.
Look at the example once more. The pair at the top, strongest against weakest, is also the pair that moved the most. That happens by construction, because the gap between any two scores grows with the move in their shared pair, and it matters in a moment.
A meter you built is one small habit, and habits stick better inside a routine. The free 15-minute swing trader checklist is the daily routine I use myself.
What does a strong currency against a weak one give you?
On 18 March 2026, I recorded my weekly outlook while the dollar index had been climbing since January, with money running into the dollar as a safe haven. Yet USD/SGD was drifting lower. So the Singapore dollar was stronger still, strong enough to gain on a dollar that was gaining on most other things.
That is currency strength in one chart. Strong only means stronger than the others in the window you chose.
The textbook use is to pair the strongest currency against the weakest, which currencystrengthmeter.org says gives you the most robust trend. The vendors split on the quieter pairs. currencystrengthmeter.org suggests range traders look at pairs with only a slight difference in strength, while LiveCharts.co.uk says pairs of similar strength often go sideways and are worth staying away from.
Personally, I use it the trend way. A swing trade in my own system is usually a pullback inside a strong trend, so I want a pair that is already trending, then a calm entry on my own chart. Two currencies of equal strength give me a pair with no particular reason to go anywhere.
Why does the meter sometimes disagree with the chart?
On 15 September 2020, a trader on Reddit’s r/Forex described a meter showing the euro strong and the dollar weak while EUR/USD was falling. They asked a fair question: “are strength meters not a good tool to use?”
On a simple meter that weights its pairs equally, that cannot happen inside one window. The gap between the euro’s score and the dollar’s score moves with EUR/USD itself, so if the euro scores higher, EUR/USD rose over the meter’s window. Weighting only bends that a little.
So when the two disagree, they are almost always looking at different windows. Imagine a 24-hour meter next to a daily chart in a downtrend of several weeks, where the euro can simply be having a good day inside a bad month, which is the retracement the trader suspected.
But they were right to be suspicious, and there is a limit I should be honest about. When I read both vendor pages on 2 October 2026, each described a meter that measures the past, and neither claimed to predict anything. And because the top pair is by construction the one that has already moved the most, the meter always points you at the move that is furthest along. Sometimes that is a trend with plenty left in it. Sometimes it is a pair so stretched that it snaps back the week you buy it, and the meter cannot tell you which.
Which mistakes cost traders money with a currency strength meter?
Say the dollar sits at the bottom of the meter, so you buy EUR/USD and GBP/USD. It feels like two trades, but it is one bet against the dollar placed twice, so if the dollar turns, both lose together and the account takes double the hit you planned for.
| Mistake | What goes wrong | Do this instead |
|---|---|---|
| Using the meter to time entries | It shows what has moved, and nothing about when to enter | Pick the pair with the meter, time the entry on your chart |
| Reading a 24-hour meter for a trade that lasts weeks | The ranking flips daily and you chase noise | Match the window to how long you hold |
| Stacking pairs that share a currency | One bet placed twice | Count your exposure by currency |
| Buying EUR/USD and USD/CHF together | One is short the dollar, the other long it | Check both sides of every pair before adding |
| Trusting a meter you cannot see inside | Two meters with different formulas can disagree | Know its window and weighting, or build your own |
Most of these mistakes come from the fear of missing a move, and a meter makes that fear worse, because the strongest pair is always sitting at the top of the screen looking like a sure thing. Waiting for an entry that keeps the loss small is where a routine helps, and the free 15-minute swing trader checklist is the one I run every day.
How do I use currency strength if I mostly trade stocks?
This is how most of my own use looks. I barely trade forex pairs, but I check the dollar every week, because it spills into almost everything else I trade.
In my outlook on 18 March 2026, I said a strong dollar is generally bad news for gold, and I pointed out a somewhat inverse relationship between the dollar index and the S&P 500 ETF. Stocks were falling as the dollar rose. On 2 April 2026, with the dollar still holding up quite strong, I read it as money flocking to a safe haven, usually a bearish sign for stocks.
Hence, I treat the dollar as context rather than a trigger. It tells me whether the wind is at my back before I buy a stock or a commodity, and the entry still comes from that chart. I have no idea whether the relationship holds next year. But it costs one chart and a minute to check.
Big scheduled news can swing the dollar in a minute too, which I cover in what NFP means for traders.
FAQ
What is a forex currency strength meter?
It is a tool that ranks the major currencies from strongest to weakest by averaging how each one moved against the others over a set window. Most cover the eight majors and the 28 pairs between them.
How is currency strength calculated?
For each currency, the meter takes its percentage move in every pair it trades in, flips the sign when the currency is second in the pair, and averages the results. Some meters also weight the pairs.
What is the best timeframe for a currency strength meter?
The one that matches how long you hold a trade. Many free meters look back 24 hours, which suits day traders. If you hold for weeks, use a longer window.
Can a currency strength meter tell me when to enter a trade?
No. It tells you which currencies have been strong or weak, which helps you choose the pair. The entry still comes from your own chart.
Is the dollar index the same as a currency strength meter?
It is close, but it covers one currency. The DXY measures the US dollar against six currencies, with the euro at 57.6% of the weight, while a strength meter scores all eight majors on the same scale.
Do you use a strength meter, a dollar chart, or neither? Has a ranking ever pointed you at a pair that had already done its move? Let me know in the comments.
For the bigger picture, read The Ultimate Guide to Forex Trading, and the rest of my free trading guides are all in one place.
And if you want a routine that picks the pair and the entry in a few minutes a day, grab the free 15-minute swing trader checklist.
About the author. Spencer Li is The 15-Minute Trader and the founder of Synapse Trading. He is a Certified Financial Technician (CFTe) with 15+ years of trading, run from 70+ countries. He holds a B.Acc and B.BM from SMU. Every trade he takes is public, dated, losses left in. He teaches low-risk swing trading in 15 minutes a day, one system for any market.
Education, not financial advice. Synapse Trading is not licensed by MAS to advise on investment products. Trading carries risk of loss, and past performance is not indicative of future results.
Want the daily routine? Enter your email for the free 15-Minute Swing Trader's Checklist.
Free 5-page PDF, then occasional trading emails. Education only, not financial advice. Unsubscribe anytime. Kit stores your email in the US: see our privacy policy.
Want to learn the full method? The Trading Mastery Program teaches the 4 strategies I have traded since 2011. It suits beginners and experienced traders.
Rather follow the trades as they happen? Daily Trading Signals is our Telegram channel: my trade ideas with entry, stop and exit, and every trade is public.
Questions about this post? Ask in the free Telegram channel →
Educational content only, not personalised financial advice. Trading carries risk, including loss of capital. Past performance is not indicative of future results. Synapse Trading is not licensed or regulated by MAS.

