
Why Do Professional Traders Use Price Action? 3 Reasons to Read the Chart Itself
Want the daily routine? Get the free 15-Minute Swing Trader’s Checklist. Get it free →
By Spencer Li, CFTe · Last updated: 26 October 2026
Price action trading means reading the price chart itself, the candles, the swings and the levels, and making your decisions from that, rather than from formulas stacked on top of price. The professional traders who have written down why they work this way, such as Al Brooks and Bob Volman, keep coming back to three reasons. A clean chart is clearer to read, quicker to act on, and the same skill works on any market that has a price chart. I know of no survey that counts how many professionals trade like this, so this post sticks to the ones who said so in print, and to my own charts.
What is price action trading?
Al Brooks used to be an eye surgeon. He left medicine to day trade full-time, and by his own account it took him more than 10 years to become consistently profitable, with over 10,000 hours of that spent writing and testing indicators and systems. In his 2009 book Reading Price Charts Bar by Bar, he gave his verdict on all that work: “nothing had to be added. In fact, any additions are distractions that result in lower profitability.”
That is an expensive way to arrive at a blank chart, and it explains the term quite well.
An indicator, as the authors of Naked Forex define it, is “a metric derived from price data”. You feed the opens, highs, lows and closes into a formula, and it draws a line. So every indicator is price, run through a blender. Price action skips the blender and reads the ingredients, which means looking at where buyers stepped in, where sellers took over, and how hard each side pushed.
Do note that “no indicators” rarely means none at all. Brooks keeps a single moving average on his chart, and so does Volman. I keep a moving average or two myself. The point is that the chart does the talking, and the lines sit in the background as a reference.
What kinds of trading does price action help with?
When I first wrote this post in 2019, I sorted most trading strategies into three groups. I still find the split useful, because each group asks the chart a different question, and price action is how you get the answer.
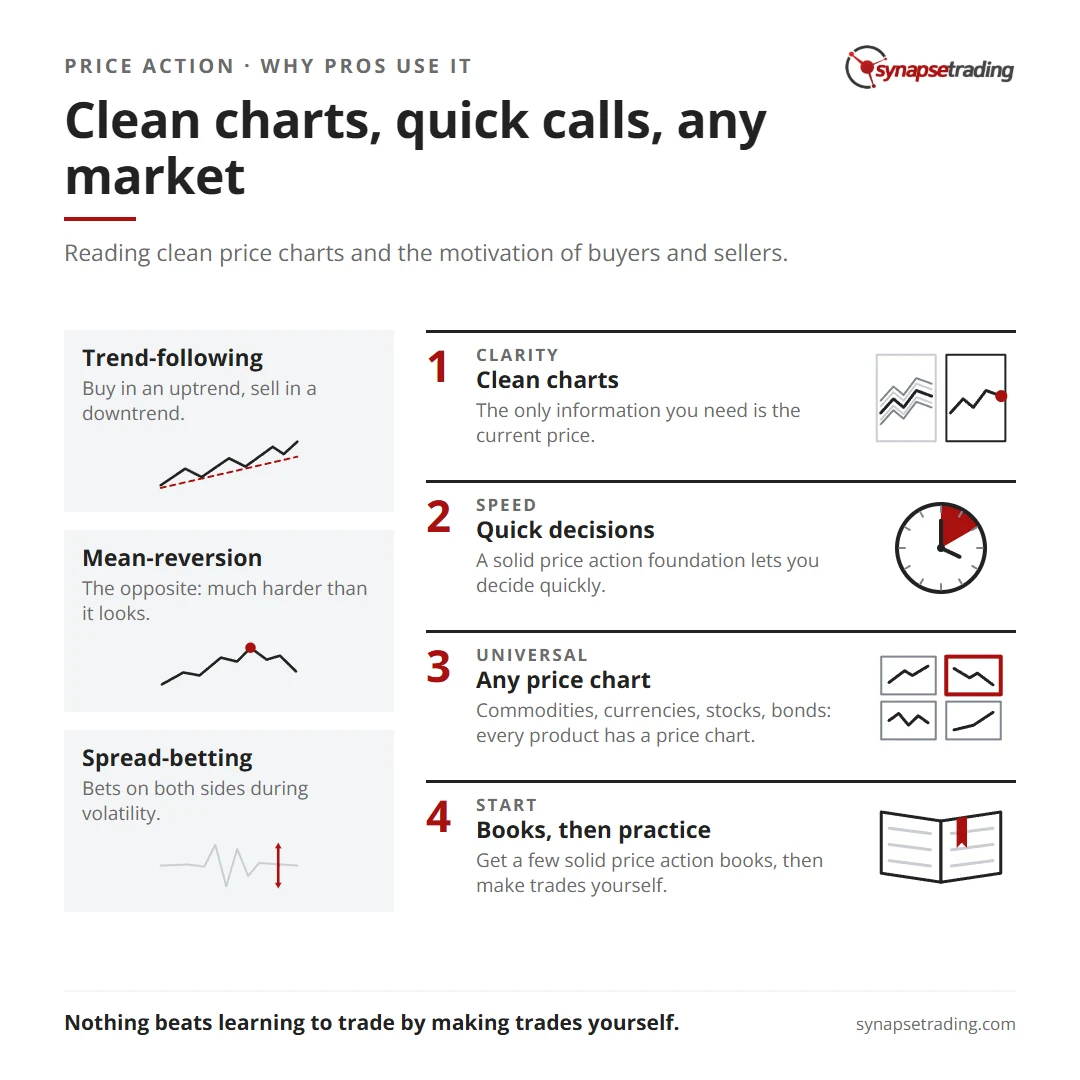
1. Trend-following
Most beginners ask the chart two questions, which are when to buy and when to sell. A trend-follower, who buys in an uptrend and sells in a downtrend, has to answer several harder ones first.
- Whether the trend has started, and when.
- When it might end.
- Where to get in.
- Whether it is a volatile trend or a gentle one.
- Whether it is strong or weak.
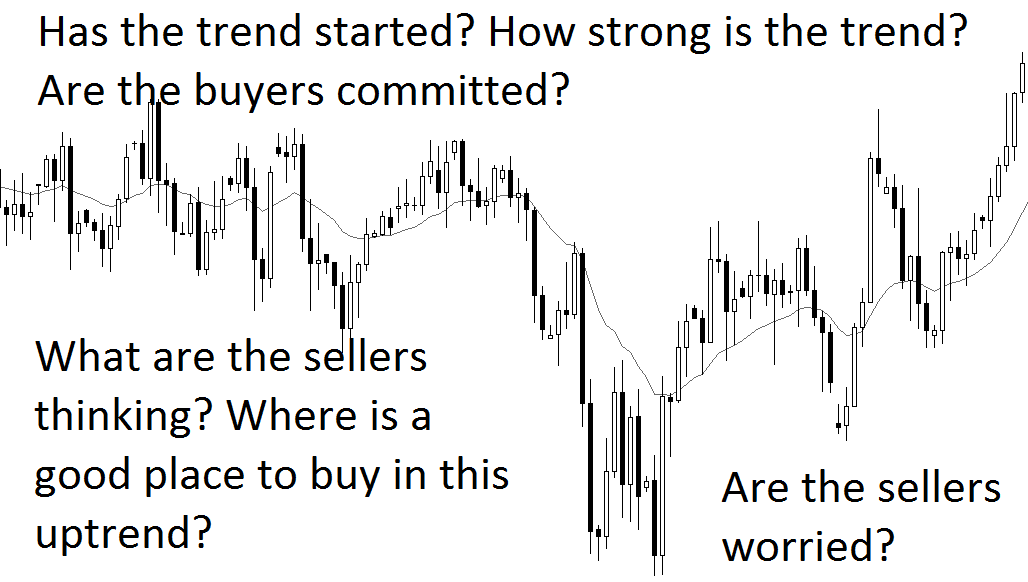
None of these can be predicted. But the better you can answer them as the market unfolds, the better placed you are. Every one of those questions is about what buyers and sellers are doing, and a clean chart shows you that directly.
2. Mean-reversion
Mean-reversion is the mirror image. Instead of joining a trend, you bet that it is running out of road, so the questions turn around. Now you want to know whether the trend has ended, whether traders are taking profits or opening new positions, and which price levels the other side is watching.
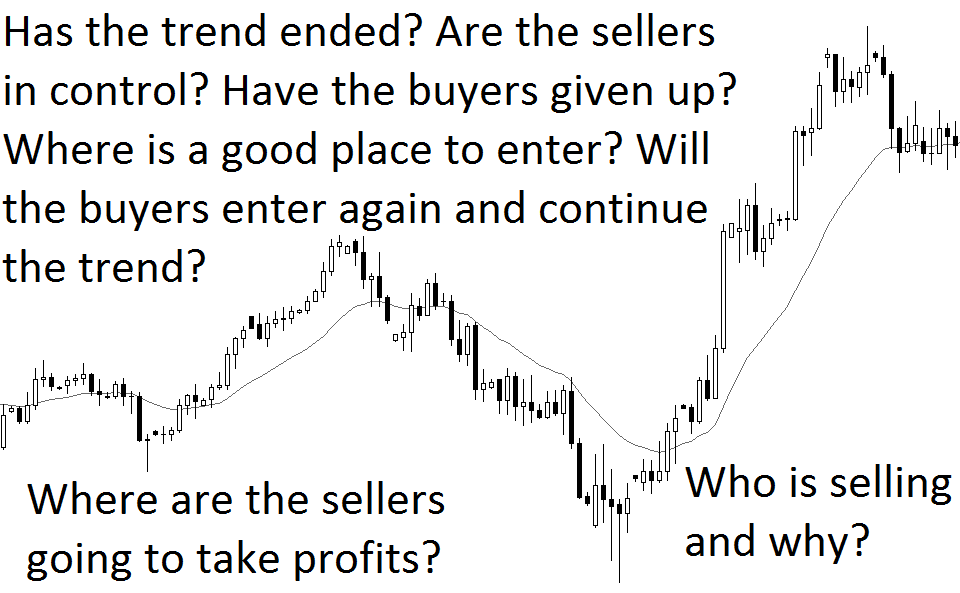
Personally, I think beginners should leave this alone until they can follow trends with some success. Trading against a trend is much harder than it looks, especially in a bull market. I would much rather wait for the trend to change direction first, and then join the new trend, which is a calmer trade than standing in front of the old one.
It also helps to remember who you are trading against. Al Brooks argues that the great majority of volume in big markets comes from institutions, so there is usually a well-funded professional on the other side of your trade. If that thought makes you slightly nervous, good. It should.
3. Volatility trading
In 2019 I called this third group spread-betting, which was a confusing label, because spread betting is also the name of a retail product in the UK. What I meant was placing short-term bets on both sides of a violent move. It needs fast, expensive execution and a great deal of discipline, which makes it a poor fit for someone trading after work. I will leave it there, so that you at least know which game you are not playing. If you trade after work too, my free 15-minute swing trader checklist is the daily routine I use myself.
Reason 1: Why is a clean chart easier to read?
In my weekly outlook on 9 October 2025, I told viewers I had decided to close my Magnificent Seven position. When I looked at the seven stocks one by one, I did not find that all of them were great. On Tesla, I said, “the price action doesn’t look that strong to me”. Nvidia, Microsoft and Google looked strong. Meta had fallen below its support level.
Same group of stocks, same week, same news, and seven quite different charts.
That is clarity. The only information you truly need is the current price, laid out as candles, and once the clutter is gone you can see who is in control. Put a blank chart next to one buried under five indicators and you will see what I mean.


The Naked Forex authors make a sharper point about the cluttered version. They say indicators “delay the progression of the trader because the focus is on the indicator, rather than price action.” You end up studying the line, and wondering where the line goes next, while the market moves on without you.
Reason 2: Why does price action help you decide faster?
Imagine having to make a trading decision while watching 12 screens at once. The picture below gives you an idea.

Image Source: LifeHacker.com
Speed matters most to an intraday trader, who has to decide while the candle is still forming. Checklists and criteria help, but a solid price action foundation is what lets you make the call quickly, because you are reading one thing rather than reconciling six.
In contrast, I can make my trades on a single laptop, or even on my phone. Something like this is more than enough.

Image Source: MyCompas.com
Brooks, for what it is worth, describes trading one chart on a laptop in a dimly lit room. Fewer screens have never made the decision less serious. They just make it faster, and in my case they let the whole routine fit into about 15 minutes a day.
Reason 3: Why does one skill work on every market?
Perhaps the biggest reason is that price action is universal. Stocks, currencies, commodities, bonds, ETFs, REITs, futures and even options all have a price chart. So the skill carries. Coffee futures and Apple shares run on the same mechanics of buyers and sellers, and you would not have much trouble moving between them.
Price action works on just about anything with a price chart and a liquid secondary marketplace.
Image Source: TheActuary.com
Trading is a bit like ordering at a restaurant with a very long menu. There are hundreds of things you could order, and most regulars settle on a few dishes they know well. Price action lets you pick a few markets and get good at them, and switch when a different one starts moving, without learning a new language each time.
That is also the idea behind teaching one system for any market. An indicator tuned for one product often needs re-tuning for the next. Buyers and sellers behave much the same everywhere.
Can price action be tested?
Here is an uncomfortable fact from statistics. In Evidence-Based Technical Analysis, published in 2007, David Aronson tested 6,402 technical trading rules on the S&P 500. Once he corrected for the fact that he had searched through so many of them, not one survived.
The lesson is about searching. Test enough formulas on the same history and one of them will look brilliant purely by luck, which is why an indicator that was tuned on last year’s data so often falls apart this year.
But Aronson has a second point, and it lands on price action traders. He argues that hand-drawn trend lines and chart patterns, as they are usually practised, cannot be tested at all, because nobody has written them down precisely enough to check. Even Volman concedes it about his own method. In his 2011 book he writes, “There is no scientific evidence to back them up.”
So I will concede the point. A chart read that lives only in someone’s head cannot be proven, and it cannot be improved either. Hence I wrote my own price action method down as a set of rules, so that the same chart gets the same answer every time, and so that I can count how it does. Rules are also easier to keep when they come with a routine, and the free 15-minute swing trader checklist is the one I run.
Is price action too subjective to learn?
On 5 August 2026, a trader on Reddit’s r/Daytrading asked, “Price Action makes no sense. What do I do?” They had been at it for months, and summed it up as “Price Action works… until it doesn’t”.
That is a fair complaint, and I will not pretend otherwise. Price action is slow to learn. Brooks, writing in 2009, said it took him more than 10 years to become consistently profitable. That is a long apprenticeship by any standard.
But the complaint usually comes from asking price action to predict the next candle, which it cannot do. Volman puts the honest version well. The chart “may not tell him where to buy and sell”, but “it will clearly show him when to stay out”. Staying out is a decision too, and it is the one a clean chart makes easiest.
How can you get started with price action?
For a start, I recommend the old-school way. Get your hands on a few solid price action books, many of which are in public libraries, and buy the ones worth rereading.
Next, practise. Reading books and watching others trade is a fine way to learn, but nothing beats placing real trades yourself, small, and keeping a record. Knowing a pattern and trusting it with money on the line are two very different feelings, and only the second one teaches you anything.
And if you run a lot of indicators today and you are not happy with your results, it may be worth asking whether you understand what is behind the lines. A formula can stop working when the market changes. Understanding tends to last longer. My guide to price action trading goes through the foundations.
FAQ
What is price action trading?
It is reading the raw price chart, the candles, swings and support and resistance levels, to judge what buyers and sellers are doing, without relying on indicators drawn on top of price.
Do professional traders use indicators at all?
Some do. Al Brooks and Bob Volman, both full-time price action traders, each keep a single moving average on their charts. The difference is that the chart leads and the average sits in the background.
Is price action better than indicators?
It is more direct, because indicators are calculated from price and lag behind it. Neither one can be proven to work by feel alone, which is why I trade price action from written rules.
Can beginners learn price action?
Yes, though it takes time. Start with trend-following on clean charts, and leave mean-reversion until you can follow trends with some success.
Does price action work on stocks, forex and crypto?
Any market with a price chart and enough buyers and sellers can be read the same way, so the skill carries across stocks, forex, commodities, crypto and more.
How long does it take to learn price action?
Longer than most courses suggest. Brooks said it took him more than 10 years. A written set of rules and a trade record shorten the guessing, though nothing removes the practice.
Which do you lean on more today, the chart or the indicators, and has a clean chart ever told you to stay out of a trade you are glad you skipped? Let me know in the comments.
If you want to see how these three groups map onto the four strategy types I trade, read Break, Swing, Bounce and Turn. The candle patterns behind most price action reads are in my guide to candlestick patterns, and my free trading guides collect the rest.
And if you want a routine that fits your chart reading into 15 minutes a day, grab the free 15-minute swing trader checklist.
About the author. Spencer Li is The 15-Minute Trader and the founder of Synapse Trading. He is a Certified Financial Technician (CFTe) with 15+ years of trading, run from 70+ countries. He holds a B.Acc and B.BM from SMU. Every trade he takes is public, dated, losses left in. He teaches rules-based swing trading in 15 minutes a day, one system for any market.
Education, not financial advice. Synapse Trading is not licensed by MAS to advise on investment products. Trading carries risk of loss, and past performance is not indicative of future results.
Want the daily routine? Enter your email for the free 15-Minute Swing Trader's Checklist.
Free 5-page PDF, then occasional trading emails. Education only, not financial advice. Unsubscribe anytime. Kit stores your email in the US: see our privacy policy.
Want to learn the full method? The Trading Mastery Program teaches the 4 strategies I have traded since 2011. It suits beginners and experienced traders.
Rather follow the trades as they happen? Daily Trading Signals is our Telegram channel: my trade ideas with entry, stop and exit, and every trade is public.
Questions about this post? Ask in the free Telegram channel →
Educational content only, not personalised financial advice. Trading carries risk, including loss of capital. Past performance is not indicative of future results. Synapse Trading is not licensed or regulated by MAS.

