
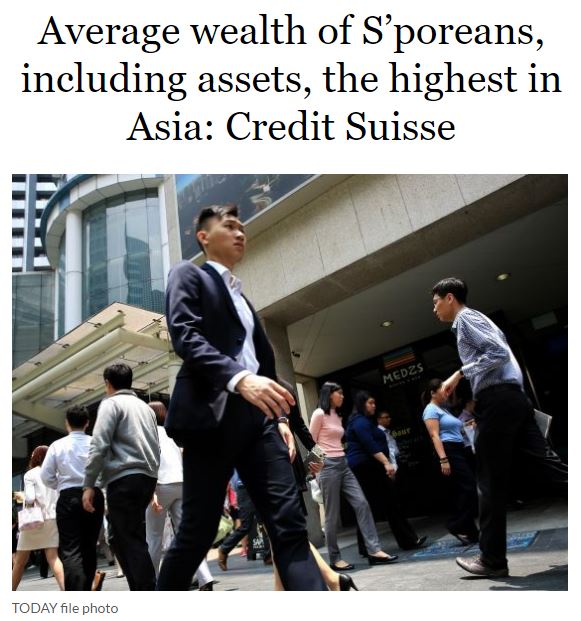
Here’s an interesting article I came across during the weekend: according to a Credit Suisse report, the average wealth of Singaporeans is the highest in Asia.
In the report, it states that the average adult has US$276,885 (S$395,000) in wealth, which is 1.4% higher than last year.
“The Global Wealth Report ranked Singapore number 1 in Asia, and when compared to the major economies, Singapore is ranked number 7.”
 Source: Today Online
This is great news and I’m quite humbled that our tiny nation has managed to achieve this. However, remember that there are two main sources of household assets:
#1: WEALTH FROM FINANCIAL ASSETS
“Financial assets — which include items such as currency, deposits and equities — accounted for more than half of the average wealth per adult in Singapore at US$180,414.”
Wealth from financial assets accounted for >50% of the wealth of a singaporean adult. That means an average Singaporean has $130,000 in cash, foreign currencies, deposits, stocks, and other liquid investments.
Of course, the figure is just an average. I went to Singstat to get a visual of these figures, and here’s what I found: while the growth rates of household assets and liabilities have slowed down dramatically since 2010, net worth continued to climb every single year alongside liabilities!
 The growth rate for assets and liabilities slowed down in the past 6 years.
Source: Singstat
I recommend that you click the image above to expand it. Take a look at the details: liabilities have never exceeded assets, but the growth rates have plummeted severely over the past 5 years. It seems that low growth rates in household net worth is going to be the norm.
The average Singaporean has about S$130,000 in financial assets. Cash, stocks, deposits, and foreign currencies included.
That’s a very good figure to have, because most Singaporeans will be able to tide through a 1-2 year period of retrenchment before having to look for sources of income.
What about the statistics on Non-financial assets?
#2: WEALTH FROM NON-FINANCIAL ASSETS
“Non-financial wealth, including assets such as housing, accounted for US$151,239.”
I wanted to find out if this was accurate, and dug deeper to get the data. I decided to do away with Credit Suisse’s claims and check out the figures reported by the statistics department:
 Most of the wealth is still held in financial assets, rather than in homes.
Source: Singstat
This gives a more accurate figure in my opinion. The data until Q4 2015 reveals that approximately half of every Singaporean adult’s financial wealth came from residential property valuation. The average Singaporean’s wealth in residential property assets could be anywhere from 40-60% of his/her personal wealth.
A casual glance like this might lead you to conclude that Singaporeans are well-protected, wealthy, and financially-savvy.
It is no wonder that even though Singapore has a great number of millionaires as a percentage of population, much of the wealth is held in property. I managed to find statistics on the total assets of Singaporean households, and these are presented in the tables below.
Note: The figures below are in millions of dollars.
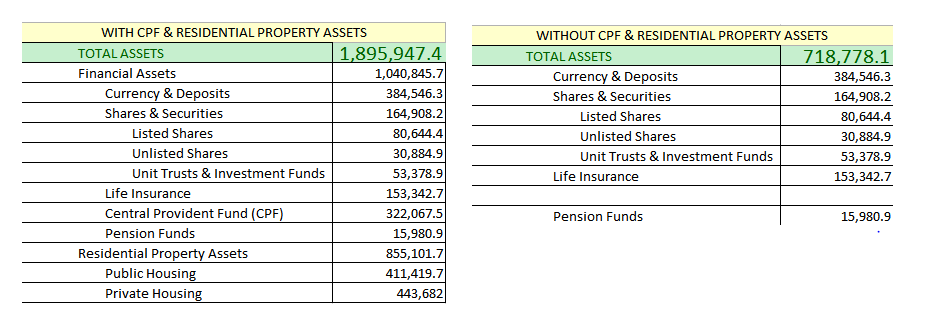 Not counting CPF & Residential Property, Singaporeans have a lot less liquid assets as a percentage of total assets.
Source: Data from Singstat, Chart generated using MS Excel
In essence, the Singapore as a whole without CPF and Residential Property can be almost 65% poorer on average! That means the true amount of liquid capital that our country commands is much lower than the net worth figures reported. Take note that the data is in millions of dollars and represent the whole nation.
SIDENOTE: DEBT
“The average debt was US$54,768, or 17 per cent of total assets, moderate for a high-wealth country, the report said.”
The average debt was “moderate” for a high-wealth country, and I wanted to understand what this meant. To my pleasant surprise I realized we could actually get the data for our CPF, life insurance, pension funds, shares, liabilities classified by category, and many other statistics from our very own statistics department of Singapore.
 With data, in hand, much magic can be performed.
Data Source: Singstat
After downloading their data in XLSX format, I saw that there were several categories for liabilities. They are:
- Mortgage loans – to financial institutions
- Mortgage loans – to Housing and Development Board (HDB)
- Personal loans – motor vehicle
- Personal loans – credit cards
- Personal loans – education loans, renovation loans, hire purchase loans, loans for investments etc.
After putting them in a pie chart, this is what it looks like:
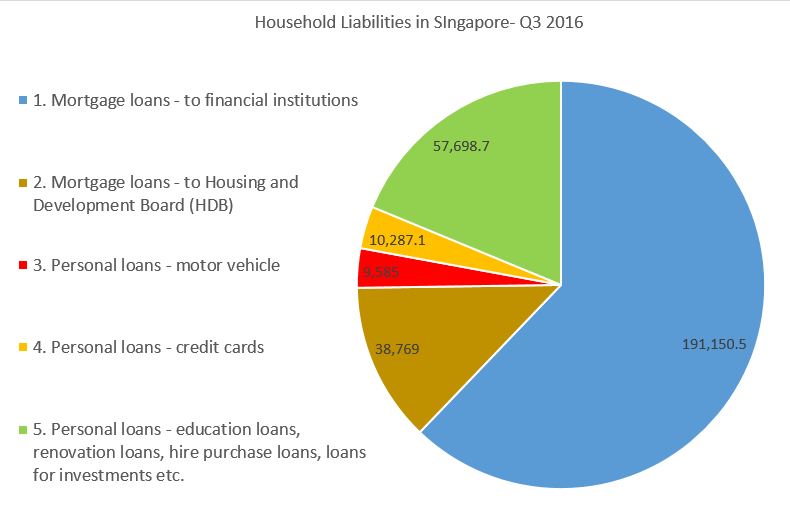 Mortgage loans in both categories take up 75% of liabilities Singaporeans have.
Source: Data from Singstat, Chart generated using MS Excel
It was interesting that much of household assets include residential property, while much of household liabilities also include residential property. It’s understandable that most of the loans would be made with financial institutions since HDB has a fixed loan rate, while the FI’s have variable ones (good news for us in a low interest rate environment).
It is remarkable that credit card loans amounted up to almost the same size as motor vehicle loans!
WHAT ABOUT YOU?
The average adult Singaporean has $130,000 of liquid assets, has 75% of liabilities in housing loans, 19% of liabilities in education/renovation/investment loans, and, unsurprisingly, derives most of his/her wealth from CPF and Residential Property.
What does your balance sheet look like? It’s important to review your own finances periodically and see how they have changed over the years.
Perhaps it’s time for a financial health check-up as we round up and conclude the year 2016. Hope you enjoyed plowing through the numbers like I did!
Cheers!
REFERENCES & RESEARCH SOURCES:
http://www.todayonline.com/business/singaporeans-average-wealth-increases-us277000-credit-suisse-report
http://www.singstat.gov.sg/statistics/browse-by-theme/household-sector-balance-sheet
http://www.singstat.gov.sg/statistics/visualising-data/storyboards/household-sector-balance-sheet
http://www.tablebuilder.singstat.gov.sg/publicfacing/createDataTable.action?refId=1952
Spencer is an avid globetrotter who achieved financial freedom in his 20s, while trading & teaching across 70+ countries. As a former professional trader in private equity and proprietary funds, he has over 15 years of market experience, and has been featured on more than 20 occasions in the media.
