• Link to Facebook
  • Link to X
  • Link to Instagram
  • Link to Youtube
  • Link to LinkedIn
  • Link to Mail
Free PDF: The 15-Minute Swing Trader's Checklist, the daily routine on the record since 2014
Synapse Trading
  • Mentoring
    • Trading Mastery Program
    • All mentoring options
  • Signals
    • Daily trading signals
    • Signals trade log
  • Results
    • Student results and testimonials
    • Public trade log, losses left in
  • Free guides
    • Start here
    • Trading foundations
    • Technical analysis
    • Strategies and systems
    • Risk and money
    • Trading psychology
    • Markets and products
    • Free trading guides
    • Tools and resources
    • Blog
  • About
    • My background
    • My trading journey
    • Media and interviews
    • Travel log
  • Contact
    • Contact me
    • Partnerships
  • Start free
  • Click to open the search input field Click to open the search input field Search
  • Menu Menu
Spencer Li

Trading Performance Metrics: The 5 Numbers That Tell You If a Strategy Works

Risk & Money Management
Five numbers that judge strategies - performance metrics

Sample size, win rate, payoff, profit factor and drawdown, worked through on 20 hypothetical trades

Published: 16 October 2026 · Last updated: 22 September 2026 · By Spencer Li, CFTe


Ask a new trader how their strategy is doing and you will usually get one number back, the win rate. It is the least useful number on the page.

The trading performance metrics that tell you whether a strategy works come as a small set, because each one covers a blind spot in the others. Five do most of the work. Sample size tells you whether there is enough evidence to judge at all. Win rate and payoff ratio (average win divided by average loss) tell you how the strategy makes money. Profit factor (gross profit divided by gross loss) tells you whether it makes money overall. Maximum drawdown tells you how painful the worst stretch was, and whether you could live through it again. Expectancy then rolls the middle three into one figure per trade, which has its own post: Expectancy.

Below, each one is worked through on the same 20 hypothetical trades.
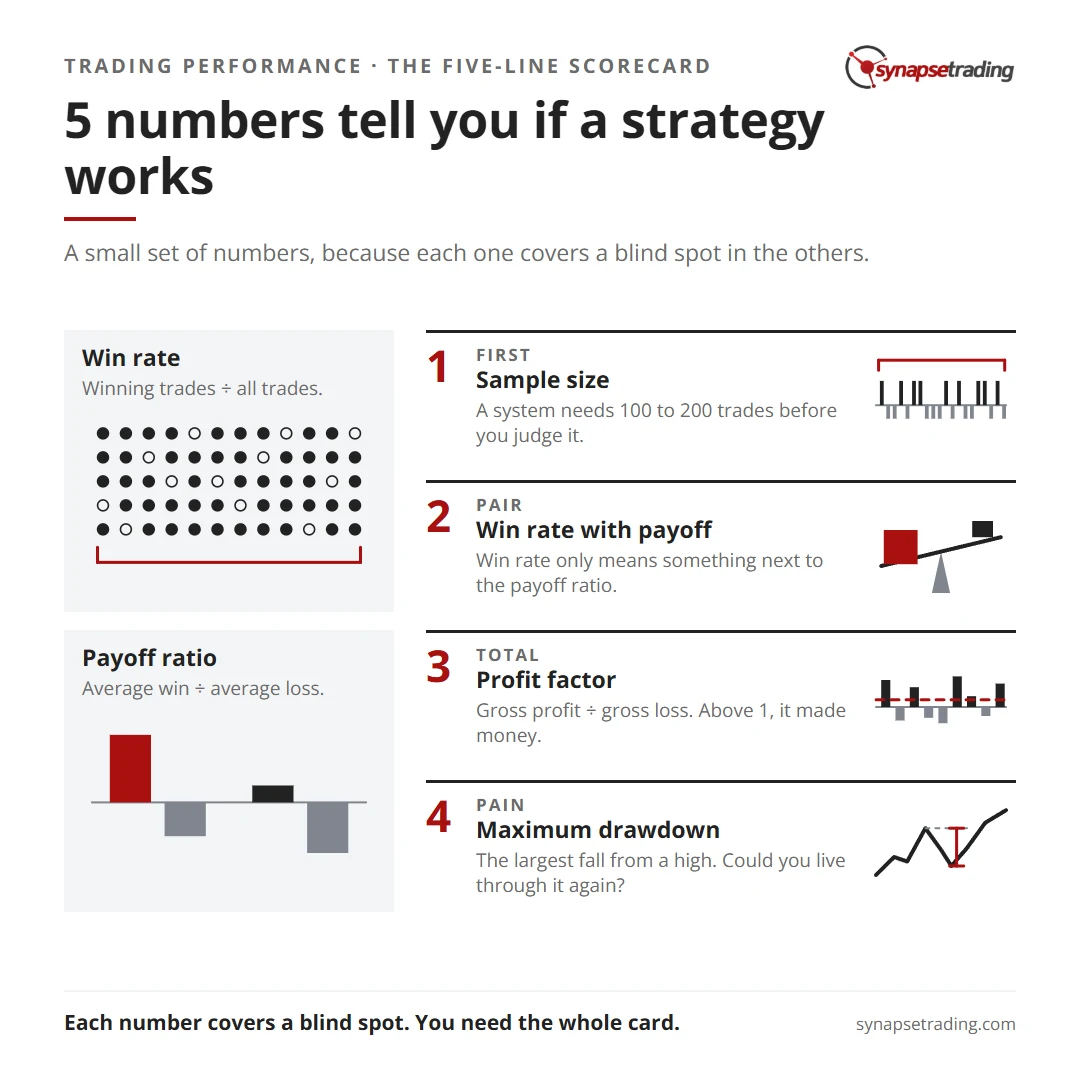
5 numbers tell you if a strategy works. Summary card for the post: Trading Performance Metrics: The 5 Numbers That Tell You If a Strategy Works.

What does the Five-Line Scorecard look like?

I call this set the Five-Line Scorecard, because you can fit it on five lines at the top of a trading journal. Here are 20 made-up trades, measured in R, where 1R is the amount risked on each trade. A win of 2.1R means the trade made 2.1 times what was risked.

LineMetricHow to work it outOur 20 trades
1Sample sizeCount the closed trades20
2Win rateWinning trades ÷ all trades8 ÷ 20 = 40%
3Payoff ratioAverage win ÷ average loss2.23R ÷ 0.95R = 2.34
4Profit factorGross profit ÷ gross loss17.8R ÷ 11.4R = 1.56
5Maximum drawdownLargest fall from a high in the running total2.5R

Net, these trades made 6.4R. Now let me take them apart line by line, because each number says something different.

Why does sample size come first?

Because every other line on the card is noise until there are enough trades behind it.

Twenty trades is far too few. Flip a fair coin 20 times and getting 13 heads would not surprise anyone, so a 65% win rate over 20 trades says very little about the next 200, and even less about whether to put real money behind it. Our rule of thumb is that a system needs 100 to 200 trades before you judge it, and the reasoning behind that number is in How Many Trades Do You Need? The Law of Large Numbers and Sample Size.

So treat the rest of this card as a worked example of the method, rather than a verdict on these trades.

Why is win rate meaningless on its own?

A 40% win rate sounds poor. Yet these 20 trades made money, because the average win was more than twice the average loss. Win rate only means something next to the payoff ratio, which is why lines 2 and 3 sit together.
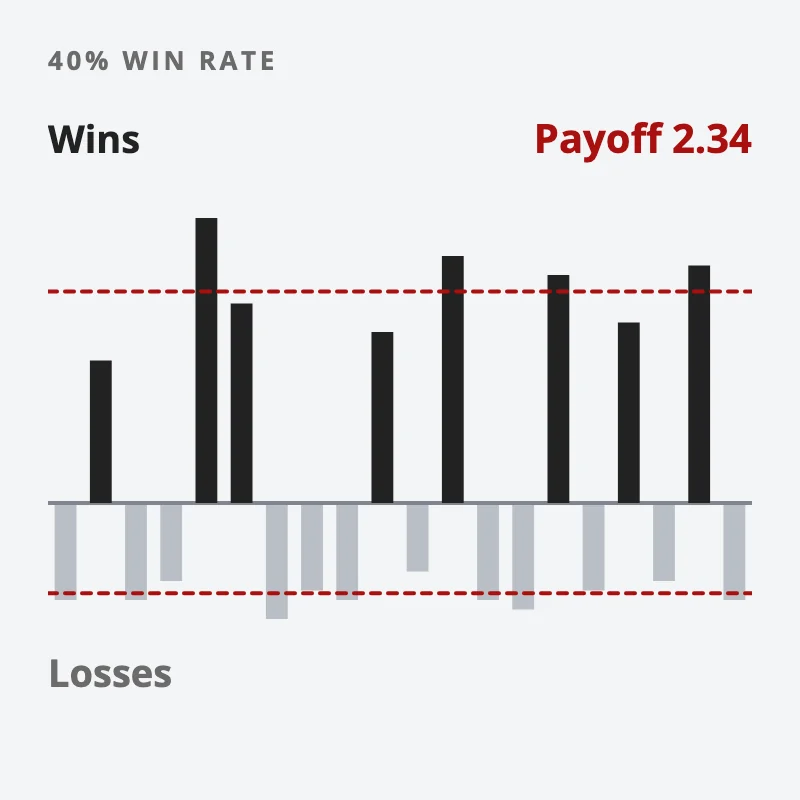
Twenty trades as bars: eight tall wins above the line and twelve short losses below it, with dashed lines at the average win and average loss, payoff ratio 2.34
A 40% win rate can work when the average win is over twice the average loss.

The opposite trap catches more people. A strategy can win 70% of the time and still lose money, if the few losses are large enough. How the two numbers trade off against each other is the subject of Win Rate vs Reward-to-Risk Ratio.

There is also a feeling hidden in the win rate, and it matters more than people expect. The lower it is, the longer the losing runs you have to sit through. I ran a quick simulation of 20,000 sets of 100 trades each:

Win rateTypical longest losing run in 100 trades1 in 10 sets saw a run of at least
60%4 losses in a row6
40%7 losses in a row11
30%10 losses in a row15

A 30% strategy can be perfectly sound and still hand you 10 losses in a row in a normal stretch. If you were not expecting that, loss number 6 or 7 is where the fear starts telling you to quit, and if you listen, you never find out whether the strategy was working. Knowing the number in advance is what lets you keep going.

What is a profit factor, and what is a good one?

Profit factor is gross profit divided by gross loss. Add up every winning trade, add up every losing trade, and divide the first by the second. Above 1, the strategy made money over the period. Below 1, it lost.

Our 20 trades made 17.8R on the winners and lost 11.4R on the losers, for a profit factor of 1.56. Put another way, they made about 1.56 for every 1 they lost.

But a profit factor on its own can mislead. Take 2 hypothetical strategies over 10 trades each:

StrategyWin rateWin sizeLoss sizeProfit factorAverage result per trade
A60%1R1R1.50+0.2R
B30%3R1R1.29+0.2R

Strategy A has the better profit factor. Both make exactly the same 0.2R per trade on average, which is the figure expectancy measures. And B, with its 30% win rate, will put you through far longer losing runs to earn it. So profit factor tells you whether a strategy makes money, while expectancy tells you how much per trade, and neither tells you how it will feel. You need the whole card.

If you want a routine that records these numbers as you go, our free 15-Minute Swing Trader’s Checklist includes the weekly review. Get the free checklist →

What is maximum drawdown, and why does it decide whether you survive?

Maximum drawdown is the largest fall from a peak in your account, or in your running total of R, to the lowest point before a new peak. In our 20 trades, the running total once dropped 2.5R from its high before recovering.

It is the most honest number on the card, because it answers the question every trader eventually faces: how bad can this get, and can I live with it? A strategy with a fine profit factor and a 40% drawdown asks you to watch 40% of your account disappear before it comes good, and quitting near the bottom is what turns a sound strategy into a real loss.

Drawdowns also cost more to climb out of than they cost to fall into. A 20% fall needs a 25% gain to get back to where you were. A 50% fall needs 100%. So keeping the drawdown small does more for long-run results than squeezing a little extra out of the winners.

Drawdown tells you about the worst stretch. If you want one number for how bumpy the whole ride was, compared with what it earned, that is what risk-adjusted ratios do, covered in Sharpe and Sortino Ratios Explained.

Where do these numbers come from?

From your own records, which is why a trading journal is the first tool to build. Each closed trade needs four things written down: the entry, the stop, the exit and the size. From those you can work out the R on every trade, and every line of the scorecard follows. Our post on how to create a trading journal shows how to set one up.

Keeping score in public is harder, and it changes how you trade, because there is no quietly forgetting a bad week. Our own trade log is public, every trade since April 2024, dated, losses left in, and you can see how it is laid out on the trade log page.

So, pull up your last 20 trades. Which line of the card can you fill in today, and which one have you never measured at all?

FAQ

What are the most important trading performance metrics?

The core five are sample size, win rate, payoff ratio, profit factor and maximum drawdown. Expectancy, which combines win rate and payoff into a result per trade, is the usual sixth.

How do you calculate profit factor?

Divide gross profit by gross loss over the same period. If your winners made 17.8R and your losers lost 11.4R, the profit factor is 1.56.

What is a good profit factor?

Any profit factor above 1 means the strategy made money over the period measured. How good a given figure is depends on the sample size and the drawdown that came with it, so judge it alongside the rest of the scorecard.

How is maximum drawdown calculated?

Track your account value or running total after each trade, note each new high, and measure the largest fall from a high to the lowest point before the next high. That largest fall is the maximum drawdown.

How many trades do I need before these numbers mean anything?

Our rule of thumb is 100 to 200 trades. Below that, a lucky or unlucky run can make any of these numbers look far better or worse than the strategy really is.

Go deeper

This post sits under our guide to money and risk management. If you would like a routine that builds the scorecard week by week, the free 15-Minute Swing Trader’s Checklist is the place to start.


About the author. Spencer Li is The 15-Minute Trader and the founder of Synapse Trading. He is a Certified Financial Technician (CFTe) with 15+ years of trading, run from 70+ countries. He holds a B.Acc and B.BM from SMU. Every trade he takes is public, dated, losses left in. He teaches low-risk swing trading in 15 minutes a day, one system for any market.

Educational content only, not personalised financial advice. Trading carries risk, including loss of capital. Past performance is not indicative of future results. Synapse Trading is not licensed or regulated by MAS.

by Spencer Li
https://synapsetrading.com/wp-content/uploads/2026/10/trading-performance-metrics-card.webp 630 1200 Spencer Li https://synapsetrading.com/wp-content/uploads/2026/10/synapse-logo-horizontal-light.png Spencer Li2026-04-28 12:26:172026-09-22 13:10:41Trading Performance Metrics: The 5 Numbers That Tell You If a Strategy Works
The Synapse Network

Using Trading Indicators to Exit Trades for Risk Management

Risk & Money Management
Exit trades with indicators - risk management

In trading, many focus on when to enter a trade, but knowing when to exit is just as critical, if not more.

Exiting a trade at the right time can lock in profits, prevent losses, and effectively manage risk.

One of the most effective ways to decide when to exit a trade is by using technical indicators.

These indicators help traders manage risk by setting clear, objective criteria for when to close a position.

To use trading indicators for exits, you need to focus on these key principles:

  • Choose indicators that align with your risk management goals.
  • Use a combination of trend, momentum, and volatility indicators.
  • Set clear exit rules based on indicator signals.

Let’s explore these principles in detail.
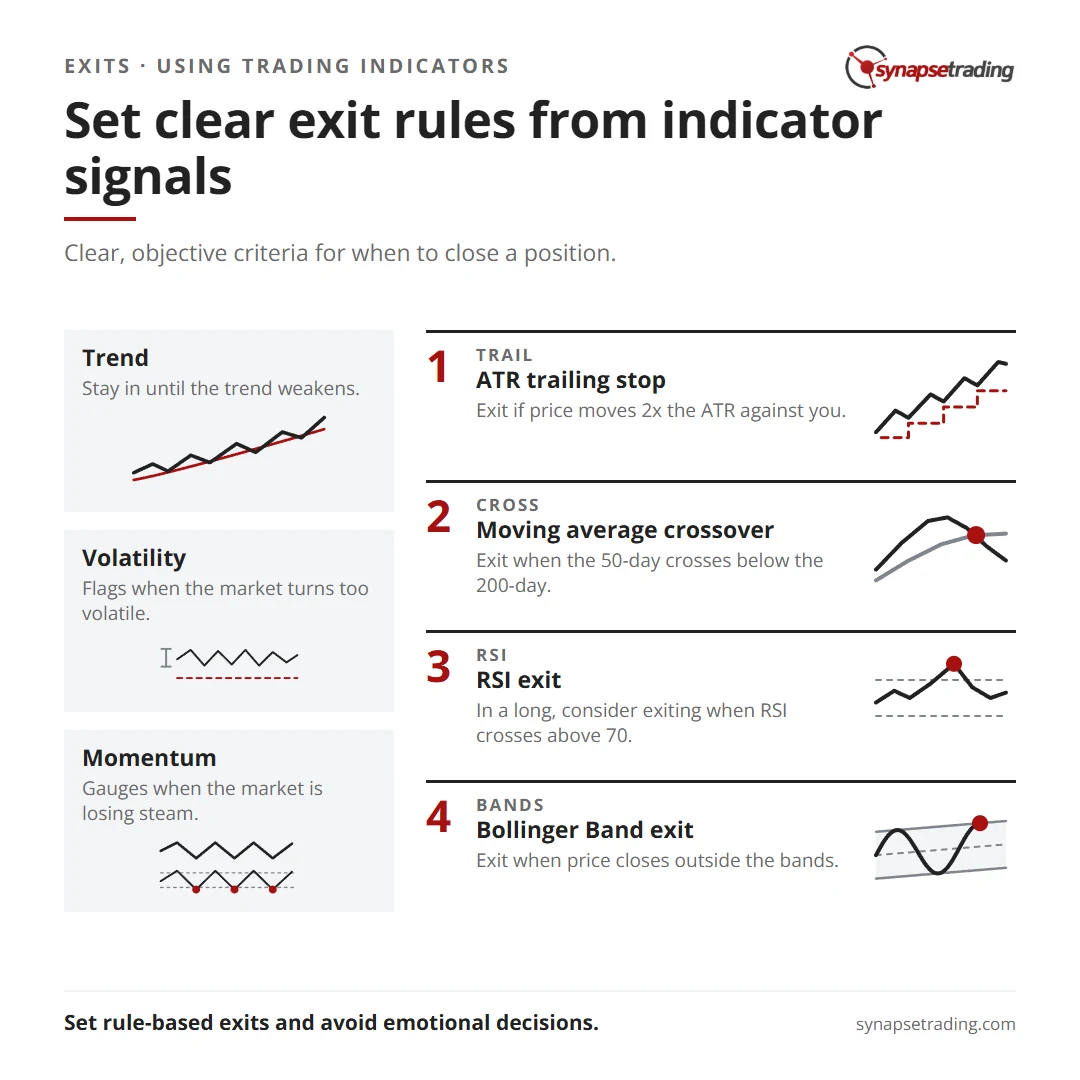
Set clear exit rules from indicator signals. Summary card for the post: Using Trading Indicators to Exit Trades for Risk Management.

Choose Indicators Aligned With Risk Management Goals

The first step is to choose the right indicators that help you manage risk. Not all indicators are suitable for exit strategies, and some are better for identifying when to get out of a trade than others. The goal is to pick indicators that align with how you want to manage risk—whether it’s locking in profits, cutting losses, or both.

For example:

  • Trend indicators can help you stay in a trade until the trend weakens.
  • Volatility indicators help identify when the market is becoming too volatile and signaling potential danger.
  • Momentum indicators can help you gauge when the market is losing steam, prompting an exit.

Categorizing Indicators for Exiting Trades

Understanding the categories of indicators can help you build a solid exit strategy. Each category serves a different purpose when managing risk.

  • Trend Indicators: These help you stay in a position while the trend is strong but also signal when the trend is weakening. Examples include Moving Averages (like the 200-day or 50-day) and the MACD (Moving Average Convergence Divergence).
  • Volatility Indicators: These help you gauge when a market is experiencing high or low volatility. This can signal when it’s time to get out if the risk of staying in the trade becomes too high. Common indicators include Bollinger Bands, ATR (Average True Range), and the Keltner Channel.
  • Momentum Indicators: These help identify when a market is overbought or oversold, which could indicate that the price might reverse soon. Common momentum indicators include the RSI (Relative Strength Index) and Stochastic Oscillator.

Setting Exit Rules Based on Indicators

Once you’ve selected your indicators, you need to define how you will use them to exit trades. Clear exit rules help ensure that your decisions are not based on emotions but on objective signals from the market.

Here are a few examples:

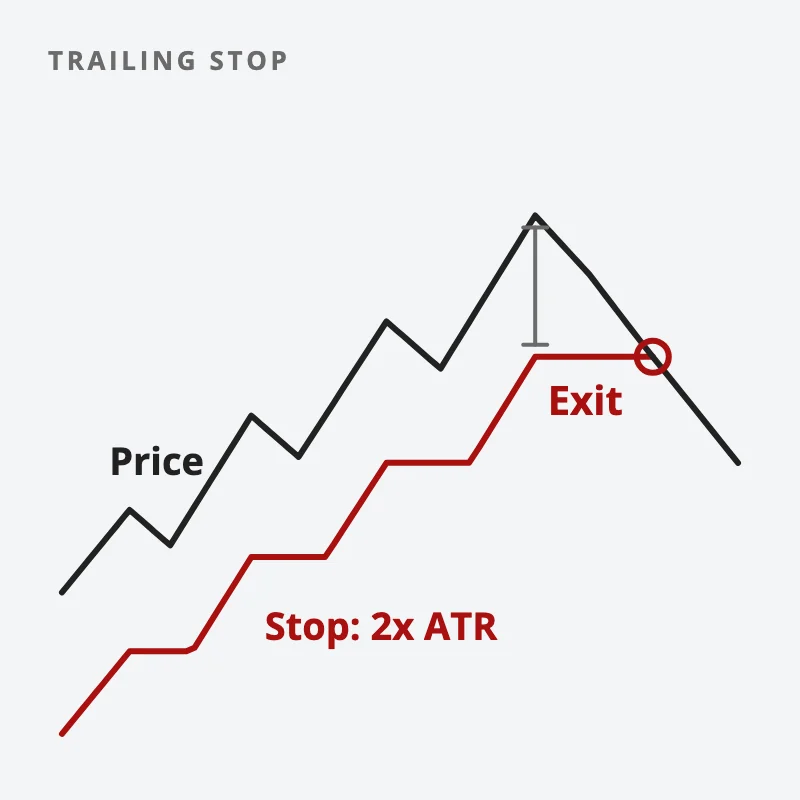
  • Trailing Stop Using ATR: Use the Average True Range (ATR) as a trailing stop indicator. ATR measures market volatility, and you can set a stop loss at a multiple of the ATR. For example, if the ATR is 20 points and you set a stop loss at 2x the ATR, you would exit the trade if the market moves 40 points against you.
  • Moving Average Crossover: If you are following a trend, you could exit a trade when a shorter-term moving average crosses below a longer-term one. For example, if the 50-day moving average crosses below the 200-day moving average, it could signal that the uptrend is over, prompting an exit.
  • RSI Exits: When using RSI, you can exit a trade when the RSI moves into overbought (above 70) or oversold (below 30) territory. For instance, in a long trade, you might consider exiting when the RSI crosses above 70, as this could indicate that the price is nearing a peak.
  • Bollinger Bands for Exit: If you’re in a trade and the price hits the upper or lower Bollinger Band, it can signal that the price has moved too far and may soon reverse. Traders often exit when the price closes outside of these bands.

Indicator Combinations for Exiting Trades

Here are a few examples of how combining different indicators can improve your exit strategies:

1. ATR and Moving Averages
Using the ATR as a trailing stop in combination with moving averages helps lock in profits while following the trend. The moving averages (such as a 50-day and 200-day) can guide your decision to stay in or exit based on trend direction, while the ATR ensures you have a safety net by trailing the stop.

A red stop line trails price upward at a gap of 2x ATR; when price falls back and touches it, the trade exits
Trail your stop a set multiple of ATR behind price, and exit when price hits it.

2. Bollinger Bands and RSI
Bollinger Bands can give you an idea of volatility and when a price may be overextended. When combined with the RSI, you can confirm whether the price is truly overbought or oversold, giving you a solid basis to exit your trade.

3. MACD and Stochastic Oscillator
The MACD helps to spot trend reversals and can be used to exit when the MACD line crosses below the signal line. Adding the Stochastic Oscillator can help you identify when momentum is weakening, providing another layer of confirmation for your exit.

Example of Using Indicators to Exit Trades

Here’s an example of how to use these indicators to exit a trade in the forex market:

Let’s say you are long on EUR/USD, and you’ve been following the trend with the help of a 50-day moving average. As the price rises, the RSI begins to move into overbought territory (above 70). At the same time, the price closes outside the upper Bollinger Band, signaling overextension.

At this point, your exit strategy could be to close your position as soon as the RSI moves back below 70 and the price dips back inside the Bollinger Bands. This exit strategy locks in profits while managing the risk of a reversal.

Concluding Thoughts

Using trading indicators to exit trades is an essential part of risk management.

Whether you’re focusing on preserving profits or cutting losses, combining indicators from different categories—trend, momentum, and volatility—can provide the necessary insights to make objective exit decisions.

The key to success is setting clear, rule-based exits and avoiding emotional decisions.

By testing different combinations in a demo account, traders can refine their strategies and develop a more disciplined approach to managing their trades.

by The Synapse Network
https://synapsetrading.com/wp-content/uploads/2026/10/using-trading-indicators-to-exit-trades-for-risk-management-card.webp 630 1200 The Synapse Network https://synapsetrading.com/wp-content/uploads/2026/10/synapse-logo-horizontal-light.png The Synapse Network2023-09-20 01:07:262026-08-31 08:53:07Using Trading Indicators to Exit Trades for Risk Management
Spencer Li

Is Trading Gambling? (How to Profit Consistently Like a Casino)

Risk & Money Management
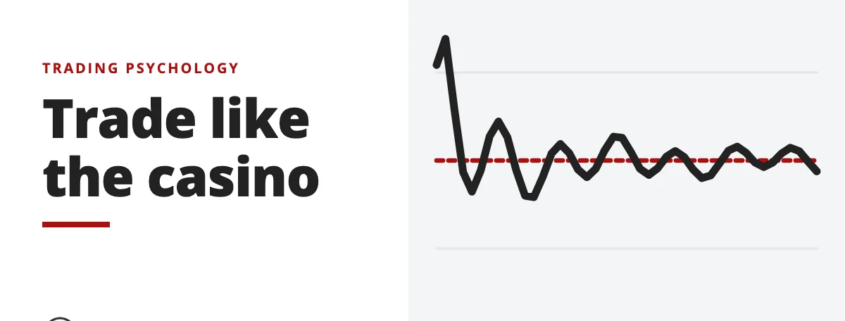
Trade like the casino - trading psychology

You have probably heard horror stories of people losing all their hard-earned money in the financial markets, or even going into debt.

This makes you wonder if you should avoid any form of high risk trading or investing, and just stay away from the financial markets.

But is trading really that risky? Is trading gambling, similar to a night at the casino? Is the chance of losing everything really that high?

Or is there a way to keep the risk under control?

In this blog post, I’m going to talk about the risks of trading and investing, discuss the question “is trading gambling?”, and whether it is the same as gambling in the casino.

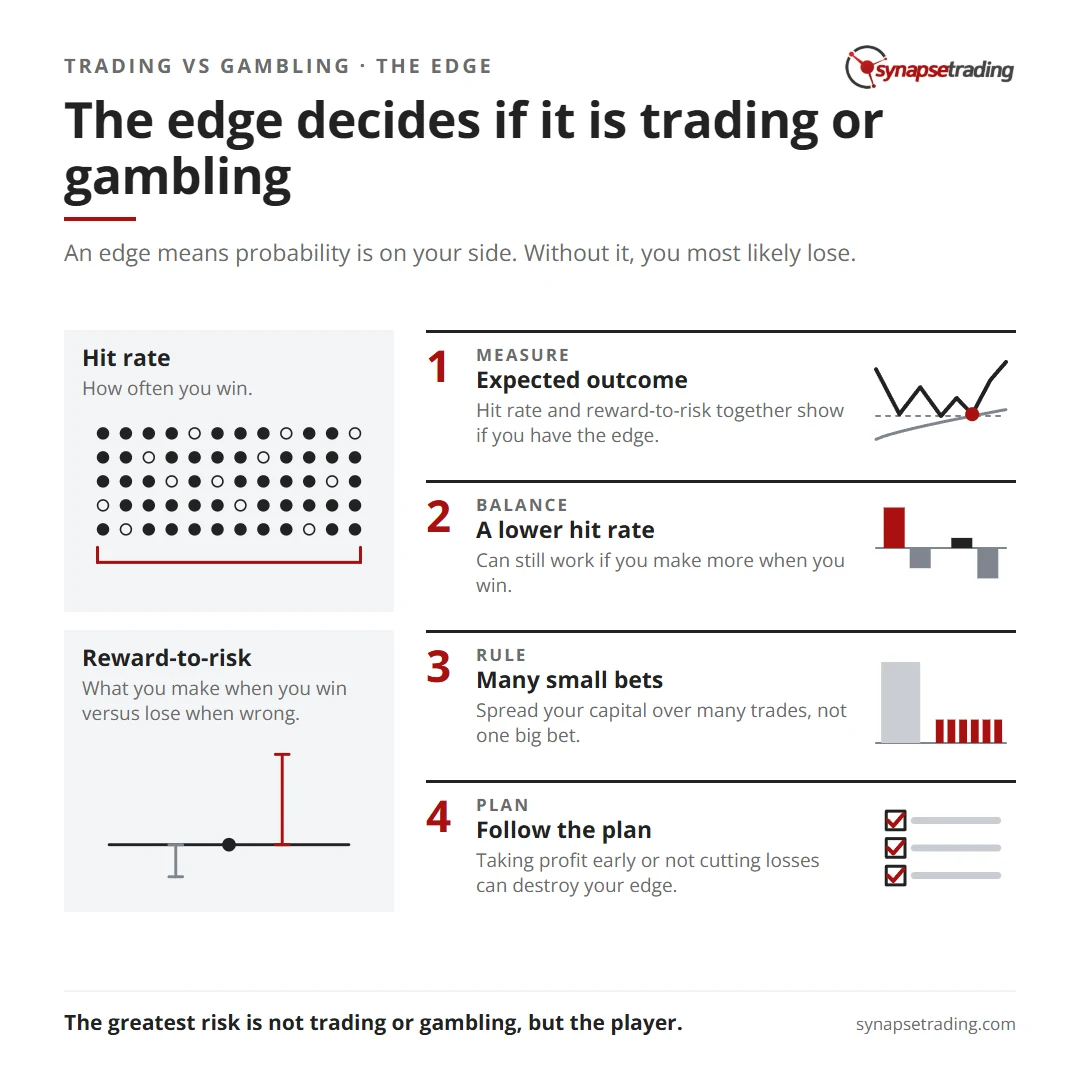
The edge decides if it is trading or gambling. Summary card for the post: Is Trading Gambling? (How to Profit Consistently Like a Casino).

Similarities of Trading & Gambling

Most people agree that gambling is definitely risky, and is a sure-lose proposition in the long run. And I don’t dispute that.

What about trading then? Is it the same? Is trading gambling?

At first glance, trading appears to be very similar to gambling, which is why many people tend to lump them together, and deem it to be intrinsically risky, with the high possibility of a huge loss.

However, while there are some similarities, there is actually a major difference between these two activities.

Firstly, for the similarities.

Trading and gambling both involve a certain element of luck and skill, as well as probabilities and uncertainties.

Both present the opportunity to make or lose huge amounts of money in a short period of time, depending on your skill level.

That is why both pursuits require good money management skills and strong psychology.

Is Trading Gambling? (It Depends on Your Edge)

However, there is one big difference – the mathematical edge.

So to answer the question of “is trading gambling?”, whether you are trading or gambling depends on whether you have the edge.

Simply put, this refers to whether probability is on your side.

If you are a professional trader or a professional gambler, and you have the edge, then you will likely be profitable in the long run.

If you have no idea what you are doing when trading or gambling (you do not have the edge), then you will most likely lose in the long run.

In a casino, since most people have no idea what they are doing, and most people are just there to have fun, the casino usually has the edge, and hence it wins most of the time.

So in order for you to beat the casino, or other players in the financial markets, you need to have an edge.

As I covered in my other posts, your trading plan and trading journal should help you develop that edge.

What is Expected Outcome in Trading?

Before I move on, let me explain what this edge is all about.

To do that, we need to bring in the important concept of “expected outcome”.

Without going into the detailed math (which I have covered in another post), the “expected outcome”, or E(X), tells you whether your strategy is profitable in the long run.

If your expected outcome is positive (more than zero), it means that over the long run, your strategy has an edge, and over many trades it should come out ahead, though losing runs still happen.

On the other hand, if your expected outcome is negative (less than zero), then it means that over the long-run you will lose money.

How to Calculate Expected Outcome

How then, is this expected outcome calculated?

It depends on 2 main factors, namely:

  • Your hitrate (or winrate)
  • Your reward-to-risk ratio (RRR for short)

Your hitrate is your winning percentage, for example a 70% hitrate means you win 70% of the time, and lose 30% of the time.

Your RRR is the ratio of how much you make when you win, versus how much you lose when you are wrong.

When you combine these 2 components, you can calculate your expected outcome, which will tell you whether you have the edge.

In trading, doing your analysis and taking a calculated risk tilts the probability in your favour, while in gambling, such as in a casino, the odds are always against you.

How Often Do You Need to Win to Be Profitable?

Some people have asked: Is it possible to make money if you only win 40-50% of the time?

The answer is yes.

If you make more money when you win, as compared to your losses when you lose.

For example, if you make 2-3x returns whenever you win, but only lose 1x when you are wrong, and you win 50% of the time, your expected outcome is still positive.

So it really depends on the strategy which you are using.

There are many different types of strategies, with different combination of hitrate and RRR, which can all give a net positive outcome.

For example, you could have a lower hitrate and high RRR, like the one mentioned above, or you could have a higher hitrate and lower RRR.

In a sense, this is a trade-off, but you just need to find the right balance of hitrate and RRR that gives you a positive expected outcome.

How to Beat the Casino

Another important concept is the law of large numbers.

We previously established that if you have the edge, your expected outcome is positive, and over many trades you should come out ahead.

But how do we ensure that you last long enough to take advantage of the long run?

In other words, how do we ensure that you do not blow up your account (lose all your capital) before you are able to utilize that trading edge?

In statistics, the law of large numbers states that the larger your sample size (the number of times you trade or gamble), the closer your outcome will be to the expected outcome.

So, the solution is actually quite simple.

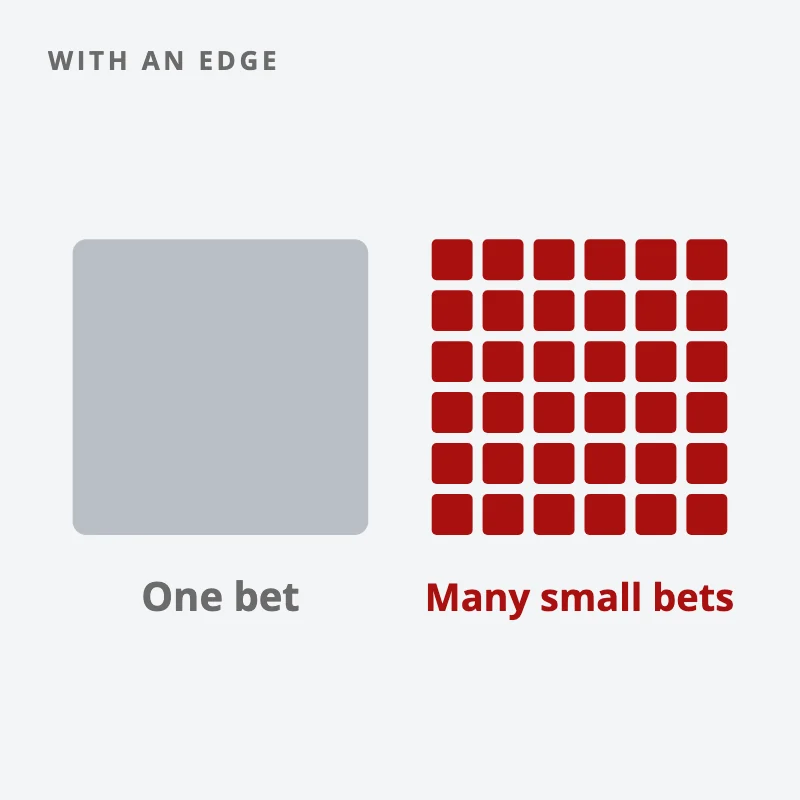
All you need to do is to make sure you spread out your money over many trades. Because the more trades you take, the more likely your results will match the expected outcome (which is positive).

The same capital shown as one large grey block for a single bet, or split into many small red blocks for many small bets
With an edge, spread your capital over many small trades, not one big bet.

In gambling, since you do not have the edge, your best bet is to actually do the opposite, which is to take a handful of large bets, and quit the moment you’re up, because the longer you play, the more likely you will lose money in the long run.

This does not remove the casino’s edge; it only shortens your exposure to it.

On the other hand, if you have the trading edge but you do not manage your money well, then you are taking away the edge that you have.

At this point, if you are still wondering “is trading gambling?”, the strategy for gambling and trading are exact opposites.

Can You Follow the Plan?

One other important factor to consider is the psychological and emotional aspect of trading/gambling.

Because money is at stake, many people are unable to make logical decisions or execute their strategy systematically.

If you have a strategy which has an edge, but you execute it differently, then you are either giving up that edge, or worse, changing your strategy into one which has a negative expected outcome.

For example, if you do not fully optimize your winning trades (taking profit too early), or you do not manage your losses well (not cutting losses), then your RRR will change drastically.

This is because your reward will be lower than expected, and your risk will be higher than expected, so your overall RRR will be much worse.

This could be enough to destroy whatever edge you have, and tip your expected outcome from a net positive to a net negative.

It doesn’t make sense to come up with a great strategy and trading plan, and then choose not to follow it due to conflicting emotions.

Are you making decisions or just guessing?

Concluding Thoughts

In conclusion, the greatest risk is not trading or gambling, but rather the player.

The risk involved is not dependent on the activity itself, but rather the expertise and experience of the person doing it.

Professional poker players (who are not gamblers) win because they do not play by pure luck (gambling), instead they use a system that gives them an edge over other players in the long run.

The reason why people lose big in trading is because they trade without a method or system which gives them an edge, or even if they do have an edge, they do not take full advantage of the edge, and instead take single large bets instead of many small bets.

This is why position-sizing, capital allocation and risk management are such essential concepts in trading.

Emotions, such as greed and hope, also tends to cloud better judgment even when one should know better, and erodes the trading edge in their strategy.

Most traders tend to see only the upside in their trades, and not the downside, hence they sell quickly once they see a profit, but hold on to losses in hope that these would turn around.

These are the main reason why many traders who have the edge are still unable to grow their accounts.

So if you want to be profitable in trading, just keep in mind these 3 things:

  • Have a trading plan & strategy which gives you an edge
  • Spread your capital over a large number of trades
  • Manage your emotions and execute your trading plan

Now that I have shared the main difference between trading and gambling, do you still think that trading is as risky as gambling? How will you explain if someone asks you “is trading gambling?”, and what is the difference?

Let me know in the comments below!


About the author. Spencer Li is The 15-Minute Trader and the founder of Synapse Trading. He is a Certified Financial Technician (CFTe) with 15+ years of trading, run from 70+ countries. He holds a B.Acc and B.BM from SMU. Every trade he takes is public, dated, losses left in. He teaches rules-based swing trading in 15 minutes a day, one system for any market.

Education, not financial advice. Synapse Trading is not licensed by MAS to advise on investment products. Trading carries risk of loss; past performance is not indicative of future results.

9 Comments/by Spencer Li
https://synapsetrading.com/wp-content/uploads/2026/10/trading-gambling-casino-card.webp 630 1200 Spencer Li https://synapsetrading.com/wp-content/uploads/2026/10/synapse-logo-horizontal-light.png Spencer Li2021-03-26 10:00:532026-08-07 10:34:59Is Trading Gambling? (How to Profit Consistently Like a Casino)
Spencer Li

Market Crash: Is it Better to Sell Everything or Hold On? (For Your Long-Term Investment Portfolio)

Risk & Money Management
Crash: sell or hold on? - investing

Recently in this stock market crash I have been getting this question a lot, and I think it applies not just to this market crash, but to all large market corrections in general.

So, is it better to sell everything in your investment portfolio, or to hold on till the market recovers?

In this video, I share my thought process on how I make my investment decisions for my long-term investment portfolio, and I offer you two important pieces of advice which you can use to strategize your own investment portfolio.

In deciding whether to cash out, you need to determine if you are using an active or passive investing strategy.

If your portfolio strategy is passive investing like dollar-cost averaging, or annual rebalancing of an all-weather portfolio, then whether the market is up or down should not have an impact on your strategy, and there is no reason to change your portfolio strategy and panic sell just because there is a market crash.

If your investing strategy is more active, such as value investing, or asset rotation, and you are good at it, then by all means follow your strategy of rotating your assets into safe haven products like cash or bonds.

The problem that most people face is that they do not have a portfolio strategy in the first place. And if this is the case, then should you hold on to what you have, or sell it in case it goes lower?

In the past 50 years, the market has only corrected 30% or more about 5 times, and only 50% or more about twice. So we need to think about this in terms of a trade-off between upside vs. downside potential.

If the market has already corrected 30%, and you did not manage to liquidate your portfolio earlier, at this very point in time, how much lower can it go? Another 20-30% more?

But if you sell off and it recovers to the previous highs before you can buy back in, the gains you will miss out are 40-50%.

So you need to decide if the downside risks you are avoiding is worth the potential gains that you could miss out on.

Another major consideration is whether you are currently adding to your portfolio (cash inflow), or drawing out from your portfolio (cash outflow). This will determine how aggressive your portfolio strategy is, and I will talk more about it in the video.

Enjoy the video, and remember to “like” and “subscribe”!

by Spencer Li
https://synapsetrading.com/wp-content/uploads/2026/10/market-crash-portfolio-card.webp 630 1200 Spencer Li https://synapsetrading.com/wp-content/uploads/2026/10/synapse-logo-horizontal-light.png Spencer Li2020-03-18 22:45:462026-07-07 09:38:35Market Crash: Is it Better to Sell Everything or Hold On? (For Your Long-Term Investment Portfolio)
Spencer Li

Is Your Portfolio Anti-Fragile? (Does it Fare Well During a Market Crash?)

Risk & Money Management
Is your portfolio anti-fragile? - investing

In a bull market, everyone is a genius because it does not take any skill to get great returns.

However, the real test of your portfolio is during a market crash or crisis. How will it fare if the stock market drops 50%?

If your portfolio is anti-fragile, it will actually benefit from such market volatility, and give you opportunities to buy assets on discount.

Enjoy the video, and remember to “like” and “subscribe”!

by Spencer Li
https://synapsetrading.com/wp-content/uploads/2026/10/anti-fragile-portfolio-card.webp 630 1200 Spencer Li https://synapsetrading.com/wp-content/uploads/2026/10/synapse-logo-horizontal-light.png Spencer Li2020-02-25 13:04:342026-10-02 20:24:39Is Your Portfolio Anti-Fragile? (Does it Fare Well During a Market Crash?)
Page 4 of 6«‹23456›»

Free checklist

The 15-Minute Swing Trader’s Checklist

The daily and weekly routine I use to find, manage and review trades in about 15 minutes a day, on the record since 2014.

Get the free checklist

Topics

  • Trading foundations
  • Technical analysis
  • Strategies and systems
  • Risk and money
  • Trading psychology
  • Markets and products

Synapse Trading

Swing trading for busy professionals, in 15 minutes a day.

Start free

Learn

  • Start here
  • Free trading guides
  • Blog
  • Tools and resources

Programs

  • Trading Mastery Program
  • Daily trading signals
  • Student results
  • Public trade log

Company

  • About
  • Contact me
  • Partnerships
  • Disclaimer
  • Privacy policy
  • Terms & Conditions

Synapse Trading Pte Ltd
Registration No. 201316168H
WhatsApp +65-8897-1204
info@synapsetrading.com

Contact Us

Synapse Trading Pte Ltd
Registration No. 201316168H

Whatsapp: +65-8897-1204
Telegram: @iamrecneps
Email: info@synapsetrading.com

Links

Disclaimer
Privacy policy
Terms & Conditions
Contact us
Partnerships

© 2012-2026 Synapse Trading | All rights reserved. Educational content only, not personalised financial advice. Trading carries risk, including loss of capital. Past performance is not indicative of future results. Synapse Trading is not licensed or regulated by MAS.
  • Link to Facebook
  • Link to X
  • Link to Instagram
  • Link to Youtube
  • Link to LinkedIn
  • Link to Mail
Scroll to top Scroll to top Scroll to top