• Link to Facebook
  • Link to X
  • Link to Instagram
  • Link to Youtube
  • Link to LinkedIn
  • Link to Mail
Free PDF: The 15-Minute Swing Trader's Checklist, the daily routine on the record since 2014
Synapse Trading
  • Mentoring
    • Trading Mastery Program
    • All mentoring options
  • Signals
    • Daily trading signals
    • Signals trade log
  • Results
    • Student results and testimonials
    • Public trade log, losses left in
  • Free guides
    • Start here
    • Trading foundations
    • Technical analysis
    • Strategies and systems
    • Risk and money
    • Trading psychology
    • Markets and products
    • Free trading guides
    • Tools and resources
    • Blog
  • About
    • My background
    • My trading journey
    • Media and interviews
    • Travel log
  • Contact
    • Contact me
    • Partnerships
  • Start free
  • Click to open the search input field Click to open the search input field Search
  • Menu Menu
Spencer Li

The Law of Large Numbers in Trading: How Many Trades Before You Judge a Strategy?

Risk & Money Management
How many trades to judge? - risk management

Last updated: 1 September 2026 · By Spencer Li, CFTe


The law of large numbers says that the average of many repeated trials drifts closer to the true average as the number of trials grows. In trading, it means your results only start to show a strategy’s real edge after a lot of trades. Before that, luck is louder than skill.

How many is a lot? Our rule of thumb at Synapse Trading is 100 to 200 trades before you judge a system. The reason is arithmetic. With 20 trades, a strategy that truly wins half the time can easily show a win rate anywhere from about 28% to 72%. With 200 trades, that band narrows to roughly 43% to 57%.

And the smaller your edge, the more trades it takes. I’ll show you both with exact numbers below.
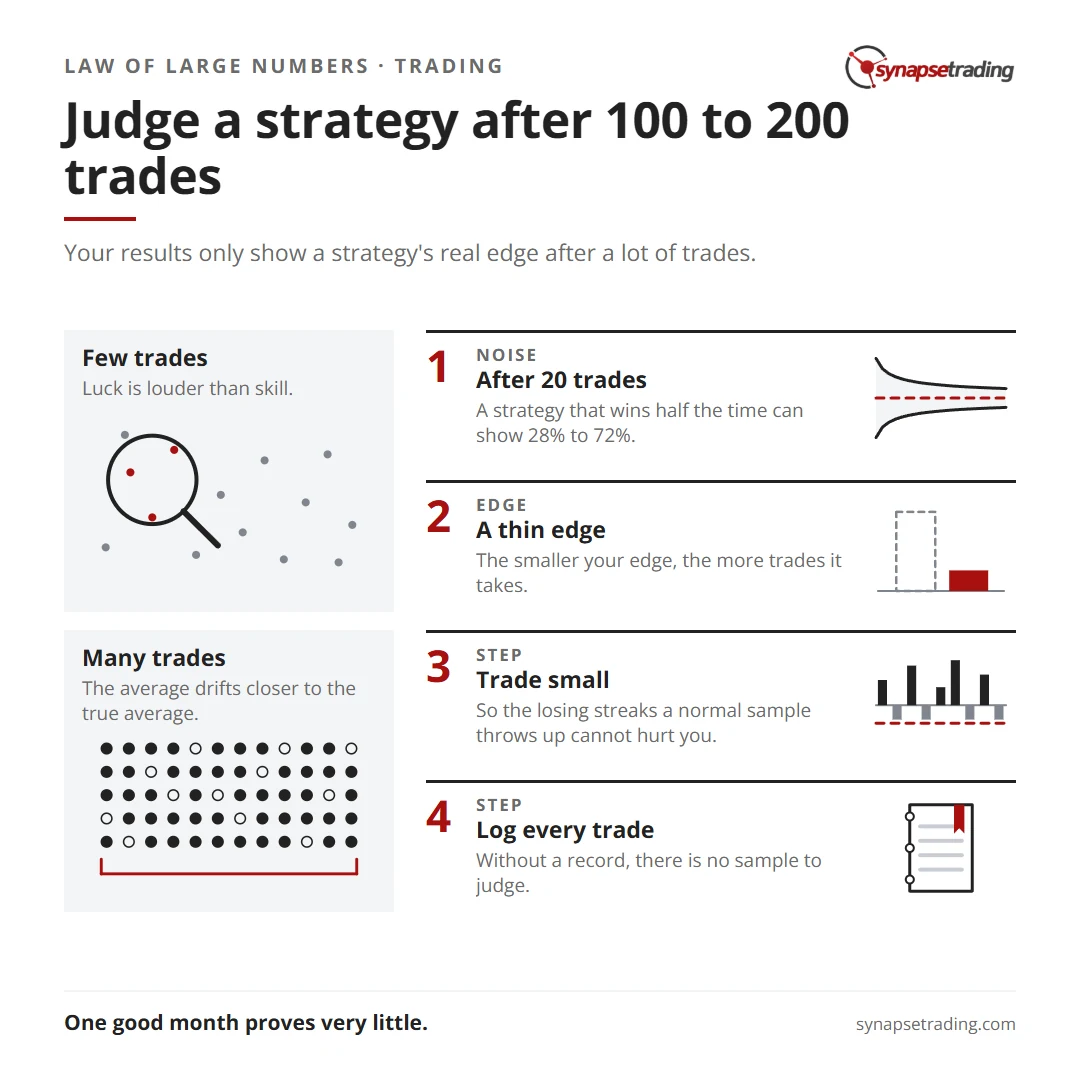
Judge a strategy after 100 to 200 trades. Summary card for the post: The Law of Large Numbers in Trading: How Many Trades Before You Judge a Strategy?.

What does the law of large numbers actually say?

Flip a fair coin 10 times and getting 7 heads is unremarkable. Flip it 1,000 times and getting 700 heads would be astonishing. The coin did not change. The sample did.

A casino runs on exactly this. Its edge on a single spin is small, and on any one evening a lucky player can walk out ahead. Over millions of spins the house result lands very close to its built-in edge, which is why the casino does not care who wins tonight, and why it happily sends the lucky player home with a free dinner. A trader with an edge is in the casino’s seat, but with far fewer spins, so what matters is how many spins it takes before the edge shows through.

How wrong can a small sample be?

Quite wrong. Say your strategy truly wins 50% of the time. Here is the range your measured win rate will land in about 95% of the time:

Trades takenMeasured win rate, 95% of the time
20roughly 28% to 72%
50roughly 36% to 64%
100roughly 40% to 60%
200roughly 43% to 57%
500roughly 46% to 54%

After 20 trades, the same strategy could look brilliant or broken purely by chance, and the trader looking at it would have no way of telling which of the 2 he was seeing. After 200, the band is still about 14 points wide. This is why one good month proves very little, and why one bad month should not send you shopping for a new system.
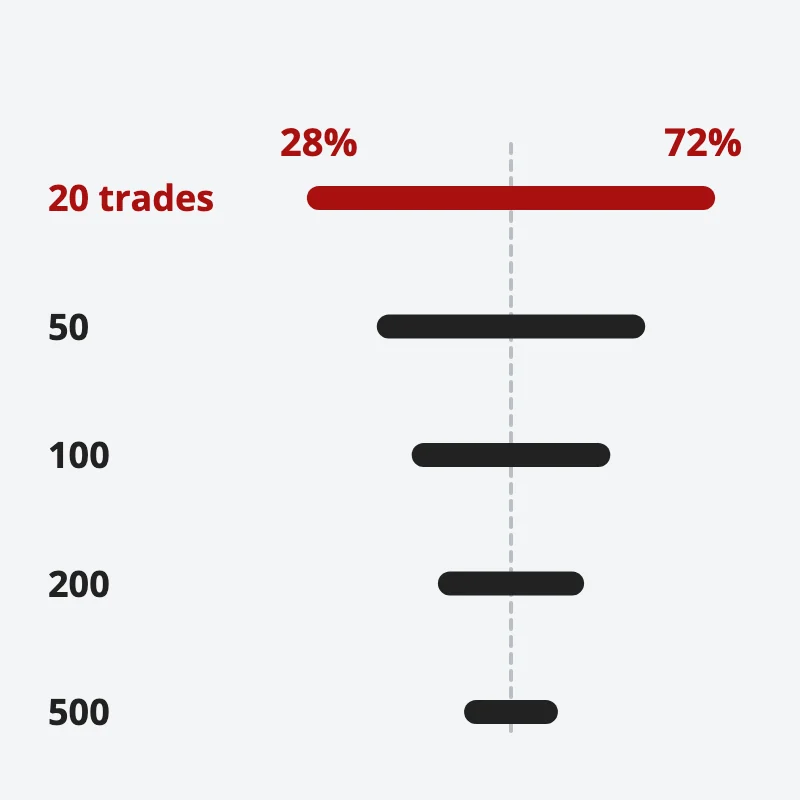
The range of measured win rates for a strategy that truly wins half the time: from 28% to 72% after 20 trades, narrowing steadily by 500 trades
After 20 trades, a strategy that wins half the time can show 28% to 72%.

The Central Limit Theorem explains the shape of this. Add up enough independent trades and the total behaves like a bell curve. Its middle grows in step with the number of trades, while its spread only grows with the square root. So 4 times as many trades makes the noise half as large relative to the edge, which is a slow and fairly expensive way to buy certainty.

Can a losing strategy look like a winner?

Yes, and for longer than most people expect. Here are 2 hypothetical strategies with the same payoff, where winners make 2R and losers cost 1R, with R being the amount risked per trade.

  • The good one wins 40% of the time, so it makes 0.2R per trade on average.
  • The bad one wins 30% of the time, so it loses 0.1R per trade on average.

I worked out the exact odds of each one fooling you:

After this many tradesGood strategy is still behindBad strategy is ahead
1038%35%
2025%39%
5016%32%
1009%22%
2003%16%

Look at the 20-trade row. The losing strategy is ahead almost 4 times in 10, and the winning one is still behind 1 time in 4. A trader who judges at 20 trades will dump good systems and fall in love with bad ones, and be sure of himself both times.

If you want a daily routine that keeps you taking the valid trades through a slow patch, the free 15-Minute Swing Trader’s Checklist is at the end of this post.

How many trades do you really need?

It depends on the size of your edge. The bigger the edge per trade, the sooner it stands out from the noise. Here is roughly how many trades it takes before the average result sits clearly above zero, at 2 standard errors:

Edge per tradeExampleTrades needed, roughly
0.5Rwins 50%, winners 2R36
0.4Rwins 35%, winners 3R91
0.2Rwins 40%, winners 2R216
0.1Rwins 55%, winners 1R396
0.03Rwins about 52%, winners 1Rabout 3,900

Most real strategies sit in the middle rows, which is where the 100 to 200 rule comes from. It is a floor. A thin edge needs far more.

A trader on r/Daytrading ran into the bottom row in August 2026. He had 500 trades on gold futures, half backtested and half traded forward, and asked a simple question: “is this an edge or variance?”

At a 1-to-1 payoff his result was “+0.032R/trade”, which, as he wrote himself, “could easily disappear once costs are included.” He was right to be cautious. By the table, an edge that thin needs thousands of trades to confirm. He also tested several profit targets on the same 500 trades and found one that looked best, and he flagged that too as possibly “variance / overfitting”. Testing many versions on one sample and keeping the winner is the fastest way to fool yourself with a small sample, so his caution is the useful part.

What do you do while the sample builds?

3 things, none of them exciting.

  1. Trade small. Size each trade so that the losing streaks a normal sample throws up cannot hurt you. The 2% money management rule for position sizing is the place to start, and smaller is fine while you learn.
  2. Log every trade. Without a record, there is no sample to judge. A trading journal turns your trades into data you can count.
  3. Judge the process before the results. Did you take the trades the rules said to take, at the size they said? That you can answer after 10 trades. Whether the rules work takes the 100 to 200.

The pull to judge early is very human. Our minds read patterns into short runs, which is the representativeness bias, the danger of a small sample size. Knowing it exists does not switch it off, so the rule has to be written down before the streak arrives.

Personally, I think the most useful number to know is your expectancy, the average R per trade, because it tells you which row of that table you are in. That is the next read, how to calculate a strategy’s expectancy, and its companion on win rate versus reward-to-risk. The wider map is in the practical guide to money and risk management, and why surviving the sample matters at all is in why risk management is important in trading.

Back in March 2026, another trader on r/Daytrading posted 2 months of results and asked: “Am I finding an edge or just getting lucky?” After 2 months, the honest answer is almost always that nobody can tell yet, him included. The answer arrives somewhere past trade 100, for whoever is still trading small enough to get there.

FAQ

What is the law of large numbers in trading?

It is the idea that your average result moves closer to your strategy’s true edge as you take more trades. Over a few trades luck dominates. Over hundreds the edge shows.

How many trades do I need to backtest a strategy?

At least 100 to 200, and more if the edge is thin. A strategy that makes only a few hundredths of an R per trade can need thousands of trades before it is clearly real.

Is 20 trades enough to judge a strategy?

No. After 20 trades a strategy that wins half the time can plausibly show a win rate between about 28% and 72%, so the record cannot separate a good system from a bad one.

What is the Central Limit Theorem in trading?

It says the total of many independent trades behaves like a bell curve. The edge grows with the number of trades while the noise grows only with its square root, so more trades make the edge easier to see.

Should I change my strategy after a losing streak?

A streak on its own is too little to go on. Check that you followed the rules and that the sample is large enough, because losing streaks of 5 or 6 trades are normal even in a strategy that works.

Go deeper

The free 15-Minute Swing Trader’s Checklist has the daily routine, the questions to ask before every trade, and the five rules that keep you in the game.


About the author. Spencer Li is The 15-Minute Trader and the founder of Synapse Trading. He is a Certified Financial Technician (CFTe) with 15+ years of trading, run from 70+ countries. He holds a B.Acc and B.BM from SMU. Every trade he takes is public, dated, losses left in. He teaches low-risk swing trading in 15 minutes a day, one system for any market.

Educational content only, not personalised financial advice. Trading carries risk, including loss of capital. Past performance is not indicative of future results. Synapse Trading is not licensed or regulated by MAS.
by Spencer Li
https://synapsetrading.com/wp-content/uploads/2026/10/law-of-large-numbers-trading-card.webp 630 1200 Spencer Li https://synapsetrading.com/wp-content/uploads/2026/10/synapse-logo-horizontal-light.png Spencer Li2026-08-11 15:41:152026-09-01 13:19:01The Law of Large Numbers in Trading: How Many Trades Before You Judge a Strategy?
Spencer Li

How to Hedge Your Portfolio Against a Market Crash, and What Each Hedge Costs

Risk & Money Management
Hedge against a crash - risk management

Cash, bonds, put options and inverse positions, with the price each one charges you in the years when no crash comes

Published: 16 October 2026 · Last updated: 15 October 2026 · By Spencer Li, CFTe


“Beginner, confusion on protecting downside but not limiting upside.” That was the title of a question on Reddit’s r/options, and it sums up hedging in one line.

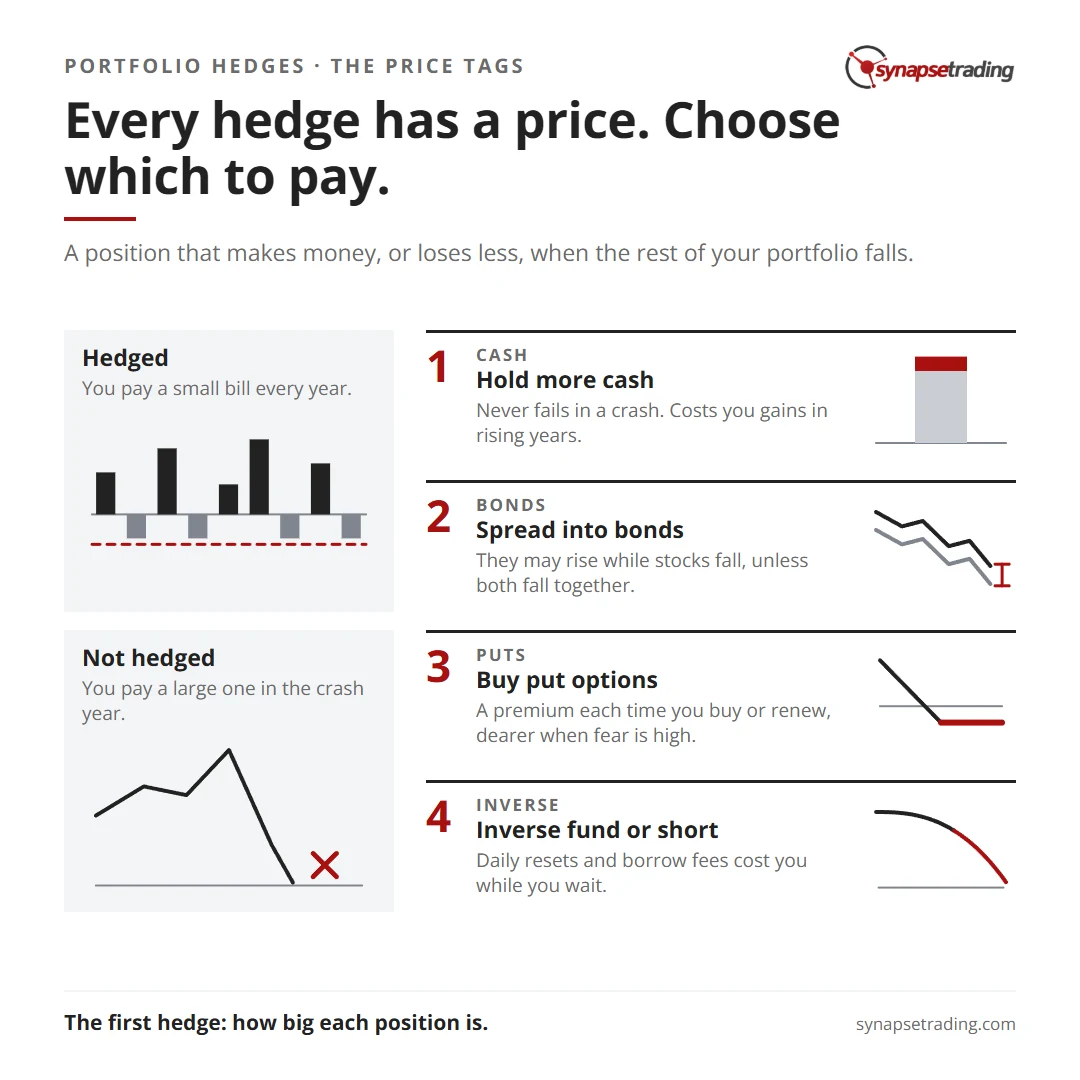
There are 4 ways to hedge a portfolio against a crash. You can hold more cash, spread into assets that tend to fall less, buy put options, or hold an inverse or short position.

Each one works. Each one also has a price, and you pay most of it in the years with no crash.

Cash and bonds cost you some of your gains in rising years, because the part of your money sitting in them is not riding the market up on the days it rises. Put options cost a premium every time you buy or renew them. Inverse and short positions cost you through daily resets, borrowing fees and the risk of being early.

No hedge protects your downside for free while leaving all of your upside. The job is to choose which price you would rather pay. I call this the Hedge Price Tag, and below is each tag, with real numbers.

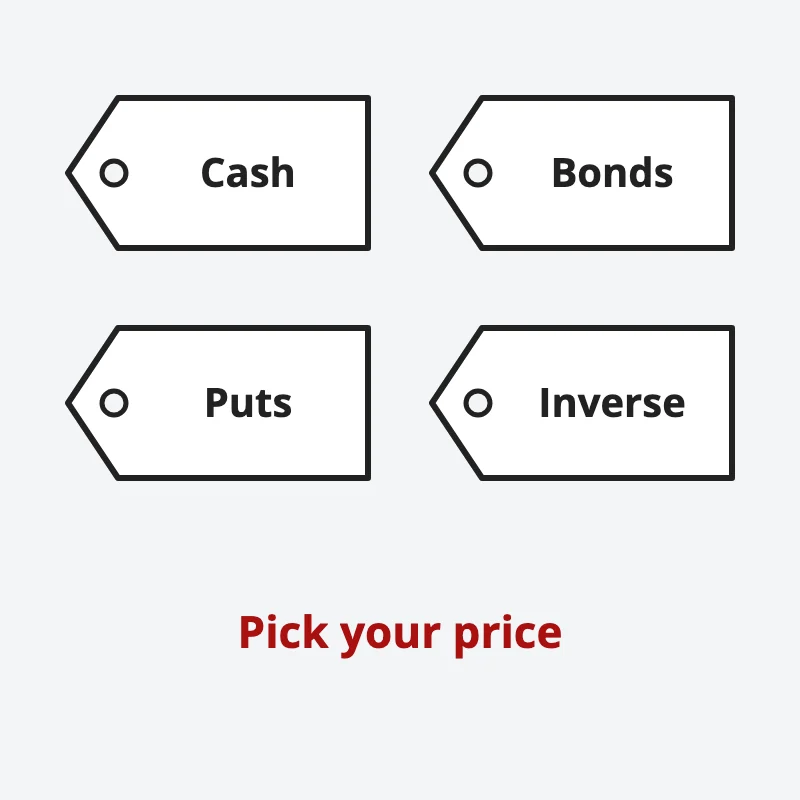
Four price tags, one each for cash, bonds, put options and inverse positions: every hedge costs something, so pick the price you would rather pay
Every hedge has a price; choose the one you would rather pay.

Every hedge has a price. Choose which to pay. Summary card for the post: How to Hedge Your Portfolio Against a Market Crash, and What Each Hedge Costs.

Why does every hedge cost something?

A hedge is a position that makes money, or loses less, when the rest of your portfolio falls.

Think about what would happen if one paid out in a crash and cost nothing in good years. Everyone would hold it, and its price would rise until it did cost something.

So the useful question is never “which hedge is free?” It is “which cost can I live with, and when do I pay it?”

Hedge 1: How much does holding cash protect you?

Cash is the simplest hedge. You hold less of the thing that can crash.

Here is what a portfolio of 80% US stocks and 20% Treasury bills did against 100% stocks, using Aswath Damodaran’s historical return series from NYU Stern. The stock figures include dividends, and the mix assumes a rebalance once a year.

Year100% S&P 50080% stocks, 20% T-bills
2002−21.97%−17.25%
2008−36.55%−28.96%
2022−18.04%−14.01%
2009+25.94%+20.78%
2023+26.06%+21.90%

Cash did its job in every bad year. The 2008 loss shrank by about 7.6 points.

The price tag: cash shrinks your gains by roughly the same share as it shrinks your losses. In 2009, the cash cost more than 5 points of the rebound. You pay that bill in every rising year you hold it.

Cash also never fails in a crash. It is the one hedge on this list that cannot go wrong on the day you need it.

Hedge 2: Does spreading into bonds protect you?

The idea behind a stock-and-bond mix is that the 2 do not always fall together. When they do not, the bonds cushion the stocks.

Here is the classic 60% stocks and 40% US 10-year Treasury bonds, from the same Damodaran series:

Year100% S&P 50010-year T-bond60/40 mix
2002−21.97%+15.12%−7.13%
2008−36.55%+20.10%−13.89%
2022−18.04%−17.83%−17.96%
2009+25.94%−11.12%+11.12%

In 2002 and 2008, bonds rose while stocks fell, and the mix lost far less, about a third of the stock loss in 2002 and well under half of it in 2008. That is diversification at its best.

Now look at 2022. Stocks fell 18% and bonds fell almost exactly as much. The 60/40 mix lost nearly as much as stocks alone, and that is the price tag.

The price tag: you give up some gains in rising years, as 2009 shows. You also carry a quieter risk. Diversification works only while the assets keep behaving differently, and nothing guarantees that they will in the next crash.

Hedge 3: How do put options protect a portfolio?

A put option gives you the right to sell at a set price, the strike, until a set date. If the market falls below the strike, the put gains value and offsets the fall. If the market does not fall, the put expires and you lose what you paid. The mechanics are in Call and Put Options Explained: How Each One Makes or Loses Money.

Take a hypothetical index at 100. A put with a strike of 90 caps your loss at about 10%, plus the price of the put. The price depends a great deal on how nervous the market is, measured as volatility.

These are model estimates from the Black-Scholes formula, with the index at 100, interest at 4% and no dividends. They are not quotes from any market.

Volatility1-year put at 901-year put at 953-month put at 95
15%, a calm market1.2%2.4%0.9%
20%2.5%4.0%1.6%
40%, a fearful market9.0%11.2%5.1%

Three lessons sit in that table.

Protection is cheapest when nobody wants it. The same 1-year put at 90 costs about 3.5 times as much at 40% volatility as at 20%. By the time a crash is under way and you finally want insurance, everyone else wants it too, and the price has already moved up to match the fear you are feeling.

It works when it is in place. Had you held a 1-year put at 90 through 2008, a fall of about 36.5% would have become a loss of about 12.5%: 10% down to the strike, plus 2.5% for the put. That assumes your portfolio moves like the index, which your own mix of stocks may not.

The premium adds up. At 2.5% a year, 10 years of puts with no crash leave you about 22.6% behind where you would otherwise be. Shorter puts look cheaper, but you have to buy 4 of them a year: 4 three-month puts at 95 cost about 6.4% a year in this model, against 4.0% for 1 one-year put.

There is a way to cut the premium. You can sell someone else the right to your gains above a level, and use what they pay to buy the put. That is called a collar.

Collars answer the Reddit question directly. You can protect the downside without capping the upside, but then you pay a premium. To skip the premium, you give up some upside instead.

Whichever hedge you choose, it works best on top of positions that were sized sensibly in the first place. Our free 15-Minute Swing Trader’s Checklist sets your stop and size before every trade. Get the free checklist →

Hedge 4: What about inverse funds and short selling?

An inverse fund aims to rise when an index falls. Short selling does the same with a single stock or index: you sell first and buy back later, hoping lower.

Both look like a clean offset. Both carry costs that are easy to miss.

Inverse funds reset every day. The SEC’s investor bulletin on leveraged and inverse ETFs explains that most of them “reset” daily. Over longer periods, their results can differ a long way from the multiple they advertise.

Here is a 2-day example. An index falls 10% to 90, then rises 11.1% back to 100. A fund aiming for −1 times each day’s move rises 10% on day 1 and falls 11.1% on day 2. The index is back where it started, and the fund is down 2.2%.

The SEC gives a real case. “Over four months, a particular index gained 2 percent.” A fund seeking twice the inverse of that index’s daily return “fell by 25 percent”. The bulletin warns that these funds “may potentially expose investors to significant and sudden losses.”

Short positions carry open-ended risk. A stock you own can fall by at most 100%. A stock you are short can rise without limit. You also pay a fee to borrow the shares you sold for as long as you stay short, and your broker can ask for more margin if the price moves against you. How Much Leverage Should You Use? covers how that margin works.

The price tag: a slow decay while you wait, and losses if the market rises or drifts sideways in the meantime. An offset that is early costs money every day it is early.

The Hedge Price Tag: which cost would you rather pay?

HedgeHow it protectsThe price tagWhen it fails
More cashYou hold less of what can crashSmaller gains in rising yearsIt does not fail, it only costs upside
Bonds or other assetsThey may rise while stocks fallSmaller gains, plus a correlation riskBoth fall together, as in 2022
Put optionsPay out below the strikeA premium each time you buy or renew, dearer when fear is highThe fall is small, slow, or comes after expiry
Inverse fund or shortGain as the market fallsDaily-reset decay, borrow fees, open-ended loss on a shortThe market rises or drifts while you wait

Before any of these 4, there is the hedge you already control: how big each position is. A portfolio where no single holding can do serious damage needs less hedging to begin with. How Much of Your Portfolio Can Sit in One Stock? walks through that test.

Every hedge sends you a bill. The only choice is whether you would rather pay a small one every year, or a large one in the year you did not hedge.

Hedging FAQ

What is the cheapest way to hedge a portfolio?

No hedge is free, so it depends on when you would rather pay. Cash has no upfront cost and you pay in smaller gains. A put has an upfront cost and leaves your gains alone.

Can I protect my downside without limiting my upside?

Yes, with a put option, but you pay a premium for it. To avoid the premium, you give up some upside instead, which is what a collar does.

Should I hedge my portfolio right now?

That depends on your own portfolio, goals and costs, and a general article cannot decide it for you. What the numbers above do show is that put protection costs more once fear is already high.

Are inverse ETFs a good long-term hedge?

They are built for a single day. The SEC warns that over periods longer than one day their results “can differ significantly” from the daily target, so check that before holding one for weeks.

Does a stop-loss count as a hedge?

It limits the loss on one position, but it is not a hedge in this sense. In a fast crash, prices can gap past a stop, and it does nothing for the rest of the portfolio.

Go deeper

This post sits under our guide to money and risk management. For the options side, see our options trading guide, and for the bigger picture, our guide to building an investment portfolio. If you would like the routine that fixes your stop and size before every trade, the free 15-Minute Swing Trader’s Checklist is the place to start.


About the author. Spencer Li is The 15-Minute Trader and the founder of Synapse Trading. He is a Certified Financial Technician (CFTe) with 15+ years of trading, run from 70+ countries. He holds a B.Acc and B.BM from SMU. Every trade he takes is public, dated, losses left in. He teaches low-risk swing trading in 15 minutes a day, one system for any market.

Educational content only, not personalised financial advice. Trading carries risk, including loss of capital. Past performance is not indicative of future results. Synapse Trading is not licensed or regulated by MAS.
by Spencer Li
https://synapsetrading.com/wp-content/uploads/2026/10/hedge-portfolio-market-crash-card.webp 630 1200 Spencer Li https://synapsetrading.com/wp-content/uploads/2026/10/synapse-logo-horizontal-light.png Spencer Li2026-07-22 14:46:522026-10-15 14:26:22How to Hedge Your Portfolio Against a Market Crash, and What Each Hedge Costs
Spencer Li

Sharpe Ratio vs Sortino Ratio: What Each One Measures and When They Disagree

Risk & Money Management
Sharpe vs Sortino ratio - performance metrics

Two risk-adjusted return ratios can rank the same 2 strategies in opposite order. Here is why, worked through on 12 hypothetical months.

Published: 16 October 2026 · Last updated: 16 September 2026 · By Spencer Li, CFTe


Strategy A made money in 11 months out of 12. Strategy B lost money in 6 of them.

Ask the Sharpe ratio which one is better, and it picks A. Ask the Sortino ratio, and it picks B by almost 3 times.

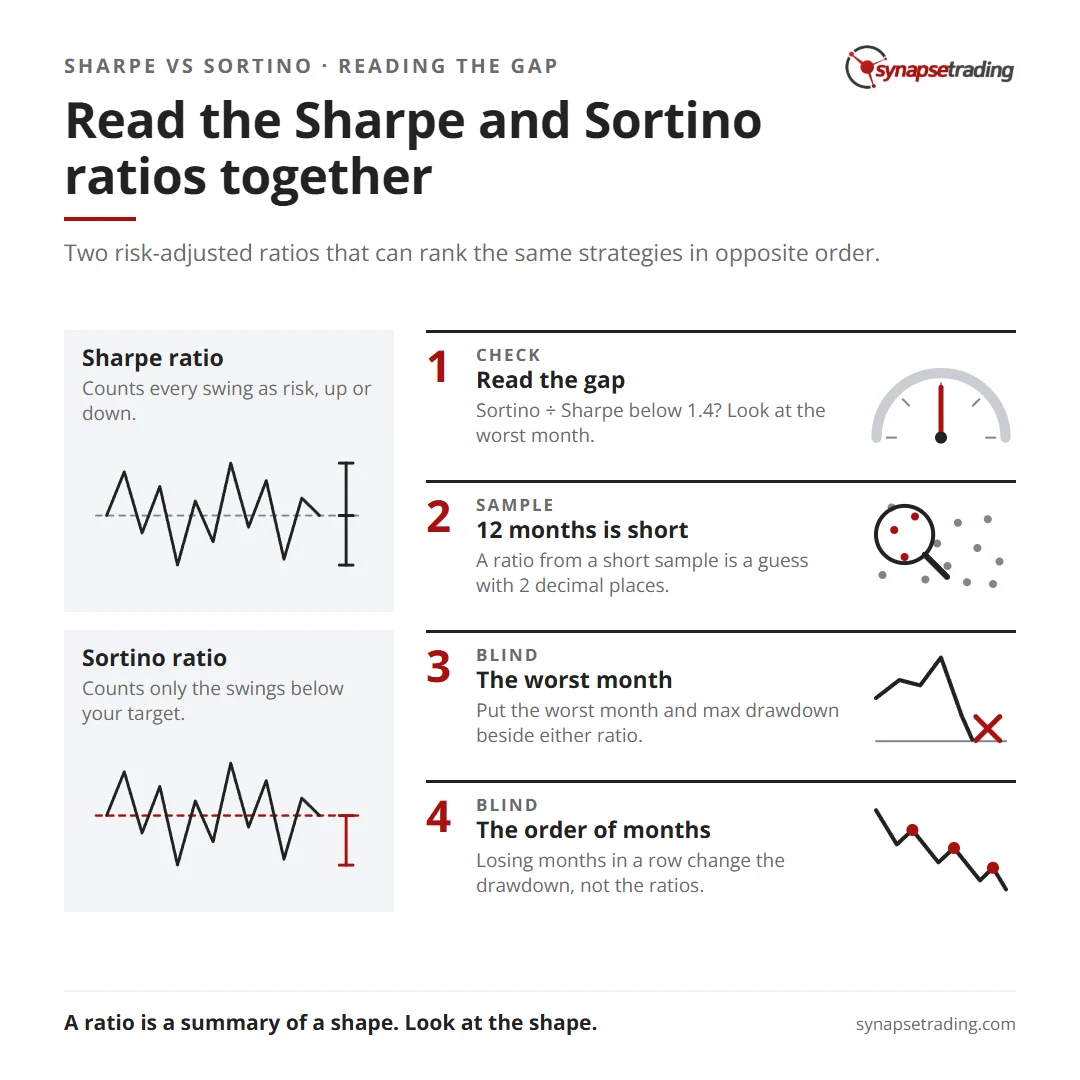
The Sharpe ratio divides your average return above a safe rate by the standard deviation of all your returns, so every swing counts as risk, whether it went up or went down. The Sortino ratio divides the same excess return by the downside deviation, which counts only the returns that fall below a target you choose.

When your returns are lopsided, the two will rank strategies differently. Read them together. The gap between them tells you the shape of your risk, and the shape is what you actually sit through.

Below are both formulas, the 2 strategies worked out line by line, a quick rule for reading the gap, and the 2 things neither ratio can see.

Read the Sharpe and Sortino ratios together. Summary card for the post: Sharpe Ratio vs Sortino Ratio: What Each One Measures and When They Disagree.

What is the Sharpe ratio, in plain words?

William Sharpe introduced it in 1966 to compare mutual funds. He called it the “reward-to-variability ratio”. As he wrote in 1994, “the measure has gained considerable popularity, the name has not.”

The formula:

Sharpe ratio = (average return − risk-free rate) ÷ standard deviation of returns

The top line is the reward: what you earned above a safe alternative like cash. The bottom line is the variability: how far your returns wander from their own average.

Do note that it measures the wander in both directions. A month 5% better than your average raises the standard deviation exactly as much as a month 5% worse. To the Sharpe ratio, a pleasant surprise is risk too.

In the examples below I set the risk-free rate to 0 to keep the arithmetic clean. When you compare your own numbers, use the same rate for everything you compare.

What is the Sortino ratio, and what does it change?

The Sortino ratio keeps the top line and swaps the bottom one. Instead of the standard deviation, it divides by the downside deviation: how far your returns fall short of a target you pick, often 0.

Sortino ratio = (average return − target return) ÷ target downside deviation

The idea comes from Frank Sortino’s work in the early 1980s. The clearest public walkthrough I know is a short paper by Thomas Rollinger and Scott Hoffman, “Sortino: A ‘Sharper’ Ratio”. It defines the downside deviation as the root-mean-square of each month’s shortfall below the target, “where all returns above the target return are treated as underperformance of 0.”

That last part trips people up. The good months are set to 0, but they stay in the count. The authors underline it: “we do not ‘throw away’ the 0% values.” Taking the standard deviation of the losing months alone is a common shortcut, and their paper shows why it gives the wrong number.

In practice, this means a big up month costs a strategy nothing on the Sortino ratio. Only shortfall counts as risk.

What happens when Sharpe and Sortino disagree?

Here are 2 hypothetical strategies over the same 12 months. The returns are invented to show the effect, and kept to round numbers.

HypotheticalStrategy AStrategy B
Monthly returns, %1.5, 1.5, 1.4, 1.6, 1.5, 1.5, 1.4, 1.6, 1.5, 1.5, −6.0, 1.5−1.0, 4.0, −1.5, 0.5, 6.0, −1.0, 0.5, −0.5, 5.0, −1.0, 1.0, −0.5
Losing months16
Worst month−6.0%−1.5%
Average month0.88%0.96%
Standard deviation2.17%2.58%
Downside deviation, target 01.73%0.69%
Sharpe ratio, monthly0.400.37
Sharpe ratio, annualised by √121.401.29
Sortino ratio, monthly0.511.38
Sortino ratio, annualised by √121.754.80

Sharpe ranks A first, narrowly. Sortino ranks B first, at 2.7 times A’s figure.

The reason sits in the bottom line of each formula. B’s standard deviation is high because of its 3 big up months of 4%, 5% and 6%, and Sharpe counts those swings as risk even though they are the best thing that happened to the account all year. Sortino ignores them and sees only B’s small losses, none worse than 1.5%.

A looks calm to Sharpe because 11 of its 12 months are almost identical. Sortino sees the one month that hurt: a 6% drop that wiped out 4 months of gains.

Which one would you rather hold? Asked honestly, most traders pick B. Its worst month was 1.5%, and A’s was 4 times that. A’s pattern, small steady gains with a rare large loss, is the pattern of selling insurance, and it looks safest on paper right up to the month the big claim comes in.

Good Wobble, Bad Wobble: how do you read the two together?

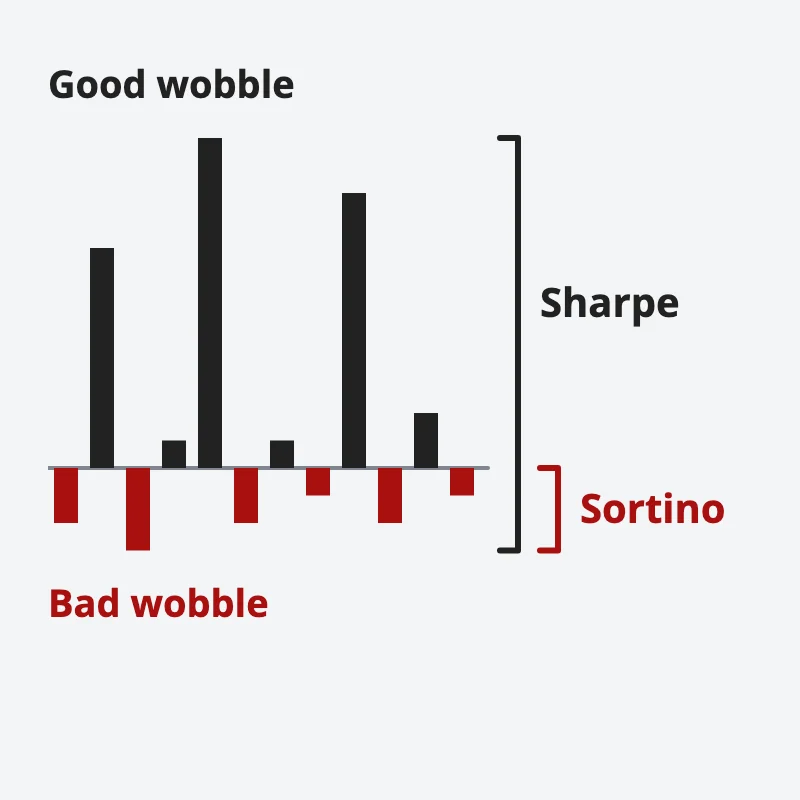
I call this Good Wobble, Bad Wobble. Every strategy wobbles. Good wobble is the swing above your target, and bad wobble is the swing below it. Sharpe counts both. Sortino counts only the bad.

Monthly return bars around zero: swings above are good wobble, swings below are bad wobble; Sharpe measures both, Sortino only the bad
Sharpe counts every swing as risk; Sortino counts only the swings below your target.

That makes the gap between the 2 ratios a reading on the shape of your returns. There is a simple benchmark for it.

If your monthly returns are spread evenly on both sides of 0, the Sortino ratio comes out at about 1.4 times the Sharpe ratio. That 1.4 is the square root of 2, and I checked it with 200,000 simulated months. With a positive average, the multiple climbs higher still.

Sortino ÷ SharpeWhat it tells you
Well above 1.4Most of the wobble is good wobble. Gains come in bursts, losses stay small. Strategy B is 3.7.
Around 1.4The wobble is roughly even on both sides.
Below 1.4The bad wobble outweighs the good. Losses are bigger or lumpier than gains. Strategy A is 1.25.

A ratio below 1.4 is your cue to go and look at the worst month before you trust the smooth line.

Both ratios only describe how a strategy has behaved, and what makes a strategy behave well in the first place is the routine behind every trade: a stop fixed before entry and a position sized to it.

Our free 15-Minute Swing Trader’s Checklist walks through that routine before every trade. Get the free checklist →

Why can 12 months of returns not settle the question?

Sharpe gave the test himself. In his 1994 paper he wrote: “The t-statistic will equal the Sharpe Ratio times the square root of T (the number of returns used for the calculation).”

Apply that to Strategy A. A monthly Sharpe of 0.40 times the square root of 12 gives a t-statistic of 1.40. The usual rough bar for a result being more than luck is about 2, and 1.40 does not clear it.

To reach 2 at a monthly Sharpe of 0.40, you would need about 25 months of returns. At a monthly Sharpe of 0.20, you would need 100 months, which is more than 8 years.

It is the same lesson as trade counts, where we give a system 100–200 trades before judging it. A ratio worked out from a short sample is a guess with 2 decimal places. The full argument is in How Many Trades Do You Need? The Law of Large Numbers and Sample Size.

Do note the √12 step too. Multiplying a monthly ratio by √12 assumes each month has nothing to do with the last. Sharpe flagged that returns “may be serially correlated”, and when they are, the annual figure overstates or understates the truth.

What can neither ratio see?

Both ratios are built from an average and a spread. Sharpe was open about the limit. Comparisons built only on those 2 numbers “do not take into account possible differences among portfolios in other moments”, which in plain words means the size and shape of the tails.

Put 3 things beside either ratio before you trust it.

The worst month and the max drawdown. A’s −6% month is the single number that explains the whole table above. Drawdown has its own section in The Performance Numbers That Matter.

The order of the months. Take Strategy B and move its 6 losing months together so they land in a row. Both ratios stay exactly the same, because neither cares about order. But the max drawdown goes from 1.5% to 5.4%, and a 6-month losing run is a very different thing to sit through than 6 small losses scattered across the year between your winning months.

How many trades sit behind each month. A month built on 2 trades and a month built on 30 trades count the same in both formulas. Your journal knows the difference, so keep the trading journal next to the ratios.

How do you work out both ratios from your own returns?

You need monthly returns as percentages, which a decent journal already gives you. Then:

  1. Pick a target and keep it. Use 0, or the cash rate. Whatever you pick, use the same one for everything you compare.
  2. Work out the Sharpe ratio. Take the average monthly return, subtract the target, then divide by the standard deviation. Sharpe’s own paper gives the spreadsheet version for 60 months of excess returns: AVERAGE(C1:C60)/STDEV(C1:C60).
  3. Work out the downside deviation. For each month, take the shortfall below the target, or 0 if the month beat it. Square each one, average them over every month including the zeros, then take the square root.
  4. Work out the Sortino ratio. Divide the same top line as step 2 by the downside deviation.
  5. Annualise both the same way. Multiply each monthly ratio by √12, and remember the independence assumption.
  6. Write the worst month and the max drawdown next to them. Then work out Sortino ÷ Sharpe and read it against 1.4.

Step 6 is the one most people skip. It is also the one that would have caught Strategy A.

A ratio is a summary of a shape. Before you trust the summary, look at the shape.

Sharpe and Sortino ratio FAQ

What is a good Sharpe ratio?

There is no cut-off that holds across every market, period and method. A ratio only means something next to another ratio worked out the same way: same period length, same risk-free rate and a similar number of months.

Is a higher Sortino ratio always better?

No. A high Sortino ratio built on very few losing months rests on very few data points. Strategy A’s entire downside deviation comes from a single month.

Can a Sharpe ratio be negative?

Yes. If your average return is below the risk-free rate, the top line of the formula is negative, and so is the ratio.

Why does my Sortino ratio differ from an online calculator’s?

Check 2 things: the target return, and whether the tool drops the above-target months from the count. Dropping them is the shortcut the Red Rock paper shows to be incorrect.

Should I use daily, weekly or monthly returns?

Monthly is the common choice for a trader’s own account. Sharpe’s paper recommends fairly short periods such as monthly, then annualising for comparison. Whatever you choose, use the same period for every strategy you compare.

Go deeper

This post sits under our guide to money and risk management. If you would like the routine that fixes your stop and size before every trade, the free 15-Minute Swing Trader’s Checklist is the place to start.


About the author. Spencer Li is The 15-Minute Trader and the founder of Synapse Trading. He is a Certified Financial Technician (CFTe) with 15+ years of trading, run from 70+ countries. He holds a B.Acc and B.BM from SMU. Every trade he takes is public, dated, losses left in. He teaches low-risk swing trading in 15 minutes a day, one system for any market.

Educational content only, not personalised financial advice. Trading carries risk, including loss of capital. Past performance is not indicative of future results. Synapse Trading is not licensed or regulated by MAS.
by Spencer Li
https://synapsetrading.com/wp-content/uploads/2026/10/sharpe-vs-sortino-ratio-card.webp 630 1200 Spencer Li https://synapsetrading.com/wp-content/uploads/2026/10/synapse-logo-horizontal-light.png Spencer Li2026-07-13 17:38:582026-09-16 16:31:45Sharpe Ratio vs Sortino Ratio: What Each One Measures and When They Disagree
Spencer Li

How Much Leverage Should a Beginner Use? Let Your Stop-Loss Decide

Risk & Money Management
How much leverage to use - risk management

Why leverage is a number you read off your position size, with Singapore’s retail margin floors

Published: 16 October 2026 · Last updated: 29 September 2026 · By Spencer Li, CFTe


Picture 2 beginners who open accounts with the same broker on the same day. Both are offered the same leverage. One uses all of it on her first trade, and the other barely touches it. A month later, only one of them still has an account worth talking about, and it is rarely the one who used more.

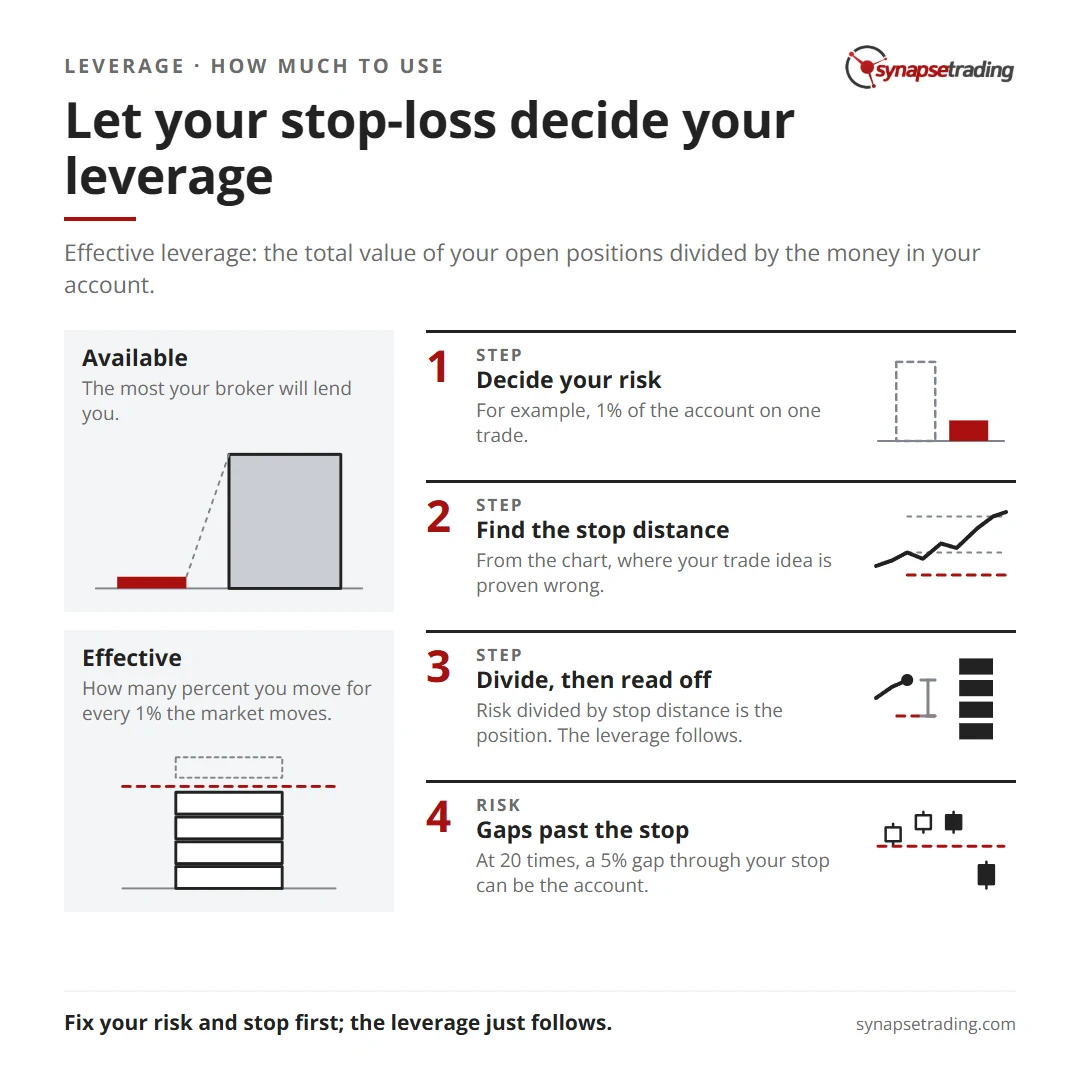
So how much leverage should you use? Less than you think, and you should not pick the number directly at all. Start with how much of your account you are willing to lose on one trade, then the distance to your stop-loss, and let those two decide the position size. The leverage is whatever that position works out to. With a sensible risk per trade and a stop that gives the trade room, it comes out low, and in the worked examples below it never goes above 2 times the account. The maximum your broker allows is a ceiling for emergencies, and it tells you nothing about what is safe.

Below is the arithmetic, what each level of leverage can survive, and the limits Singapore sets for retail traders.

Let your stop-loss decide your leverage. Summary card for the post: How Much Leverage Should a Beginner Use? Let Your Stop-Loss Decide.

What is the difference between available leverage and the leverage you use?

When a broker says you can trade at 20 to 1, that is the most it will lend you. It says nothing about how much you should borrow. If you need a refresher on how margin and leverage ratios work, our post on what leverage is, with a forex example covers the basics.

The number that matters is your effective leverage: the total value of all your open positions divided by the money in your account. Say you have 10,000 in the account and hold positions worth 30,000. Your effective leverage is 3 times, whatever the broker would have let you do.

That number tells you something very plain. It is how many percent your account moves for every 1% the market moves.

Effective leverageA 1% move against you costsThe move against you that wipes out the account
1×1%100%
2×2%50%
5×5%20%
10×10%10%
20×20%5%

At 20 times, a 5% move against you is the whole account. Stock indices can move 5% in a bad week, and a single stock can do it overnight on one piece of news, so at that level you are one ordinary headline away from starting again. That is the table’s real message: high leverage turns ordinary market noise into a matter of survival.

How do you work out the right leverage from your stop-loss?

Here is the method I call the Leverage Readout, because you read the leverage off at the end instead of dialling it in at the start.

  1. Decide your risk per trade. For example, 1% of a 10,000 account is 100. Our post on the 2% money management rule explains how to choose this number.
  2. Find the distance to your stop. This comes from the chart, from the point where your trade idea is proven wrong. Say it is 2% below your entry.
  3. Divide. The position size is the risk divided by the stop distance, so 100 divided by 2% is a position worth 5,000.
  4. Read off the leverage. A 5,000 position on a 10,000 account is 0.5 times. You did not need to borrow anything.

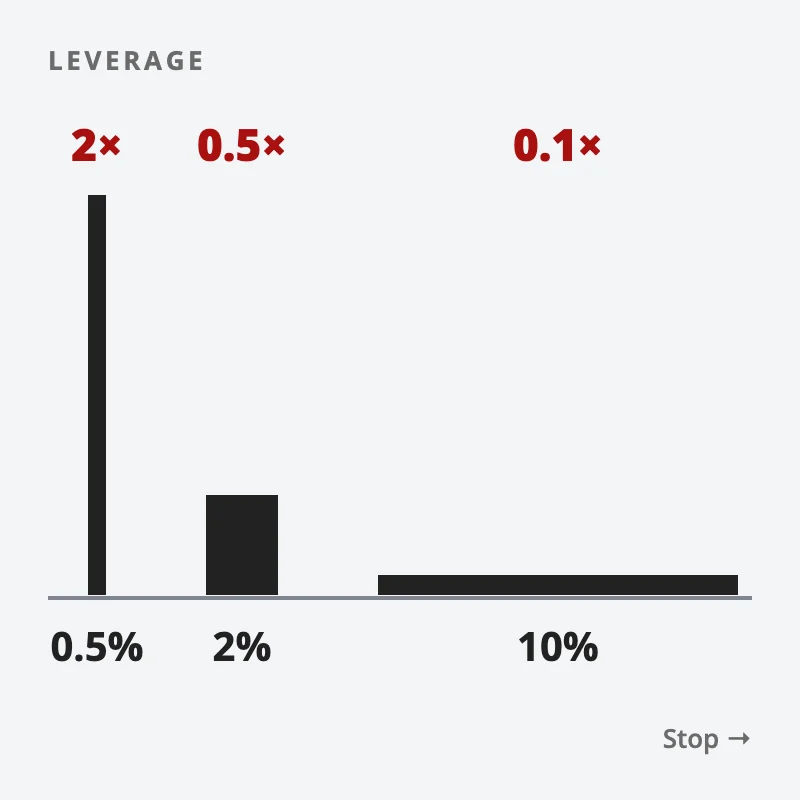
Now change only the stop. A forex trade with a stop 0.5% away gives a position of 20,000, which is 2 times. A wide stop 10% away gives a position of 1,000, which is 0.1 times. In all three cases, if the stop is hit, you lose the same 100.

Three positions with the same risk drawn as boxes of equal area: a 0.5% stop gives 2 times leverage, a 2% stop 0.5 times, and a 10% stop 0.1 times
Fix your risk and stop first; leverage is just what the position works out to.

That is the point worth sitting with. Your loss on a trade is set by your risk per trade and your stop, and the leverage just follows. Traders who blow up usually run it the other way round. They pick a big position because the leverage is available, and then the stop has to be squeezed so tight that ordinary noise knocks them out, or it is left off altogether.

Setting that stop well is its own skill, covered in Entry, Stop-Loss and Target: How to Set All Three.

Our free 15-Minute Swing Trader’s Checklist walks through the stop and the size before every trade, so the leverage takes care of itself. Get the free checklist →

Does the leverage add up across trades?

Yes, and this is where many beginners get caught. Five positions at 1 times each is 5 times in total, and if they are all in stocks that move together, they will all lose together in a sell-off.

So check two numbers before adding a trade. The first is the risk on this one trade. The second is the total value of everything open, divided by your account. If a broad market drop of 10% would cost you half your account, the individual trades may each look careful, and the book as a whole is not.

What leverage can a retail trader get in Singapore?

Singapore sets a floor on how much margin a licensed broker must collect from retail customers on CFDs, which caps the leverage. The rule sits in the Securities and Futures (Financial and Margin Requirements for Holders of Capital Markets Services Licences) Regulations, Fourth Schedule, Table 18.

CFD onMinimum margin (Table 18)Highest leverage that allows
Index stocks“10% for index stocks”10 to 1
Non-index stocks“20% for non-index stocks”5 to 1
Stock indices“5%”20 to 1
Forex“5%”20 to 1
Any other CFD“20%”5 to 1

Even the lowest of those ceilings is far more than the arithmetic above calls for, because a trader risking 1% with a stop that gives the trade room rarely needs more than a small part of it. If you want to know how CFDs themselves work, our post on understanding CFDs explains the product.

What can go wrong even with a stop-loss?

Three things, and each one gets worse as leverage rises.

Gaps. A stop-loss becomes a market order when it is hit, so if the market opens well past your stop, you are filled at the opening price. At 1 times, a 5% gap through your stop is an annoyance. At 20 times, it can be the account.

Margin calls. If losses push your account below the broker’s maintenance level, the broker can ask for more money or close your positions for you, at whatever price is available. The exact levels differ by broker, so read your own broker’s margin page before you trade.

Financing costs. Leveraged positions held overnight, such as CFDs, usually carry a daily financing charge. On a swing trade held for weeks, that cost eats into every result, win or lose.

None of these are rare events. Over a few hundred trades you will meet all three, and the amount of leverage you were carrying on that day decides whether it was a bad week or the end of the account. The maths of that is in Risk of Ruin: How to Work It Out.

Take a minute to add up your effective leverage across everything you hold right now. And if the market opened 5% lower tomorrow, how much of your account would still be there by lunchtime?

FAQ

How much leverage should a beginner use?

As little as your position sizing calls for, which is usually far below what the broker offers. Size each trade from your risk per trade and your stop distance, and treat the leverage as the result rather than a setting.

Is 1:100 leverage good for beginners?

It is far more than a beginner needs, and in Singapore a licensed firm cannot offer retail customers more than 20 to 1 on forex CFDs under Table 18. At 100 to 1, a 1% move against you is the whole account.

What is effective leverage?

Effective leverage is the total value of all your open positions divided by the money in your account. It tells you how many percent your account moves for every 1% the market moves.

Does using a stop-loss make high leverage safe?

No. A stop-loss caps the planned loss, but a gap past the stop fills at the next available price, and with high leverage that gap can be larger than your account.

What is a margin call?

It is your broker asking for more money because losses have pushed your account below its maintenance level. If you do not add funds, the broker can close your positions for you.

Go deeper

This post sits under our guide to money and risk management. If you would like the routine that fixes your stop and size before every trade, the free 15-Minute Swing Trader’s Checklist is the place to start.


About the author. Spencer Li is The 15-Minute Trader and the founder of Synapse Trading. He is a Certified Financial Technician (CFTe) with 15+ years of trading, run from 70+ countries. He holds a B.Acc and B.BM from SMU. Every trade he takes is public, dated, losses left in. He teaches low-risk swing trading in 15 minutes a day, one system for any market.

Educational content only, not personalised financial advice. Trading carries risk, including loss of capital. Past performance is not indicative of future results. Synapse Trading is not licensed or regulated by MAS.
by Spencer Li
https://synapsetrading.com/wp-content/uploads/2026/10/how-much-leverage-card.webp 630 1200 Spencer Li https://synapsetrading.com/wp-content/uploads/2026/10/synapse-logo-horizontal-light.png Spencer Li2026-07-10 09:34:332026-09-29 12:14:43How Much Leverage Should a Beginner Use? Let Your Stop-Loss Decide
Spencer Li

Is Averaging Down a Good Strategy? What the Lower Average Price Hides

Risk & Money Management
Is averaging down smart? - risk management

One falling stock, worked through three ways, and the test to run before you add

Published: 16 October 2026 · Last updated: 28 August 2026 · By Spencer Li, CFTe


You have probably done this at least once. You buy a stock, it falls 20%, and a voice says that if you liked it at 50, you should love it at 40. So you buy more, and your average price drops to 45. It feels clever, because now the stock only has to bounce a little for you to break even.

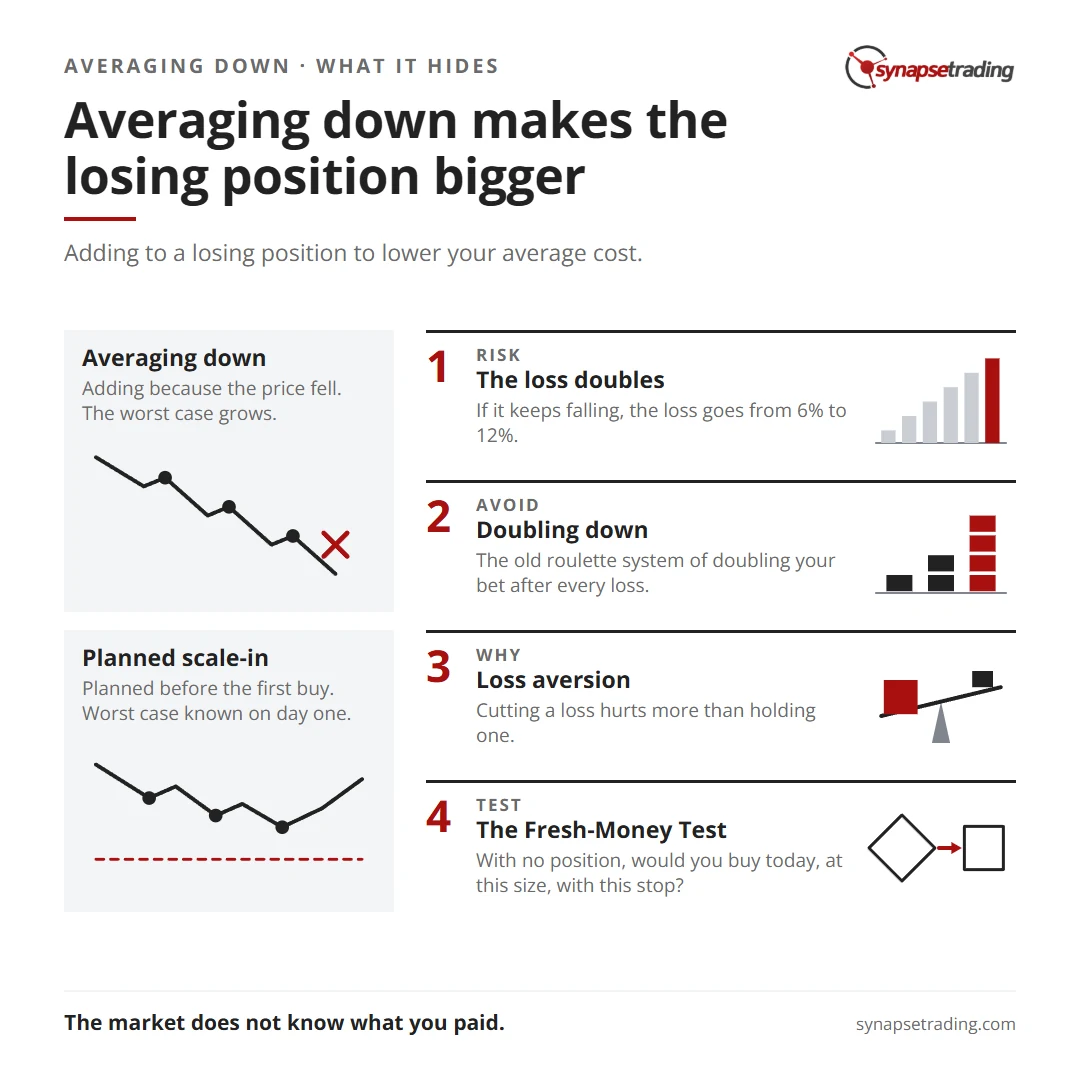
Averaging down means adding to a losing position to lower your average cost. As a trading strategy, it is a poor one. It makes the position bigger at exactly the moment the market is telling you your idea may be wrong, so a lower average price comes with a larger loss if the stock keeps falling. The comfort of a nearer break-even is real. The risk is larger, and it is usually invisible until it is too late. The one version that holds up is a scale-in planned before the first purchase, with the total risk fixed in advance, and that is a different thing from adding because the price fell.

Below is the arithmetic on one falling stock, why it feels so right, and a simple test to run before you add.

Averaging down makes the losing position bigger. Summary card for the post: Is Averaging Down a Good Strategy? What the Lower Average Price Hides.

What happens to your risk when you average down?

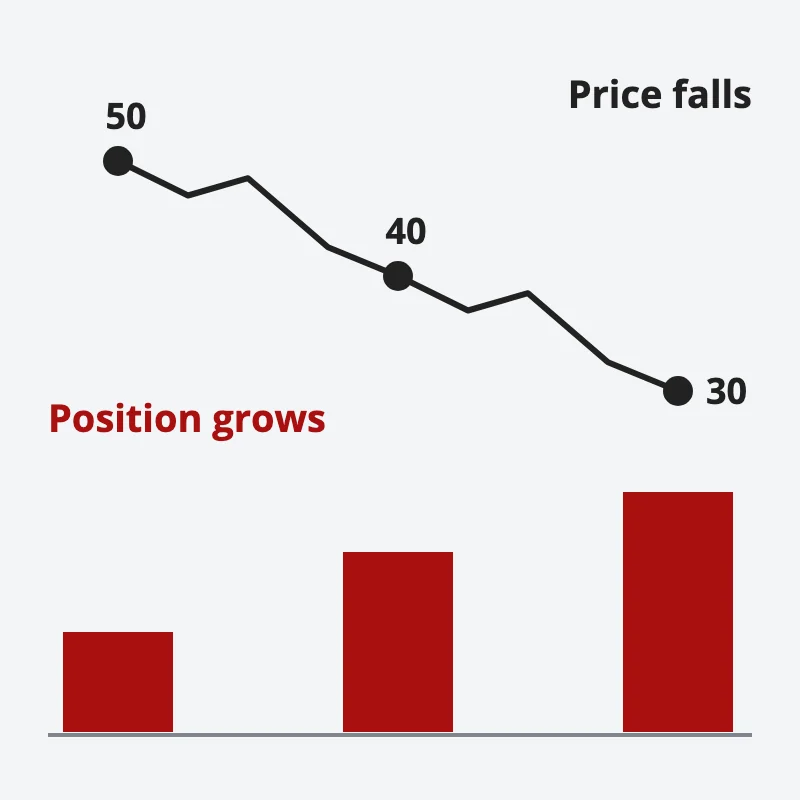
Here is a hypothetical, in round numbers. You put 10% of your account into a stock at 50. It falls to 40, and you buy the same number of shares again. It falls to 30, and you buy again.

After buying atMoney in the stockAverage priceRise needed to break evenLoss if it then falls to 20
50 only10% of account50(at 40) 25%6% of account
50 and 4018% of account45(at 40) 12.5%10% of account
50, 40 and 3024% of account40(at 30) 33.3%12% of account

Look at the third column. It is the one that makes averaging down feel good, because the break-even keeps getting closer.

Now look at the last column, because that is the one that decides your year. The stock is falling the whole time, and with each purchase you are carrying more of it. The loss if it slides to 20 doubles, from 6% of the account to 12%. And the money tied up in a single falling stock has gone from a tenth of the account to almost a quarter.

A stock price stepping down from 50 to 40 to 30 with a buy at each level, while red bars show the money in the stock growing with every buy
Averaging down lowers your average price but makes the losing position bigger each time.

Nothing obliges the stock to come back to your price, either. The market does not know what you paid.

Why does doubling down feel even better, and end even worse?

Some people go one step further and double the number of shares on each add, to pull the average down faster. Same stock, same path.

After buying atShares (in units)Money in the stockAverage priceLoss if it then falls to 20
50110% of account506%
401 + 226% of account43.3314%
301 + 2 + 450% of account35.7122%

Half the account is now in one stock that has fallen 40%. If it goes to 20, more than a fifth of everything you own is gone, from a trade that started as a 10% position.

Anyone who has been to a casino will know this pattern. It is the old roulette system of doubling your bet after every loss, so that the first win recovers everything. It works beautifully, right up to the run of losses that hits the table limit or the bottom of your wallet, which is why casinos are quite happy to let people play it all night. A trader who averages down is running the same system, except the market has no table limit, and the losing run can be as long as it likes. If you want the casino comparison the right way round, our post on whether trading is gambling explains how to be the house instead.

Our free 15-Minute Swing Trader’s Checklist puts your stop and your size on paper before the trade, so the decision to add never has to be made in a panic. Get the free checklist →

Why does averaging down feel so right?

Because cutting a loss hurts more than holding one. Selling turns a paper loss into a real one, and most of us will do a lot to avoid that feeling. Our post on loss aversion bias covers why a loss weighs on us roughly twice as much as a gain of the same size.

Averaging down offers a way out of that pain. Instead of admitting the trade was wrong, you get to tell yourself it is now an even better trade, so the fear goes quiet for a while and hope takes over. That is the moment the trade stops being a plan and becomes a story you are telling yourself. The psychology of the stoploss goes deeper into why cutting losses is so hard.

There is also a maths trap underneath the feeling. Losses and gains are not symmetrical.

If the position fallsIt needs to rise this much to get back
10%11.1%
20%25%
50%100%
75%300%

Every dollar you add on the way down is a dollar that is exposed to the deep end of this table. And a few deep losses in a row is how accounts get wiped out, which is what Risk of Ruin: How to Work It Out is about.

Is there ever a right way to add to a losing position?

The point is not that adding to a position is always wrong. It is that the decision to add has to be made before the first share is bought, and never because the price fell.

Some traders plan to build a position in 2 or 3 parts. They decide in advance how many parts, at roughly which prices, and where one stop-loss sits for the whole position. Then they size it so that if every part fills and the stop is hit, the total loss is still the amount they planned to risk on the trade. That planned amount is what the 2% money management rule is about. The adds are smaller because the plan already counted them.

The difference is easy to spot. In a planned scale-in, the worst case is known on day one and never changes. In averaging down, the worst case grows each time you buy.

Long-term investors who put the same amount into a broad index fund every month are doing something different again. They are buying a whole market on a schedule, with no single company that can go to zero, and no thesis that a price drop has broken. That is a separate game with its own rules, covered in our guide to building your investment portfolio.

The Fresh-Money Test

So how do you tell, in the moment, whether you are adding for a good reason or a bad one? Here is a test I call the Fresh-Money Test.

Imagine you had no position in this stock at all, and the cash was sitting in your account. Would you buy this stock today, at this price, at this new total size, with your stop where it is now?

If the answer is yes, and the plan said so before you started, then you are following a plan. If the answer is no, or you notice you are mostly hoping to get back to break-even, then the only reason to buy more is the price you paid earlier. And the market has never cared about that number.

So the next time a position goes against you, which number will you look at first: your average price, or the loss you would take if the stock kept falling? And if you could only keep one of those two numbers on your screen, which one would protect you?

FAQ

What does averaging down mean?

Averaging down means buying more of a stock after its price has fallen, which lowers your average cost per share. It also increases the size of a position that is already losing.

Is averaging down a good strategy?

For a trader, usually not. It lowers your break-even price but increases the loss if the price keeps falling, and it tends to grow the position at the moment the trade is proving wrong.

What is the difference between averaging down and dollar-cost averaging?

Averaging down adds to one losing position because the price fell. Dollar-cost averaging invests a fixed amount on a fixed schedule, usually into a broad index, whatever the price is doing.

Is it ever OK to add to a losing trade?

Only when the adds were planned before the first entry, with one stop for the whole position and a total risk fixed in advance. Adding just because the price dropped is not that plan.

Why do traders average down?

Mostly to avoid the pain of taking a loss. A lower average price makes the trade feel closer to breaking even, which quietens the fear for a while, and that is exactly what makes it risky.

Go deeper

This post sits under our guide to money and risk management. If you would like a routine that settles your stop and size before you are under pressure, the free 15-Minute Swing Trader’s Checklist is the place to start.


About the author. Spencer Li is The 15-Minute Trader and the founder of Synapse Trading. He is a Certified Financial Technician (CFTe) with 15+ years of trading, run from 70+ countries. He holds a B.Acc and B.BM from SMU. Every trade he takes is public, dated, losses left in. He teaches low-risk swing trading in 15 minutes a day, one system for any market.

Educational content only, not personalised financial advice. Trading carries risk, including loss of capital. Past performance is not indicative of future results. Synapse Trading is not licensed or regulated by MAS.
by Spencer Li
https://synapsetrading.com/wp-content/uploads/2026/10/averaging-down-card.webp 630 1200 Spencer Li https://synapsetrading.com/wp-content/uploads/2026/10/synapse-logo-horizontal-light.png Spencer Li2026-07-02 22:47:172026-08-28 13:58:11Is Averaging Down a Good Strategy? What the Lower Average Price Hides
Page 2 of 6‹1234›»

Free checklist

The 15-Minute Swing Trader’s Checklist

The daily and weekly routine I use to find, manage and review trades in about 15 minutes a day, on the record since 2014.

Get the free checklist

Topics

  • Trading foundations
  • Technical analysis
  • Strategies and systems
  • Risk and money
  • Trading psychology
  • Markets and products

Synapse Trading

Swing trading for busy professionals, in 15 minutes a day.

Start free

Learn

  • Start here
  • Free trading guides
  • Blog
  • Tools and resources

Programs

  • Trading Mastery Program
  • Daily trading signals
  • Student results
  • Public trade log

Company

  • About
  • Contact me
  • Partnerships
  • Disclaimer
  • Privacy policy
  • Terms & Conditions

Synapse Trading Pte Ltd
Registration No. 201316168H
WhatsApp +65-8897-1204
info@synapsetrading.com

Contact Us

Synapse Trading Pte Ltd
Registration No. 201316168H

Whatsapp: +65-8897-1204
Telegram: @iamrecneps
Email: info@synapsetrading.com

Links

Disclaimer
Privacy policy
Terms & Conditions
Contact us
Partnerships

© 2012-2026 Synapse Trading | All rights reserved. Educational content only, not personalised financial advice. Trading carries risk, including loss of capital. Past performance is not indicative of future results. Synapse Trading is not licensed or regulated by MAS.
  • Link to Facebook
  • Link to X
  • Link to Instagram
  • Link to Youtube
  • Link to LinkedIn
  • Link to Mail
Scroll to top Scroll to top Scroll to top