Market analysis, insights and trading ideas on various markets and products!

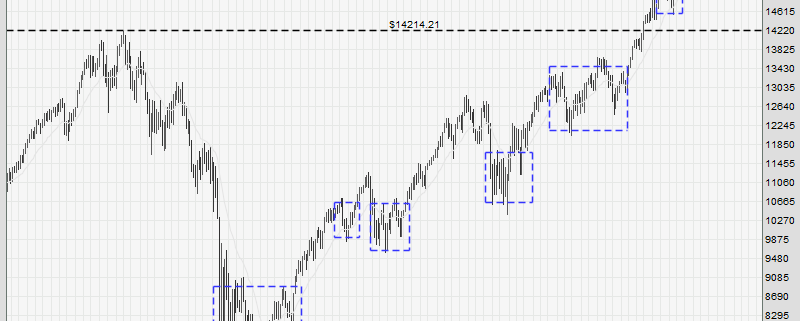
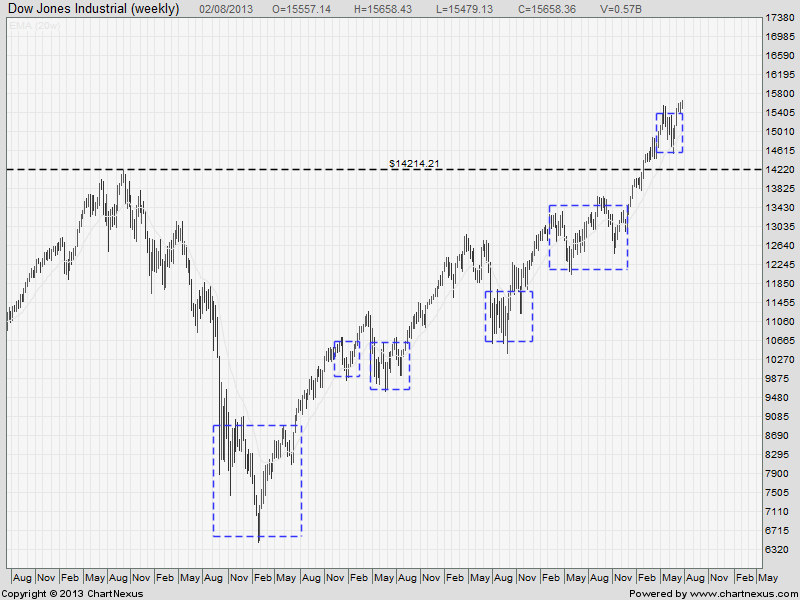
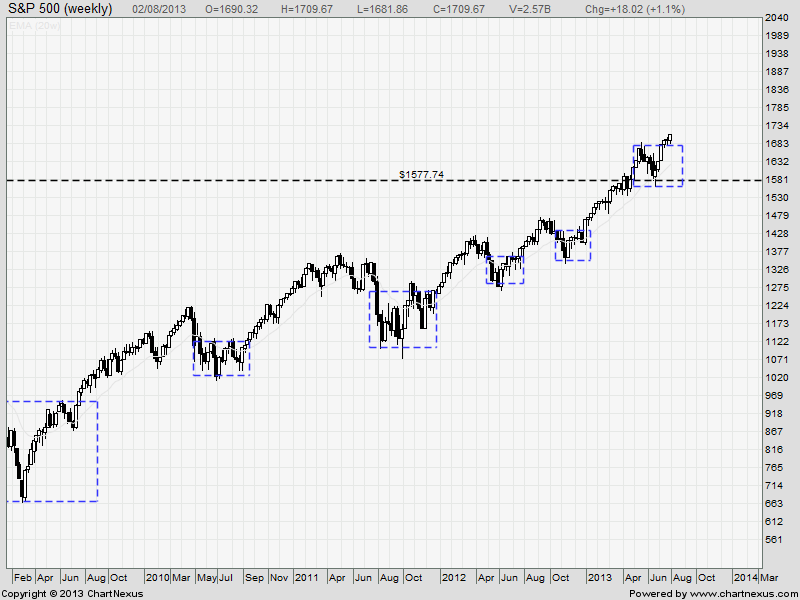
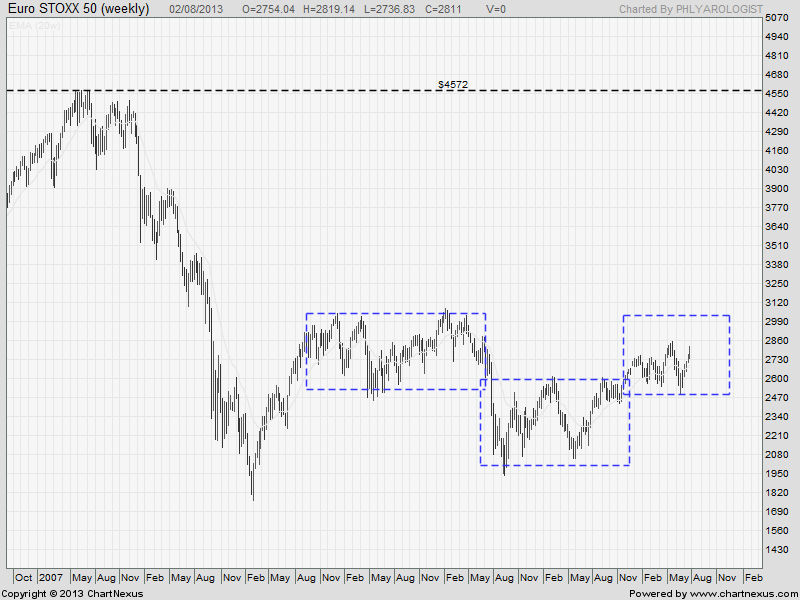
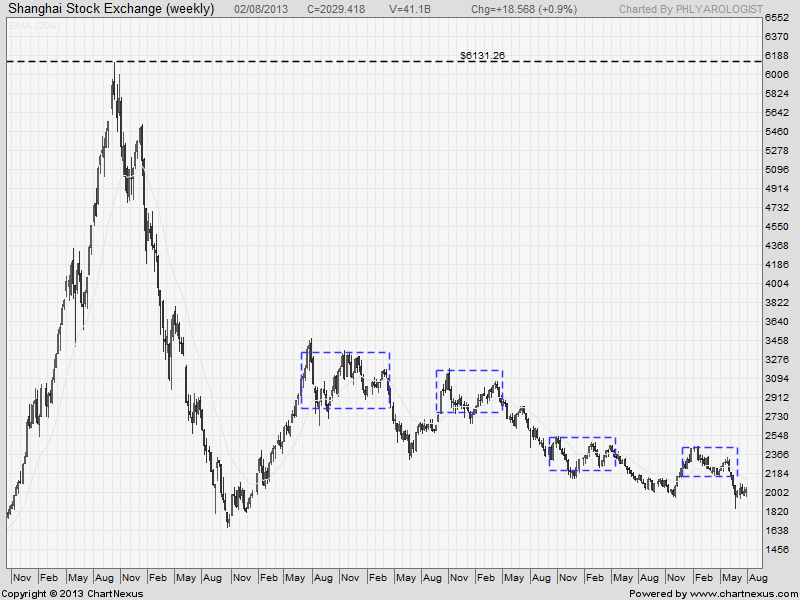
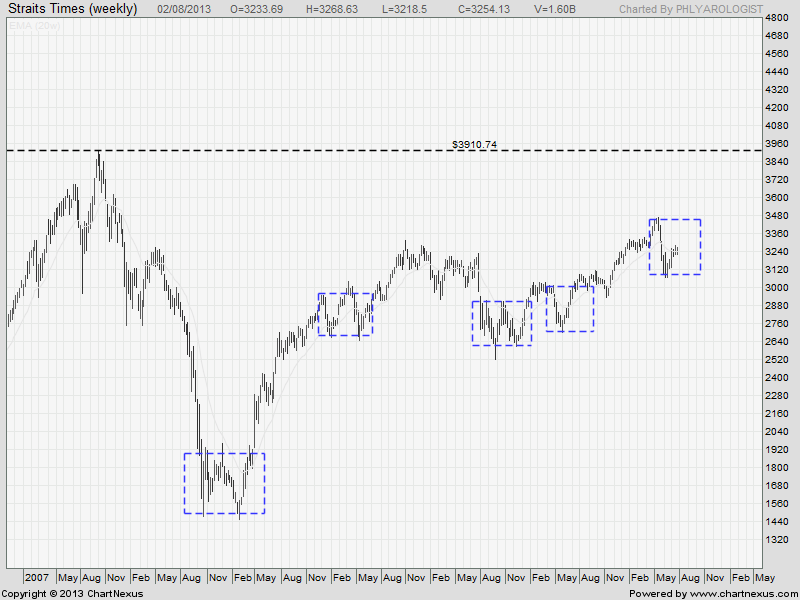
I have chosen 5 weekly charts to provide an overview of the global markets, and to see where we are likely to be heading next. The black horizontal line denotes the 2007 highs, to provide a reference point for comparison. The blue boxes indicate key behavioral clues for us to read and time the markets.

First off, we can see that the US markets are the strongest, surpassing the 2007 highs, and looking poised to push even further.

^dji 020813

^gspc 020813

Next, we move on to the European markets, which have not recovered much. The decline has been plugged, but instead of recovery, all we see is a slow chugging movement elucidated by a prolonged sideways market.

^stoxx 020813

Nearer to home, the China markets have been extremely weak, continuing an aimless drift downwards. It does not look like it would be recovering any time soon.

^sse 020813

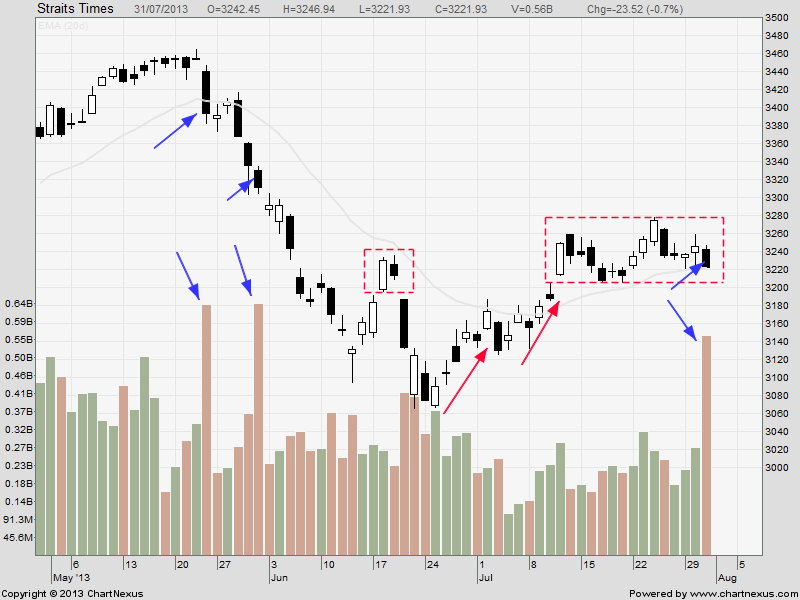
Lastly, this is the chart of the STI, straddling the middle ground between the strong US markets and the weak China/Europe markets. Since we have already recovered by more than 50%, I believe there is a good chance we will make a push to test the 2007 highs.

^sti 020813

Currently, I am still holding on to my long positions, which are already deep in the money, and recently initiated some short positions. Here are the previous documented posts:
https://synapsetrading.com/sti-banks-signs-of-cracking/
https://synapsetrading.com/sembmar-a-surreptitious-change-of-hands/

On Tuesday, I will be sharing more at my live event, and you can drop by if you have any questions about the market. Actually, the event is already sold out, but if you don’t mind standing, or taking the chance that some people might not turn up, you can still drop by to avoid missing out on this event.
http://www.eventbrite.sg/event/7582887621?ref=ecal

To get priority updates on our future events, you can sign up for our mailing list,
and also “like” us on facebook.
https://www.facebook.com/synapsetrading
http://forms.aweber.com/form/18/2028118318.htm


Wow, another exciting day of shorting and raking in profits. As I explained to some new traders today, there are 2 kinds of positions – the intraday trades and the overnight positions. Both require a different mentality and strategy to trade.

Most people get confused by trying to both at the same time, often with dismal results.

Most people who started off trading stocks (many of our students also trade SGX stocks, and so do I) initially tried to use traditional methods like indicators, which you might get away with for long-term stock trades, but for intraday trading, speed and precision is more refined.

After using such precise techniques, you will find the timing of your stock trades dramatically enhanced as well.

As you can see from the charts below, these timely shorts can easily be spotted on blank charts, and executed quickly without the confusion of numerous conflicting indicators and signals.

2013-07-31 16.56.35

2013-07-30 17.01.35

forum screenshot 020813 2

2013-07-31 20.27.25

forum screenshot 020813 1

2013-07-31 20.28.13

2013-07-30 16.10.48

2013-07-30 16.09.41

At a cursory glance, the STI is still pretty strong, having had 2 legs up and forming a price cluster after surpassing the prior swing high.

However, a more astute scrutiny unveils potential new sellers stepping in, judging by the sudden large increase in supply volume.

Banks like DBS and OCBC are also exhibiting similar signs, but since both are advancing steadily in a tight channel, the buyers are still controlling the market, and I will continue to hold my long positions.

I will be trailing my stops to protect my profits, and watching for further signs of proverbial cracking. For those who desire a more detailed understanding of how this behavioral analysis works, there might still be a few seats left for our free sharing session next Tuesday.

^sti 310713

d05 310713

o39 310713

About a week ago, I shared this chart of Vard which was making historical lows. Buyers of all timeframes, techniques and indicators will no doubt notice this, given rise to a confluence of wills.

After breaking new lows, buyers immediately stepped in due to the vacuum effect, pushing price up 6.4% today. The skill, of course, is spotting it before it happens and anticipating the move, which we did as shown in the screenshot below.

ms7 300713 2

ms7 300713

Today, I decided to try something new, and invited some of my ex-students and program graduates to trade live with me. Since this was just the beginning, I did not want such a big group, and I wanted them to experience first-hand the taste of profits from full-time trading.

2013-07-29 17.16.09

2013-07-29 17.16.20

All set up, and ready to trade!

2013-07-29 17.16.33

2013-07-29 17.57.35

Real accounts and real trades

2013-07-29 18.07.52

Taking a break 🙂

2013-07-29 20.02.02

At 8.02pm, before setting off for dinner, we have already locked in our positions for EUR/USD & AUD/USD, and we are just waiting for the trade to play out and reach our TP. There is no need to keep watching the screen once our SL & TP are in place.

2013-07-29 20.46.16Dinner treats: Sashimi, Sake & Umeshu

2013-07-29 21.23.28

2013-07-29 21.23.47

At 9:23pm, we had already finished dinner, and we took a few minutes to observe our profits grow and learn how to manage the trade. When I reached home, I realised that my TP had been hit, and I am going to call it a day and be happy with my profits for the day.

If one can be consistent like today and get 50-70 pips daily, trading 2-3 standard lots will allow you to make what a typical person earns each month in their 9-to-5 job. It is definitely not easy to get there, and the path is challenging, but if you take the effort to master the skills, the rewards are definitely worth your hard work!