I just got back from one month of travelling in Eastern Europe, and I’m glad to see some progress on the trade war resolution.
The US and China finally agreed on Phase One of the trade deal on Friday (Dec 13), including immediate cuts on import tariffs.
This is good news for Trump who is now battling impeachment, and with his 2020 reelection campaign coming up, he needs to give voters some small wins.
If this deal was not reached, a new round of tariffs on consumer electronics like cell phones and computers would have kicked in on Sunday.
As a sweetener, the US will also slash in half the 15% tariffs imposed on US$120 billion of Chinese goods that were imposed on Sep 1 previously.

However, existing tariffs of 25% on US$250 billion of Chinese imports would stay in place pending further negotiations on a second phase deal.
In return, China is committing to increasing purchases in four sectors: Agriculture, manufacturing, energy, and services.
In a sign that tensions remain high, Foreign Minister Wang Yi accused the US of “suppressing” China in a number of fields, including the economy, trade and technology and had “seriously damaged the foundation of hard-earned trust between China and the US.”
The US also angered Beijing by backing Hong Kong’s pro-democracy movement and criticising China’s mass detention of mostly Muslim minorities in the northwest region of Xinjiang.

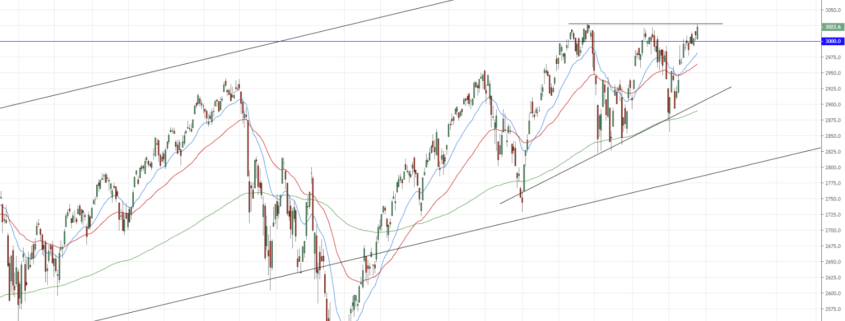
Looking at the chart of the S&P 500, stocks have continued to climb even during the trade war, which shows that the uptrend is still very strong.
Now that we are at the top of the trend channel, we might see some correction to the middle or bottom of the channel.
If there are no major political surprises or escalation of the trade war, then we might even see a Christmas rally before the year end.
Overall, I would be looking to invest in high growth US stocks.
Spencer is an avid globetrotter who achieved financial freedom in his 20s, while trading & teaching across 70+ countries. As a former professional trader in private equity and proprietary funds, he has over 15 years of market experience, and has been featured on more than 20 occasions in the media.