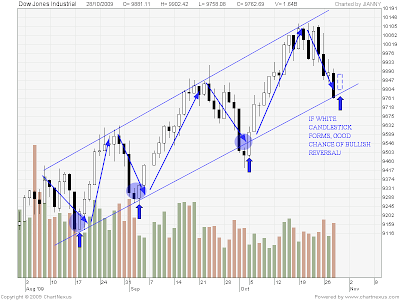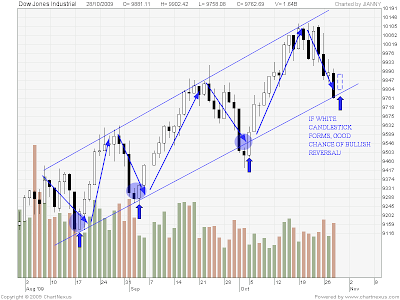
A similar-looking pattern suggests a lot of upside, especially if it finds support at the W-pivot and both EMAs. Please ignore the volume, it’s not working right for this index. Based on the length of this pattern, we could be seeing upside moves of beyond 12,000. Be ready to start buying!
Spencer is an avid globetrotter who achieved financial freedom in his 20s, while trading & teaching across 70+ countries. As a former professional trader in private equity and proprietary funds, he has over 15 years of market experience, and has been featured on more than 20 occasions in the media.


