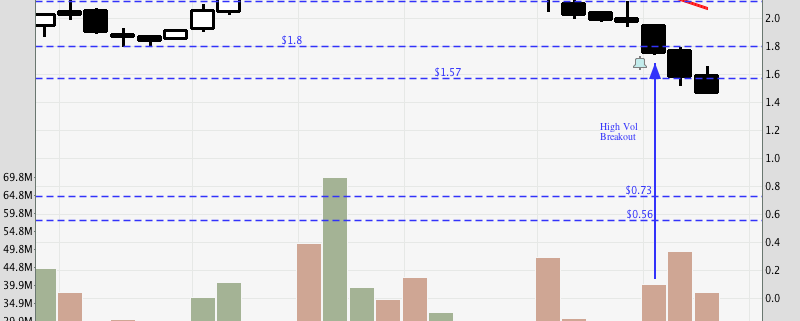
This is the weekly chart of Sakari, and we can see that it has had 10 consecutive weeks of decline. This shows that it is obviously on a downtrend, although the possibility of a pullback is quite high seeing how extended the move is. That said, new lows are expected after the pullback, since the support of 1.57 has been broken. The next support I can find is at 0.73, but that is very far, so a trailing stoploss is recommended instead if one chooses to short on the pullback. I will be watching it closely.
Spencer is an avid globetrotter who achieved financial freedom in his 20s, while trading & teaching across 70+ countries. As a former professional trader in private equity and proprietary funds, he has over 15 years of market experience, and has been featured on more than 20 occasions in the media.

