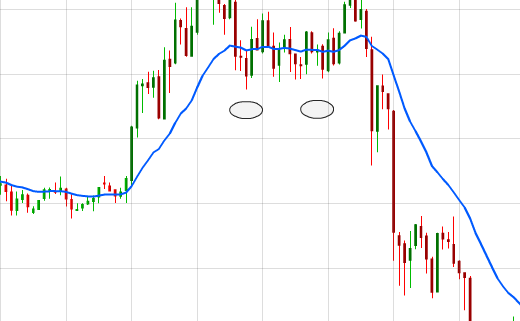
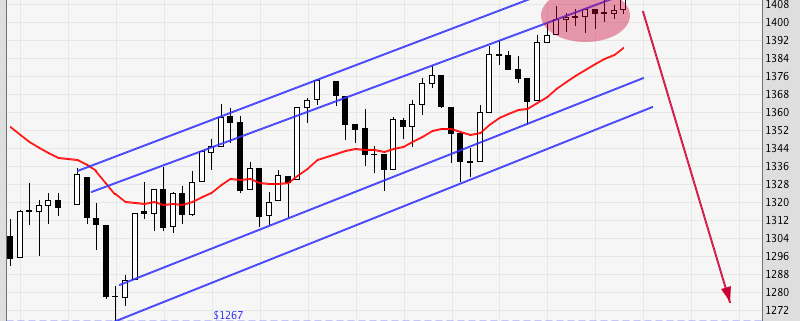
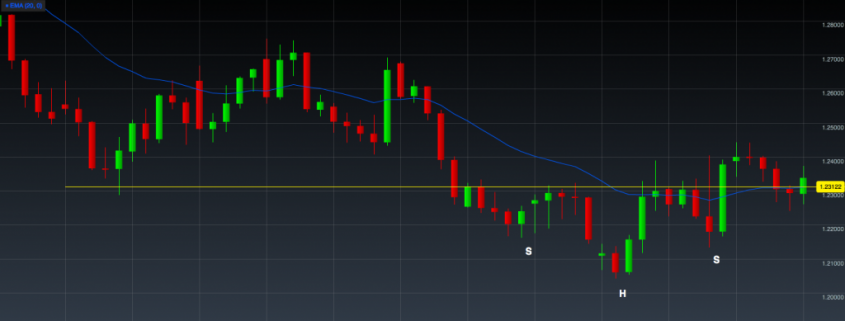
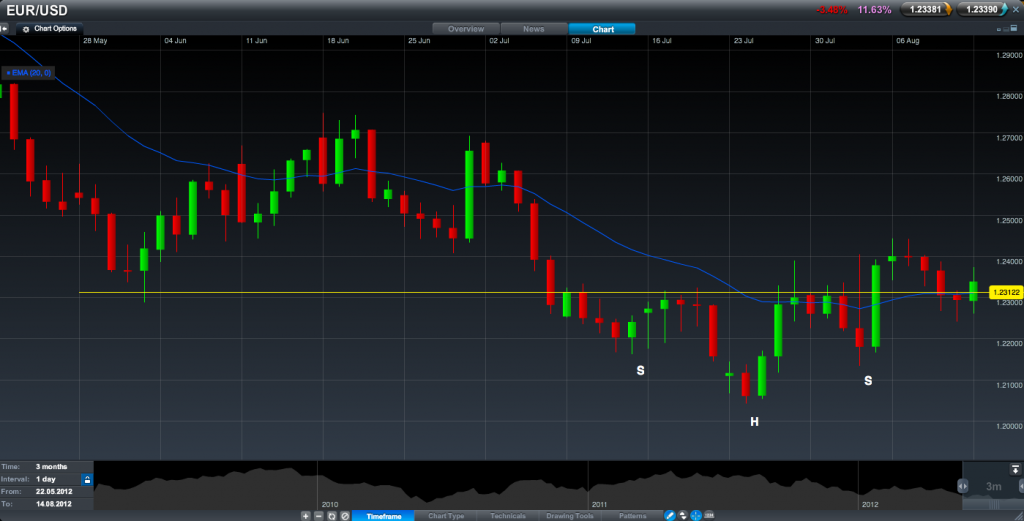
I’m not kidding, there really is such a pattern.
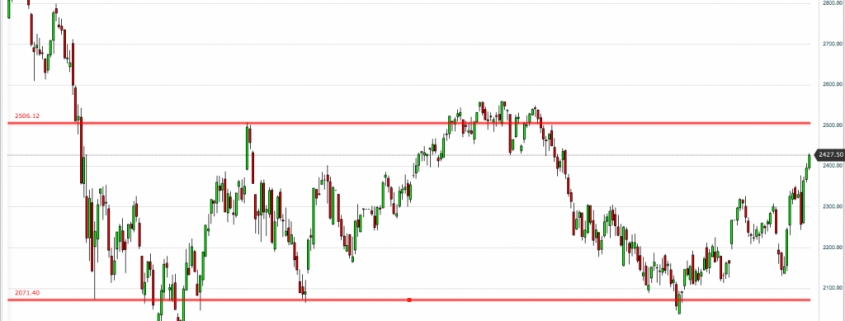
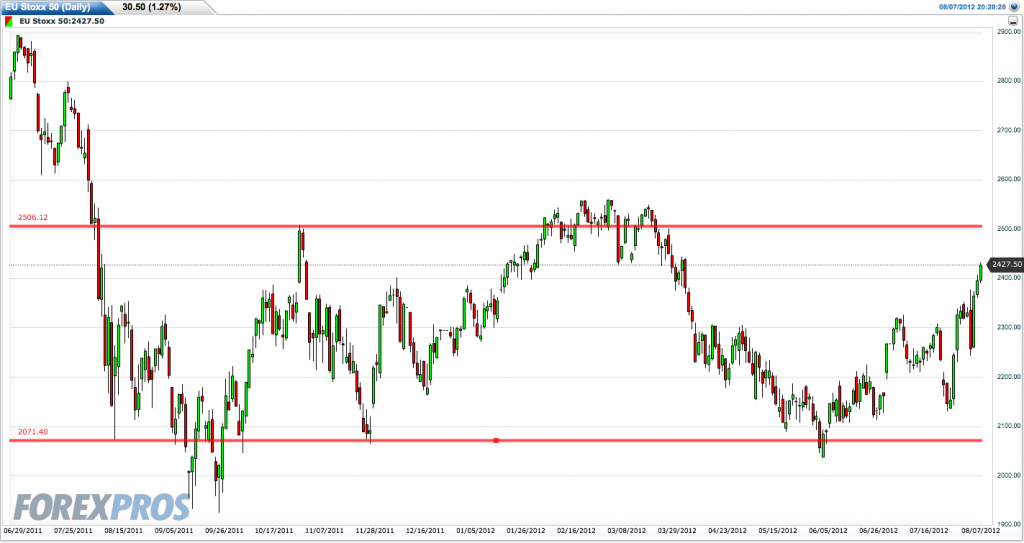
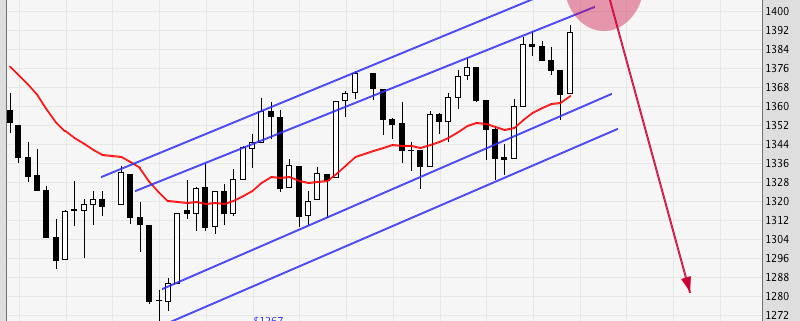
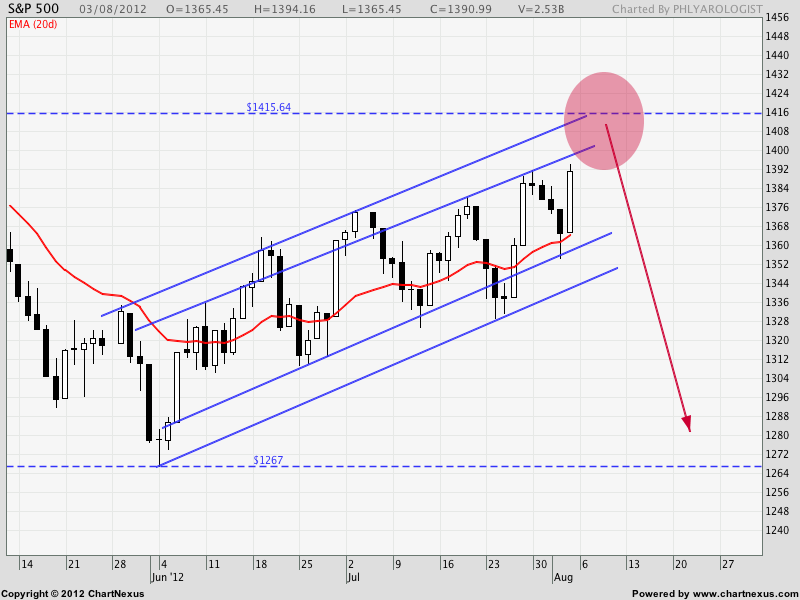
The Batman pattern, or Batman’s cowl, is aptly named after the shape of the helmet donned by the said superhero. Some say that it is a variant of the double top pattern, and can be traded the same way.
On a sidenote, this dark knight did stage a strong rise later in the US session, retracing the drop during the Europe session and heading to test the previous swing high.
Spencer is an avid globetrotter who achieved financial freedom in his 20s, while trading & teaching across 70+ countries. As a former professional trader in private equity and proprietary funds, he has over 15 years of market experience, and has been featured on more than 20 occasions in the media.

