CapitaLand – triangle breakout | Technical Analysis | Singapore Stocks

Weekly AMA on Instagram - Ask me anything about trading & investing, stock picks, market analysis, etc!

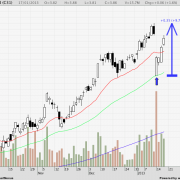
This is indeed a breakout from triangle formation. Some might argue its an ascending triangle due to the obvious double top peaks formed earlier but either way of looking at it is fine. I have drawn it as a symmetrical triangle in the attachment for easy reference. As for the price target, you actually look at the apex of triangle and apply the 2/3 RULE. That is to say that you draw the arrow taking the apex of the triangle as a reference point and count back 2/3 of the time frame. The price objective would then be the breakout price + height of base.
 New to Trading? Make your first live trade today in this workshop! Meet Spencer live for 3 hours of hands-on training! No prior experience required! Learn all the basics of trading, and step-by-step guidance to make your first trade!
 If you're looking for the best trading opportunities every day across various markets, and don't want to spend hours doing the research yourself, check out our private Telegram channel!
Spencer is an avid globetrotter who achieved financial freedom in his 20s, while trading & teaching across 70+ countries. As a former professional trader in private equity and proprietary funds, he has over 15 years of market experience, and has been featured on more than 20 occasions in the media.


Leave a Reply
Want to join the discussion?Feel free to contribute!