

Using Technical Indicators to Develop Trading Strategies
Want the daily routine? Get the free 15-Minute Swing Trader’s Checklist. Get it free →
Indicators, such as moving averages and Bollinger Bands®, are technical analysis tools used by traders and investors to analyze past price trends and anticipate future price patterns.
Fundamentalists focus on economic data or corporate profitability, while technical traders rely on charts and indicators to interpret price moves.
The primary goal of using indicators is to identify trading opportunities.
For example, a moving average crossover can signal an upcoming trend change.
Applying an indicator to a price chart allows traders to spot where the trend may weaken or reverse, creating potential trading setups.
Technical strategies typically use indicators to define specific rules for entry, exit, and trade management.
These strategies often combine multiple indicators to pinpoint the best times to trade and establish objective decision-making rules.
Indicators
There are various technical indicators available for traders, including widely used tools like moving averages or stochastic oscillators.
Some indicators are publicly available, while others are proprietary, developed by traders or programmers.
Most indicators have user-defined variables, such as the “look-back period,” which allows customization based on the trader’s needs.
For instance, a moving average might calculate a stock’s price over a specific period, such as 50 or 200 days.
The length and price points used in the calculation can be adjusted by the user to fit their trading style.
Strategies
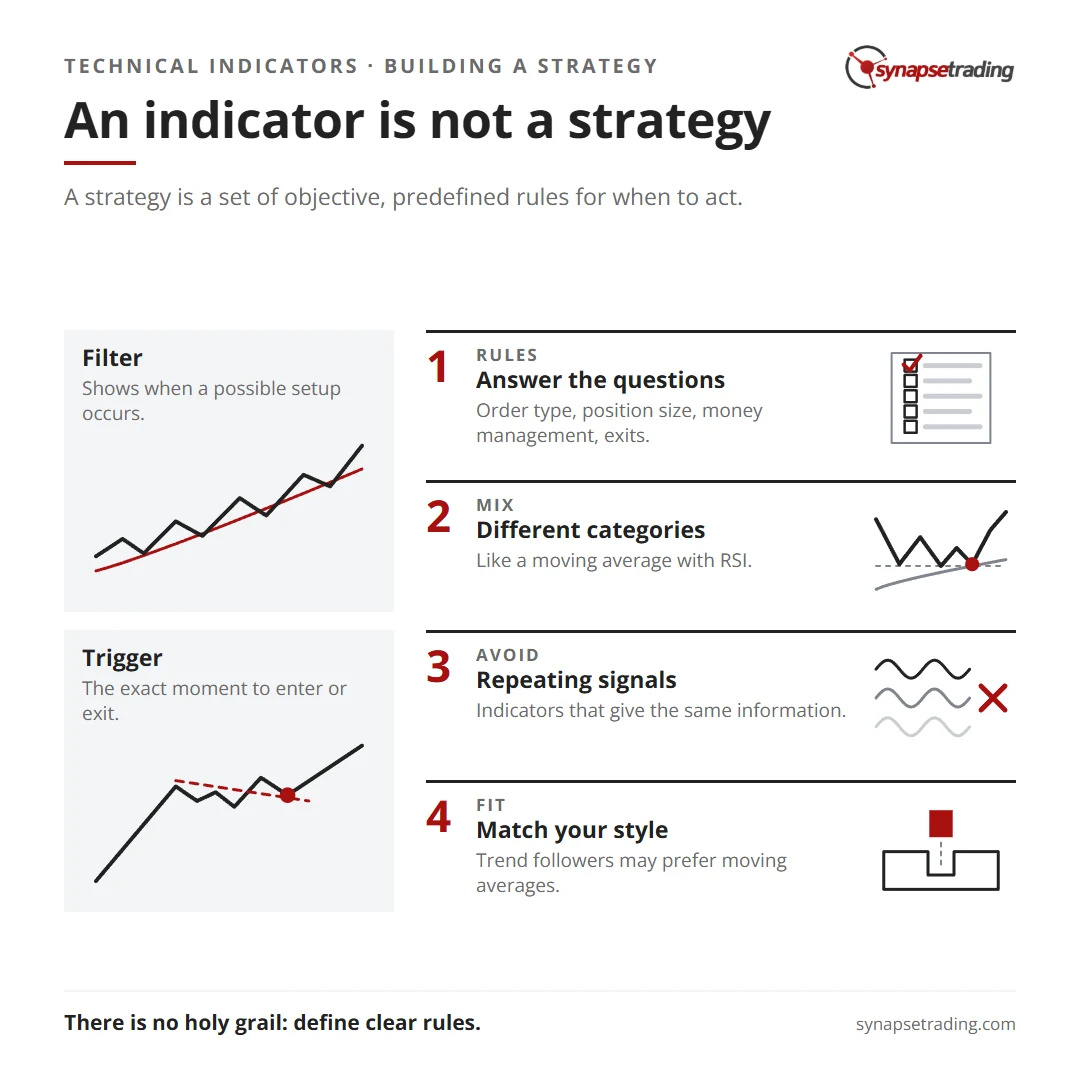
A strategy is a set of objective, predefined rules for when a trader will take action.
It includes trade filters and triggers, often based on technical indicators.
A trade filter identifies when a potential setup occurs, while the trade trigger defines the exact moment to enter or exit a trade.
For example, if a stock closes above its 200-day moving average, this could set the stage for a trade trigger if the stock rises one tick above the high of the bar that broke the moving average.
A well-defined strategy addresses critical questions, such as:
- What type of moving average will be used?
- How far above the moving average should the price move to trigger a trade?
- What kind of order will be placed?
- How will position size be determined?
- What are the money management and exit rules?
Without answering these questions, strategies may be too simplistic and not actionable.
Using Technical Indicators
Indicators themselves are not strategies.
While they help traders identify market conditions, a strategy outlines specific actions to take.
Combining multiple indicators from different categories—such as momentum, trend, or volume indicators—can improve a strategy’s reliability.
For example, using a moving average in conjunction with a momentum indicator like the Relative Strength Index (RSI) might confirm the validity of a signal.
By employing indicators from different categories, traders avoid multicollinearity, where multiple indicators provide the same information, leading to redundant or misleading signals.
Choosing Indicators to Develop a Strategy
The choice of indicators depends on the type of strategy a trader wants to develop.
A trend-following trader may prefer using trend indicators like moving averages, while a trader looking for frequent small gains might opt for volatility-based indicators.
Traders can also purchase black-box systems that have already been researched and backtested, but these proprietary systems typically don’t disclose the underlying methodology, limiting the trader’s ability to customize the strategy.
Concluding Thoughts
While indicators are essential tools in technical analysis, they do not create trading signals on their own.
Traders need to define clear rules for how indicators will be used in a strategy, ensuring objective decision-making for when to enter and exit trades.
There is no “holy grail” strategy that guarantees success.
Each trader must develop their approach based on their unique style, risk tolerance, and understanding of the markets.
By learning about different technical analysis tools, traders can refine their strategies to improve their trading performance.
Want the daily routine? Enter your email for the free 15-Minute Swing Trader's Checklist.
Free 5-page PDF, then occasional trading emails. Education only, not financial advice. Unsubscribe anytime. Kit stores your email in the US: see our privacy policy.
Want to learn the full method? The Trading Mastery Program teaches the 4 strategies I have traded since 2011. It suits beginners and experienced traders.
Rather follow the trades as they happen? Daily Trading Signals is our Telegram channel: my trade ideas with entry, stop and exit, and every trade is public.
Questions about this post? Ask in the free Telegram channel →
Educational content only, not personalised financial advice. Trading carries risk, including loss of capital. Past performance is not indicative of future results. Synapse Trading is not licensed or regulated by MAS.

