

How to Trade Fast Markets: 2 Strategies for Crashes, Spikes and News
Want the daily routine? Get the free 15-Minute Swing Trader’s Checklist. Get it free →
By Spencer Li, CFTe · Last updated: 26 October 2026
For most retail traders, the best way to trade a fast market is to stay out of it, let the dust settle, and trade the calmer setups that form afterwards. If you do want to trade the fast move itself, there are only two basic approaches: go with it, as a breakout with momentum, or fade it, betting that an extreme move has run too far. Whichever you pick, the thing that decides the outcome is a plan written before the market opens, because a fast market gives you no time to think and act at once.
What does a fast market actually look like?
I first wrote this post on 11 March 2020, in the middle of the COVID crash. What came next is about as good a picture of a fast market as you will find.
The next day, 12 March, the S&P 500 fell 9.5%. On 13 March it rose 9.3%. On 16 March it fell 12.0%. Three trading days, and the index had swung by roughly a tenth of its value each time, first down, then up, then down again.
The VIX, the index that measures how much volatility traders expect in the S&P 500, closed at 82.69 on 16 March 2020. That is the highest close in Cboe’s daily record, which goes back to 1990. For scale, the median close across those 36 years is about 17.6, and on 23 October 2026 it closed at 19.45.
So a fast market is any stretch where price covers a long distance in a short time. It shows up in a crash, a sharp spike, or the minutes around a big news release. Spreads, the gap between the buying and selling price, get wider. Orders fill at prices you never asked for, which traders call slippage. And price can gap straight past a level overnight, so a stop you set at one price gets filled at a much worse one.
Moves like that are rare on a daily stock chart. They are much more common intraday. When I was trading professionally, we would see such sharp moves a few times a week, be it a market crash or a market spike. To a day trader they are a normal Tuesday. To someone who checks the daily chart after work, they feel like an emergency.
Why is staying out a real strategy?
Most people treat sitting out as doing nothing. I think of it as a position, and usually the right one for a retail trader.
The reason is plain. Every strategy is built for certain conditions. A swing strategy built for clean trends and orderly pullbacks was never designed for a market that moves 10% in a day, so the setups stop meaning what they normally mean. Trading it anyway turns a tested method into a guess.
On 23 October 2025 I described exactly that in my weekly outlook. After a sharp spike down on Friday 10 October, QQQ, the fund that tracks the Nasdaq 100, spent the next days trying to break down, failing, then trying to break up and failing again. I told viewers that “you might have been whipsawed” whichever way you traded it, which is what traders call getting stopped out in both directions in quick succession. In a range like that, I said, “it’s usually better to wait” until the real breakout has happened.
My own trading plan says the same thing about news. I close or reduce positions before major releases like the NFP, the Fed’s rate decisions and big earnings reports. If you want the details of how one of those releases moves markets, I wrote a full guide on the NFP jobs report.
If you trade alongside a full-time job, that kind of patience is much easier with a short daily routine, and my free 15-minute swing trader checklist is the one I use myself.
How does the breakout-and-momentum approach work?
The first way to trade a fast market is to go with it. Price breaks through a level and runs, and you join in the same direction, betting that the move has more fuel in it. This is a close cousin of momentum trading, which buys what is already moving and assumes it keeps moving for a while.
It works when the fast move comes from a real shift in supply and demand, like a surprise that changes what the market is worth, rather than a one-candle spasm of panic. It fails in two ways.
The first is timing. By the time a move feels safe to join, much of the easy distance has already gone, and you risk buying the very top of a blow-off, the final burst of buying before a move runs out. The second is the false breakout, where price pokes through the level, traps everyone who chased it, and snaps back. That is exactly what QQQ did in both directions in October 2025.
So the breakout trader in a fast market needs proof that the move is real, and needs to have decided in advance what would show the trade is wrong. Without that, “breakout trading” is just a polite name for chasing.
How does fading an extreme move work?
The second approach is the opposite. You trade against the fast move once it looks overdone. You sell into a spike that has run too far too fast, or buy a panic that looks exhausted. The idea underneath is mean reversion, the tendency of price to drift back towards its average after stretching far from it, and I cover the research behind it in mean reversion trading.
The appeal is that you are entering near a turning point, so when a fade works, it can work quickly. The danger is just as plain. A move that is already extreme can become more extreme, and “oversold” can stay oversold all the way down.
In early February 2026, gold had just fallen hard and then bounced. For my long-term portfolio I bought a little, but for trading I passed, because “this bounce trade was kind of too fast” to take. Later in the same video I said we would only look at gold and silver again after “some kind of consolidation”. That means a pause where price stops falling and goes sideways for a while. The reason was to avoid “catching a falling knife”, because “sometimes when there’s a huge spike” the price keeps going lower after you buy.
Hence, a fade only makes sense at a genuine extreme with some sign that the move is running out of steam. Fading in the middle of a move, simply because it feels like it has gone far enough, is how traders get run over.
The 2 approaches side by side
| Breakout and momentum | Fade the extreme | |
|---|---|---|
| What you do | Go with the fast move | Trade against it once it looks overdone |
| Works best when | The move has a real cause and keeps following through | Panic or euphoria has clearly run too far and starts to stall |
| Main risk | Buying the top of a blow-off, or a false breakout | The move keeps going and runs you over |
| What you need first | Proof the move is real | Proof the move is tiring |
Notice that each one needs something before you enter. That is the real lesson of a fast market, and it is the subject of the next section.
Why does the plan matter more than the strategy?
In Homer’s Odyssey, Odysseus wants to hear the Sirens, whose song lures sailors onto the rocks. So he has his crew plug their ears with wax and tie him to the mast. Then he gives them one more order in advance: “If I beg and pray you to set me free, then bind me more tightly still.” When the song comes, he frowns and signals to be set free. They tie him tighter, and the ship sails past.
The philosopher Jon Elster built a whole book on that scene, Ulysses and the Sirens, published in 1979, about why people bind their future selves. The insight is that the calm version of you knows something the excited version will forget. Odysseus did not trust himself to be sensible while the Sirens were singing, so he made the decision before they started.
A fast market is a trader’s Sirens. As I wrote in the first version of this post, if you do not have a game plan before you enter the market, you end up as part of someone else’s. The plan does not need to be long. It needs to say which of the two approaches you are using, what would show the trade is wrong, and where you would take profit, and it needs to be written down while the market is still calm.
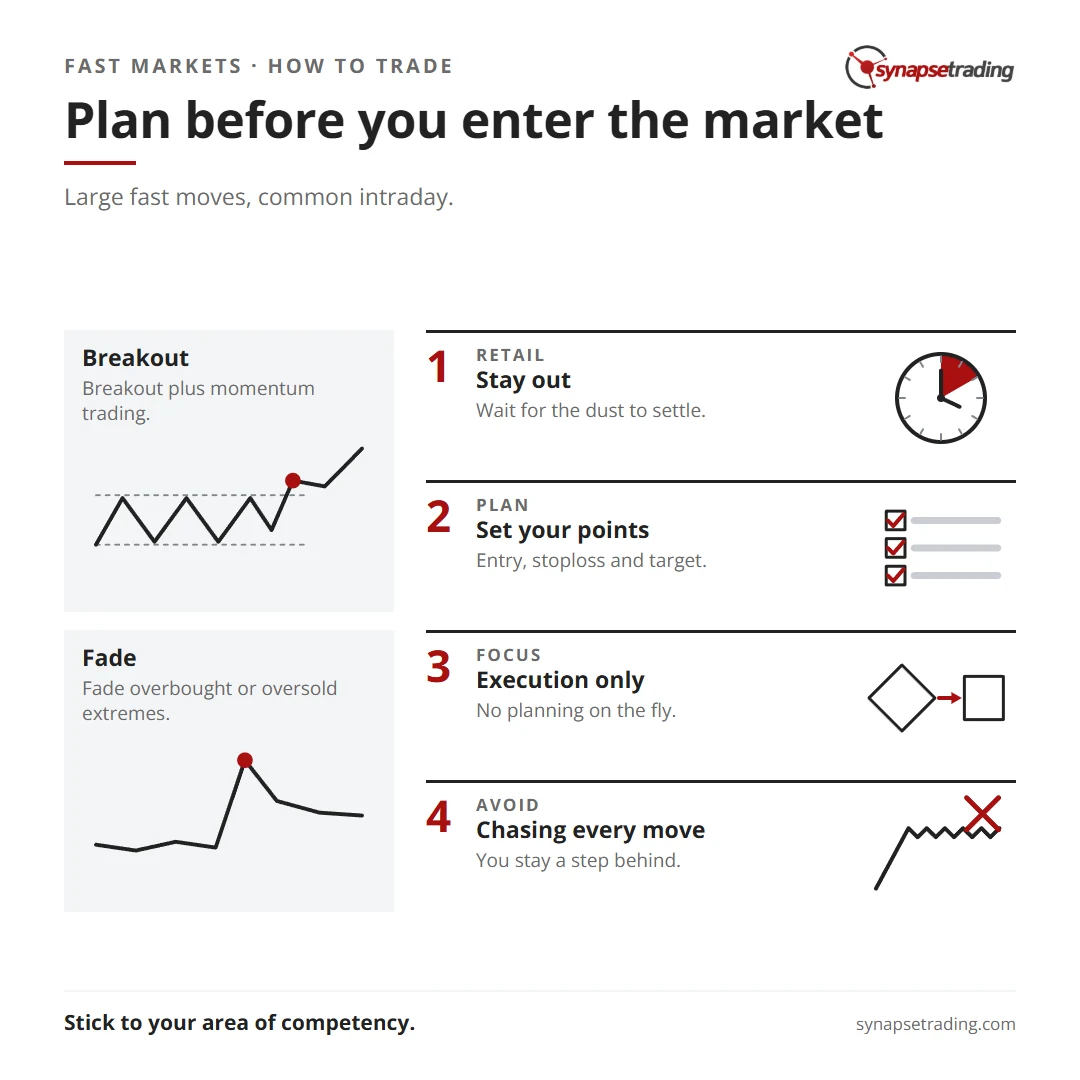
Once the market opens, you only carry it out. This matters most precisely when it is hardest, in a crash or a spike, because there is no time to think and the fear or greed is running high. Without a plan you end up chasing every move, and you are always one step behind the people who walked in with theirs.
Writing the plan down is far easier as part of a short daily habit, and the free 15-minute swing trader checklist is the routine I run each day.
Aren’t crashes where the real money is made?
In April 2025, a trader on Reddit’s r/swingtrading put this view plainly: “most millionaire traders are made after a 20-30% market crash.”
They have a point, and the 2020 crash backs them up. The S&P 500 closed at 2,237.40 on 23 March 2020. By 16 August 2021 it closed at 4,479.71, double the March low.
But nobody knew on 23 March that it was the low, and anyone who tried to catch it in the days before had to sit through moves like the 12.0% fall on 16 March. Now suppose you had waited for the dust to settle. The VIX first closed back under 30 on 8 May 2020, when the S&P 500 closed at 2,929.80. You would have missed about 31% off the bottom, which stings. You would still have made about 53% by that August 2021 close, without having to survive the wildest days of the crash with your money on the line.
So the opportunity after a crash is real. Most of it, though, came after the market calmed down, rather than during the fastest days, and that is exactly where a patient swing trader does their work.
For the wider picture of how a swing trader works, my free trading guides are a good place to start.
FAQ
What is a fast market in trading?
A fast market is a period when price moves a long way in a short time, as in a crash, a sharp spike or the minutes after a major news release. Spreads widen, orders fill at worse prices than expected, and price can gap past stop levels.
Should beginners trade during a market crash?
For most retail traders, no. The better move is usually to stay out until volatility settles, then trade the cleaner setups that form afterwards. A strategy built for calm conditions loses its meaning when the market moves 10% in a day.
What are the 2 strategies for trading fast markets?
Go with the move, as a breakout with momentum, or fade it, trading against an extreme that looks overdone. They suit opposite conditions, so you pick one for the situation in front of you, never both at once.
Is it better to fade a spike or trade the breakout?
It depends on the move. A breakout suits a move with a real cause that keeps following through. A fade only suits a genuine extreme that shows signs of running out of steam, never a move that merely feels like it has gone far enough.
What is the VIX, and what does a high reading mean?
The VIX is Cboe’s index of how much volatility traders expect in the S&P 500 over the next 30 days. Its median close since 1990 is about 17.6, and its highest close was 82.69 on 16 March 2020, so a reading far above the median tells you the market is in a fast phase.
Why do professional traders see fast moves more often?
Because fast moves are rare on a daily chart but common on intraday charts. A day trader watching minute-by-minute prices around news releases can meet them a few times a week, while a daily-chart trader meets one only now and then.
When the next fast market arrives, will you be sitting out, or will you have a plan for one of the two approaches ready before the open? Let me know in the comments.
And if you want a routine that keeps you calm when the market is not, grab the free 15-minute swing trader checklist.
About the author. Spencer Li is The 15-Minute Trader and the founder of Synapse Trading. He is a Certified Financial Technician (CFTe) with 15+ years of trading, run from 70+ countries. He holds a B.Acc and B.BM from SMU. Every trade he takes is public, dated, losses left in. He teaches rules-based swing trading in 15 minutes a day, one system for any market.
Education, not financial advice. Synapse Trading is not licensed by MAS to advise on investment products. Trading carries risk of loss, and past performance is not indicative of future results.
Want the daily routine? Enter your email for the free 15-Minute Swing Trader's Checklist.
Free 5-page PDF, then occasional trading emails. Education only, not financial advice. Unsubscribe anytime. Kit stores your email in the US: see our privacy policy.
Want to learn the full method? The Trading Mastery Program teaches the 4 strategies I have traded since 2011. It suits beginners and experienced traders.
Rather follow the trades as they happen? Daily Trading Signals is our Telegram channel: my trade ideas with entry, stop and exit, and every trade is public.
Questions about this post? Ask in the free Telegram channel →
Educational content only, not personalised financial advice. Trading carries risk, including loss of capital. Past performance is not indicative of future results. Synapse Trading is not licensed or regulated by MAS.

