
• Link to Facebook
  • Link to X
  • Link to Instagram
  • Link to Youtube
  • Link to LinkedIn
  • Link to Mail
Free PDF: The 15-Minute Swing Trader's Checklist, the daily routine of a trader since 2007
Synapse Trading
  • Mentoring
    • Trading Mastery Program
    • All mentoring options
  • Signals
    • Daily trading signals
    • Signals trade log
  • Results
    • Student results and testimonials
    • Public trade log, losses left in
  • Free guides
    • Start here
    • Trading foundations
    • Technical analysis
    • Strategies and systems
    • Risk and money
    • Trading psychology
    • Markets and products
    • Free trading guides
    • Tools and resources
    • Blog
  • About
    • My background
    • My trading journey
    • Media and interviews
    • Travel log
  • Contact
    • Contact me
    • Partnerships
  • Start free
  • Click to open the search input field Click to open the search input field Search
  • Menu Menu
The Synapse Network

What are Oscillators & Momentum Indicators?
Technical Analysis & Price Action
Oscillators and momentum indicators - indicators
Home › Trading guides › Technical indicators guide

Want the daily routine? Get the free 15-Minute Swing Trader’s Checklist. Get it free →

An oscillator is a technical analysis tool used by traders to identify short-term overbought or oversold conditions in the market. By fluctuating between two extreme values, the oscillator helps in determining potential reversal points in price, especially in a sideways or range-bound market.
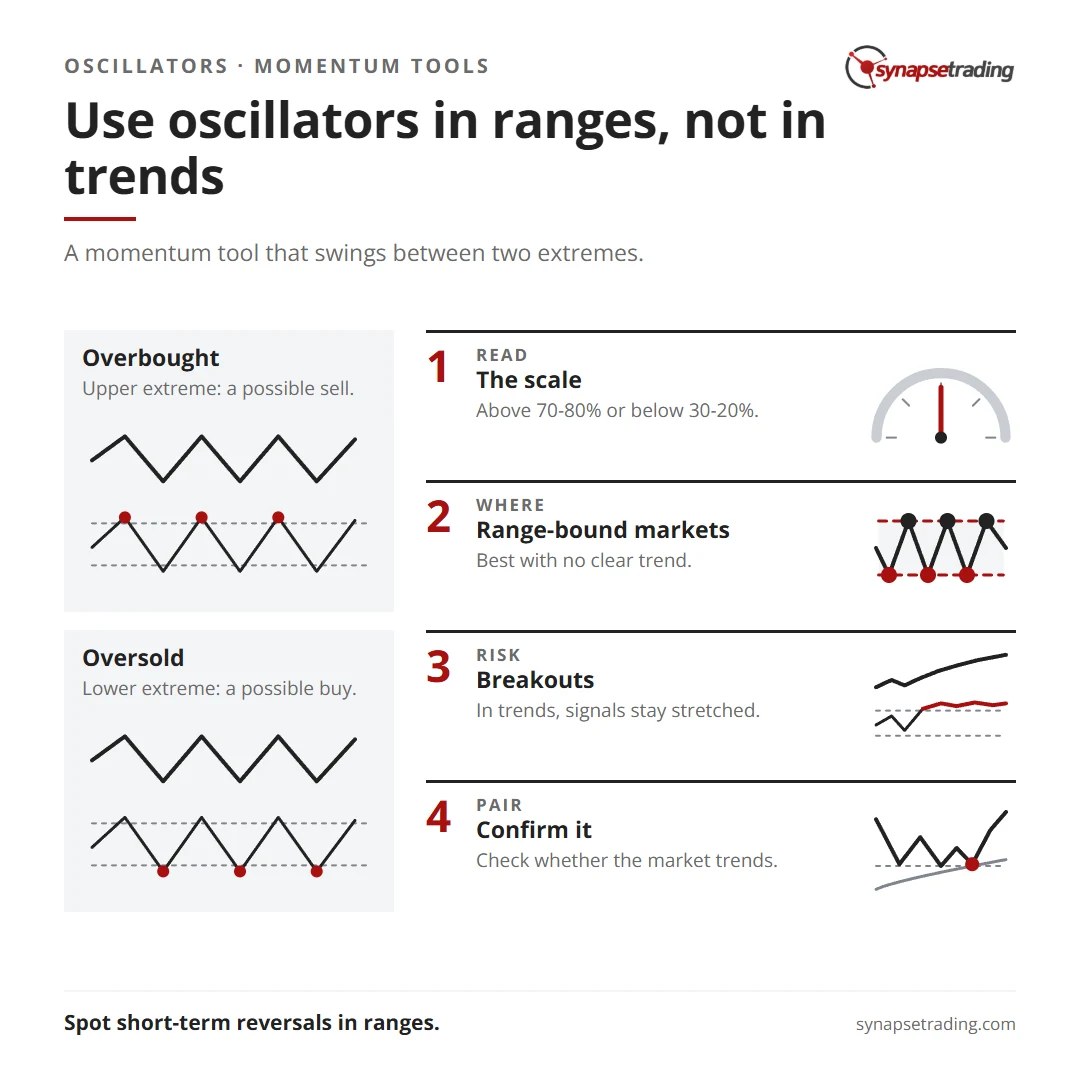
Use oscillators in ranges, not in trends. Summary card for the post: What are Oscillators & Momentum Indicators?.

Table of Contents

Toggle
  • Key Features of Oscillators
  • How Oscillators Work
  • Mechanics of an Oscillator
  • Application and Limitations
  • Concluding Thoughts

Key Features of Oscillators

  • Momentum Indicators: Oscillators are bounded momentum indicators that provide signals based on their position within an established range.
  • Overbought/Oversold Signals: When an oscillator reaches the upper extreme of its range, the asset is considered overbought, suggesting a potential sell signal. Conversely, when the oscillator reaches the lower extreme, the asset is considered oversold, indicating a potential buy signal.
  • Combination with Other Indicators: Oscillators are often used alongside other indicators, such as moving averages, to confirm signals and enhance the reliability of trend breakouts or reversals.

How Oscillators Work

Oscillators are particularly useful when a clear trend is not evident in the price action, such as in a sideways or range-bound market. The most common types of oscillators include:

  • Stochastic Oscillator
  • Relative Strength Index (RSI)
  • Rate of Change (ROC)
  • Money Flow Index (MFI)

Mechanics of an Oscillator

  1. Percentage Scale: Oscillators are typically measured on a percentage scale, often from 0 to 100. The position of the oscillator is based on the asset’s closing price relative to its price range over a specified period.
  2. Overbought and Oversold Conditions:
    • An oscillator reading above 70-80% typically indicates an overbought condition, signaling a potential selling opportunity.
    • A reading below 30-20% indicates an oversold condition, signaling a potential buying opportunity.

Application and Limitations

  • Range-Bound Markets: Oscillators are most effective in non-trending markets, where they help traders take advantage of price oscillations within a defined range.
  • Price Breakouts: When a breakout occurs, the oscillator may remain in the overbought or oversold zone for an extended period, making the signals less reliable during trending markets.

Concluding Thoughts

Oscillators are powerful tools for traders, especially in identifying short-term reversals in range-bound markets. However, they are most effective when used in conjunction with other technical indicators that can confirm whether the market is trending or not. By understanding the strengths and limitations of oscillators, traders can better navigate market conditions and improve their decision-making processes.


Want the daily routine? Enter your email for the free 15-Minute Swing Trader's Checklist.

Free 5-page PDF, then occasional trading emails. Education only, not financial advice. Unsubscribe anytime. Kit stores your email in the US: see our privacy policy.

Want to learn the full method? The Trading Mastery Program teaches the 4 strategies I have traded since 2011. It suits beginners and experienced traders.

Rather follow the trades as they happen? Daily Trading Signals is our Telegram channel: my trade ideas with entry, stop and exit, and every trade is public.

Questions about this post? Ask in the free Telegram channel →

Educational content only, not personalised financial advice. Trading carries risk, including loss of capital. Past performance is not indicative of future results. Synapse Trading is not licensed or regulated by MAS.

Part of the Technical indicators guide · all posts on Technical Analysis & Price Action

← Previous: Parabolic Stop and Reversal (PSAR) IndicatorNext: Price Rate Of Change (ROC) Indicator →

More from this guide

  • Momentum (M) Indicator
  • Average Directional Index (ADX) Indicator
  • Relative Strength Index (RSI) Indicator
by The Synapse Network
Share this entry
  • Share on Facebook
  • Share on X
  • Share on WhatsApp
  • Share on Pinterest
  • Share on LinkedIn
  • Share on Tumblr
  • Share on Vk
  • Share on Reddit
  • Share by Mail
  • Visit us on Yelp
  • Link to Instagram
  • Link to Youtube
https://synapsetrading.com/wp-content/uploads/2026/10/what-are-oscillators-momentum-indicators-card.webp 630 1200 The Synapse Network https://synapsetrading.com/wp-content/uploads/2026/10/synapse-logo-horizontal-light.png The Synapse Network2023-09-01 02:06:352026-10-05 16:28:09What are Oscillators & Momentum Indicators?

Free checklist

The 15-Minute Swing Trader’s Checklist

The daily and weekly routine I use to find, manage and review trades in about 15 minutes a day, trading since 2007.

Get the free checklist

Topics

  • Trading foundations
  • Technical analysis
  • Strategies and systems
  • Risk and money
  • Trading psychology
  • Markets and products

Synapse Trading

Swing trading for busy professionals, in 15 minutes a day.

Start free

Learn

  • Start here
  • Free trading guides
  • Blog
  • Tools and resources

Programs

  • Trading Mastery Program
  • Daily trading signals
  • Student results
  • Public trade log

Company

  • About
  • Contact me
  • Partnerships
  • Disclaimer
  • Privacy policy
  • Terms & Conditions

Synapse Trading Pte Ltd
Registration No. 201316168H
WhatsApp +65-8897-1204
info@synapsetrading.com

Contact Us

Synapse Trading Pte Ltd
Registration No. 201316168H

Whatsapp: +65-8897-1204
Telegram: @iamrecneps
Email: info@synapsetrading.com

Links

Disclaimer
Privacy policy
Terms & Conditions
Contact us
Partnerships

© 2012-2026 Synapse Trading | All rights reserved. Educational content only, not personalised financial advice. Trading carries risk, including loss of capital. Past performance is not indicative of future results. Synapse Trading is not licensed or regulated by MAS.
  • Link to Facebook
  • Link to X
  • Link to Instagram
  • Link to Youtube
  • Link to LinkedIn
  • Link to Mail
Link to: Price Rate Of Change (ROC) Indicator Link to: Price Rate Of Change (ROC) Indicator Price Rate Of Change (ROC) Indicator
Price rate of change (ROC) - indicators
Link to: Momentum (M) Indicator Link to: Momentum (M) Indicator
The momentum indicator - indicators
Momentum (M) Indicator
Scroll to top Scroll to top Scroll to top