

Inverted Yield Curve and Recession: How to Read the Signal, and What Happened After 2022
Want the daily routine? Get the free 15-Minute Swing Trader’s Checklist. Get it free →
By Spencer Li, CFTe · Last updated: 26 October 2026
An inverted yield curve is when short-term US government bonds pay a higher interest rate than long-term ones, which is the opposite of normal. It matters because every one of the four US recessions since 1990 came after one. But the longest and deepest inversion in the US Treasury’s daily data, which ran from July 2022 to August 2024, has not been followed by a recession, as at 27 October 2026. So the honest way to read the curve is as a warning to pay attention, rather than a countdown timer.
What is the yield curve?
On 30 December 2021, a 3-month US Treasury bill paid 0.05% a year, while a 30-year bond paid 1.93%, so the longer you were willing to lend the government your money, the more it paid you for the wait.

That is the yield curve. You take the interest rate, or yield, that each Treasury pays, and plot it against its maturity, which is how long until the bond is repaid. Yield goes on the vertical axis and maturity on the horizontal one, and the line joining the dots is the curve.
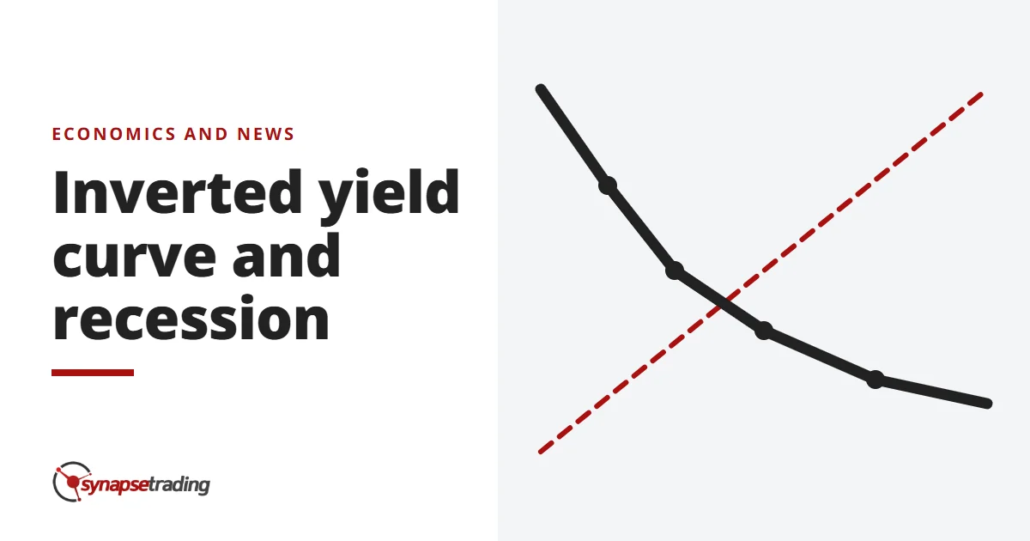
On a normal day, the line slopes up, like the chart above. It makes sense, because tying your money up for 30 years carries more risk than tying it up for three months, so you want more interest in return.
Then it flipped. Look at 16 December 2022. The 6-month bill paid 4.68%, while the 10-year bond paid only 3.48%.

The line now slopes down. Short-term money pays more than long-term money, and that is an inverted yield curve. It is unusual, and it tends to make economists quite nervous.
Which yield spread do people actually watch?
Nobody stares at the whole curve every day. Most people watch one or two gaps on it, called spreads, and the two you will see quoted most are these.
- The 10-year minus the 2-year. The one that makes the headlines.
- The 10-year minus the 3-month. The one many economists prefer, because the 3-month yield sits very close to the Fed’s own policy rate.
When either number drops below zero, the curve at that point is inverted. Here is what both did in the last cycle, using the Treasury’s daily par yield curve rates.
| 10-year minus 2-year | 10-year minus 3-month | |
|---|---|---|
| First close below zero | 1 April 2022 | 18 October 2022 |
| Long inverted run | 6 July 2022 to 26 August 2024 | 25 October 2022 to 12 December 2024 |
| Deepest point | -1.08 points, 3 July 2023 | -1.89 points, 4 May 2023 |
| Reading on 23 October 2026 | +0.31 points | +0.78 points |
To put the depth in context, -1.08 is the deepest the 10-year minus 2-year spread has been in the Treasury’s daily data, which goes back to 1990. The 2000 inversion bottomed at -0.52. And the run itself, more than two years long, is also the longest in that data.
If you would rather not track spreads every week, my free 15-minute swing trader checklist is the daily routine I use myself.
Why would short-term bonds pay more than long-term ones?
It sounds backwards, and the old version of this post got it backwards too. So it is worth slowing down here.
The short end of the curve is mostly set by the central bank. After its first hike in March 2022, the Fed’s target range was 0.25% to 0.50%. By July 2023, after 11 hikes, it was 5.25% to 5.50%. Short-term Treasury yields went up with it, because nobody will lend to the government for three months at 1% when the Fed’s own rate sits above 5%.
The long end is different. A 10-year yield is roughly the market’s guess at where short rates will average over the next ten years, plus a little extra for the wait. So if investors expect the Fed to cut rates later, because they think the hikes will slow the economy down, they are happy to lock in a 10-year bond at a yield below today’s short rate.
Hence an inversion is really the bond market saying two things at once. Rates are high now, and they will not stay this high, probably because growth is about to weaken.
How does an inverted yield curve lead to a recession?
The curve does not cause a recession by itself. It works through how people borrow, and the chain runs something like this.
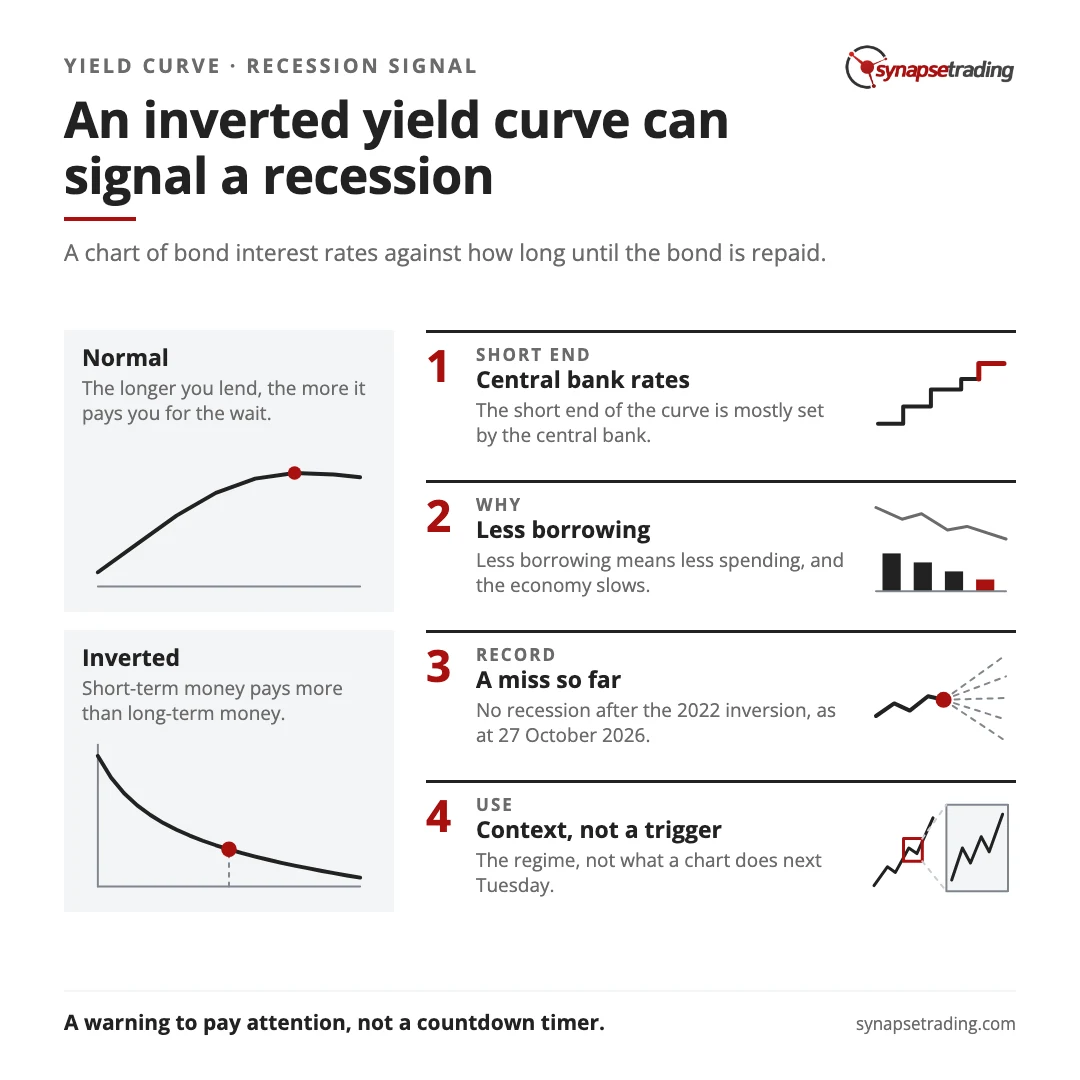
- Banks borrow short and lend long. When short rates sit above long rates, that margin gets squeezed, so they lend less and lend more carefully.
- Businesses look at expensive short-term money and a gloomy forecast, and push back the new factory or the extra hires.
- Households face higher rates on mortgages, car loans and credit cards, and spend less.
Less borrowing means less spending, and less spending can tip a slowing economy into a recession, so in that sense the signal can partly fulfil itself, because everyone reads the same curve and acts on the same fear.
What does the record since 1990 actually say?
This is where most articles quote a neat “6 to 18 months” and move on. I would rather show you the dates, because the real record is messier, and more useful.
The recession dates below come from the National Bureau of Economic Research (NBER), the group that officially dates US recessions. The inversion dates are the first day the 10-year minus 2-year spread closed below zero in each episode.
| Inversion began | Business cycle peak (NBER) | Gap |
|---|---|---|
| March 1990 | July 1990 | about 4 months |
| May 1998 | none for nearly 3 years | a false alarm |
| February 2000 | March 2001 | about 13 months |
| December 2005 | December 2007 | about 24 months |
| August 2019 | February 2020 | about 6 months |
| April 2022 | none dated, as at 27 October 2026 | 54 months and counting |
Do note two things about this table. The 1990 row is cut short, because the Treasury’s daily data only starts in January 1990. And the 2020 recession came from a pandemic that nobody forecast in August 2019, so I would not give the curve much credit for that one.
There is one more pattern in the same data that I find more interesting than the inversion itself. In 1990, 2000, 2007 and 2019, the recession began roughly three to six months after the curve turned positive again. The un-inversion, rather than the inversion, was the closer warning, with the 1998 false alarm as the exception. In 2024, the 10-year minus 2-year spread turned positive for good after 5 September. More than two years later, there is still no recession on NBER’s list.
Why did the 2022 inversion not bring a recession?
In January 2025, a trader on Reddit’s r/investing asked, “Why did the inverted yield curve in 12/22 not predict a recession?”
It is a fair question. The honest first answer is that it has not, at least as at 27 October 2026. NBER’s latest peak is still February 2020. NBER does date recessions late, though. It only announced the December 2007 peak on 1 December 2008, a full year after the fact. So “no recession yet” carries a small asterisk. But 54 months after the first inversion is already well past every gap in the table above, so I think it is fair to call this one a miss so far.
What happened instead shows up quite clearly in the bond data. The Fed cut its target from a range of 5.25% to 5.50% in September 2024 to a range of 3.50% to 3.75% by December 2025, and short-term yields fell with it, but long-term yields went the other way. The 10-year yield was 3.82% on 26 August 2024, 4.18% on 31 December 2025 and 5.00% on 23 October 2026, after the Fed raised rates again in September 2026. So the curve un-inverted mostly because long rates refused to come down.
I noticed the same thing from the chart side in my weekly outlook on 18 December 2025. I said that long-term bonds had “still been pretty much sideways” even with the rate cuts. To me that meant the market was “preparing for long term higher interest rates”, and that this could be “the new normal price” for long-term bonds. It was also why I said I had given up on buying them, because they had stopped being any good for trading.
What does a 1912 chicken have to do with the yield curve?
In 1912, the philosopher Bertrand Russell wrote about a chicken that is fed by the same man every day of its life. It has every reason to expect breakfast tomorrow. Then, as Russell put it, the man “at last wrings its neck instead”.
His point was about induction, which is reasoning from what has happened before to what will happen next, and about how a long record of the same outcome feels like proof up until the day it is not.
The yield curve has the opposite problem to the chicken. Its record looks impressive, but it is short. Since 1990 there have been only four US recessions to test it on, and one of them was a virus. Four out of four sounds like certainty. But it is really just four data points, and the 2022 cycle has now added a fifth that went the other way. Personally, I find that a healthy reminder whenever any indicator gets described as “never wrong”. The fewer times something has been tested, the less its perfect score is worth.
What should a trader do when the curve inverts?
So the curve is worth watching, and not worth obeying blindly. What does that look like in practice?
Imagine you had sold every stock you owned on 6 July 2022, the day the long inversion began, and waited for the recession to show up. You would still be waiting, more than four years later. That is the real risk of treating a macro signal as a trigger. It can be right about the direction of the economy and still wreck your timing, and the regret of sitting on the sidelines for four years is its own kind of pain.
For a swing trader who holds for days or weeks, the curve works better as context. It tells you what regime you are probably in, and whether the next year is more likely to bring cuts, hikes or a slowdown. It cannot tell you what any chart will do next Tuesday. My own trading plan keeps the macro calendar in a simpler place. It says to close or reduce positions before major news like an FOMC decision, and to let price decide the rest.
For a long-term investor, the more useful question is about you rather than the curve. How long until you need the money, and how much of a fall could you sit through without selling at the bottom? Those two answers decide how much a recession warning should change, far more than the spread does.
Reading the regime is a habit, and habits are easier to keep with a routine. The free 15-minute swing trader checklist is the one I run every day.
FAQ
What is an inverted yield curve?
It is when short-term government bonds pay a higher yield than long-term ones. The most quoted version is the 10-year Treasury yield falling below the 2-year yield.
Does an inverted yield curve always mean a recession is coming?
No. Each of the four US recessions since 1990 came after one, but the May 1998 inversion was a false alarm, and the 2022 to 2024 inversion had not been followed by a recession as at 27 October 2026.
How long after an inversion does a recession start?
Since 1990, the gap has been as short as about 4 months and as long as about 24 months. In each of those cases, the recession began a few months after the curve turned positive again.
Is the yield curve inverted now?
No. On 23 October 2026, the 10-year yield was 5.00%, against 4.69% for the 2-year and 4.22% for the 3-month, according to the US Treasury.
When was the yield curve last inverted?
The 10-year minus 2-year spread was inverted from July 2022 to August 2024, with two brief dips in early September 2024. The 10-year minus 3-month spread stayed inverted until December 2024 and dipped below zero on and off in 2025, last on 16 October 2025.
Why does an inverted yield curve worry banks?
Banks borrow short and lend long. When short rates sit above long rates, their lending margin shrinks, so they tend to lend less, which slows the economy further.
So which spread do you watch, and did the 2022 inversion change how much you trust it? Let me know in the comments.
If you want to see how the Fed’s moves feed into all of this, I wrote about how interest rate cuts affect your investments. The jobs report and the inflation report are the two numbers that drive those decisions, and I cover them in what NFP means and what the CPI is. The rest are collected in my free trading guides.
And if you want a routine that reads the market in 15 minutes without forecasting the next recession, grab the free 15-minute swing trader checklist.
About the author. Spencer Li is The 15-Minute Trader and the founder of Synapse Trading. He is a Certified Financial Technician (CFTe) with 15+ years of trading, run from 70+ countries. He holds a B.Acc and B.BM from SMU. Every trade he takes is public, dated, losses left in. He teaches rules-based swing trading in 15 minutes a day, one system for any market.
Education, not financial advice. Synapse Trading is not licensed by MAS to advise on investment products. Trading carries risk of loss, and past performance is not indicative of future results.
Want the daily routine? Enter your email for the free 15-Minute Swing Trader's Checklist.
Free 5-page PDF, then occasional trading emails. Education only, not financial advice. Unsubscribe anytime. Kit stores your email in the US: see our privacy policy.
Want to learn the full method? The Trading Mastery Program teaches the 4 strategies I have traded since 2011. It suits beginners and experienced traders.
Rather follow the trades as they happen? Daily Trading Signals is our Telegram channel: my trade ideas with entry, stop and exit, and every trade is public.
Questions about this post? Ask in the free Telegram channel →
Educational content only, not personalised financial advice. Trading carries risk, including loss of capital. Past performance is not indicative of future results. Synapse Trading is not licensed or regulated by MAS.

