

Shortcuts to Analyzing Financial Ratios for Stocks
Want the daily routine? Get the free 15-Minute Swing Trader’s Checklist. Get it free →
Seven ratios do most of the filtering when you judge a company: gross margin, net margin, return on equity, the current ratio, debt to cash flow, net gearing and dividend yield. Each one turns two numbers from the financial statements into a single figure you can compare across companies.
Reading financial statements is one thing; analyzing them and deciphering their true meaning is another. To do that, you need to understand the seven essential financial ratios. They’re like a shortcut for filtering out good stocks.
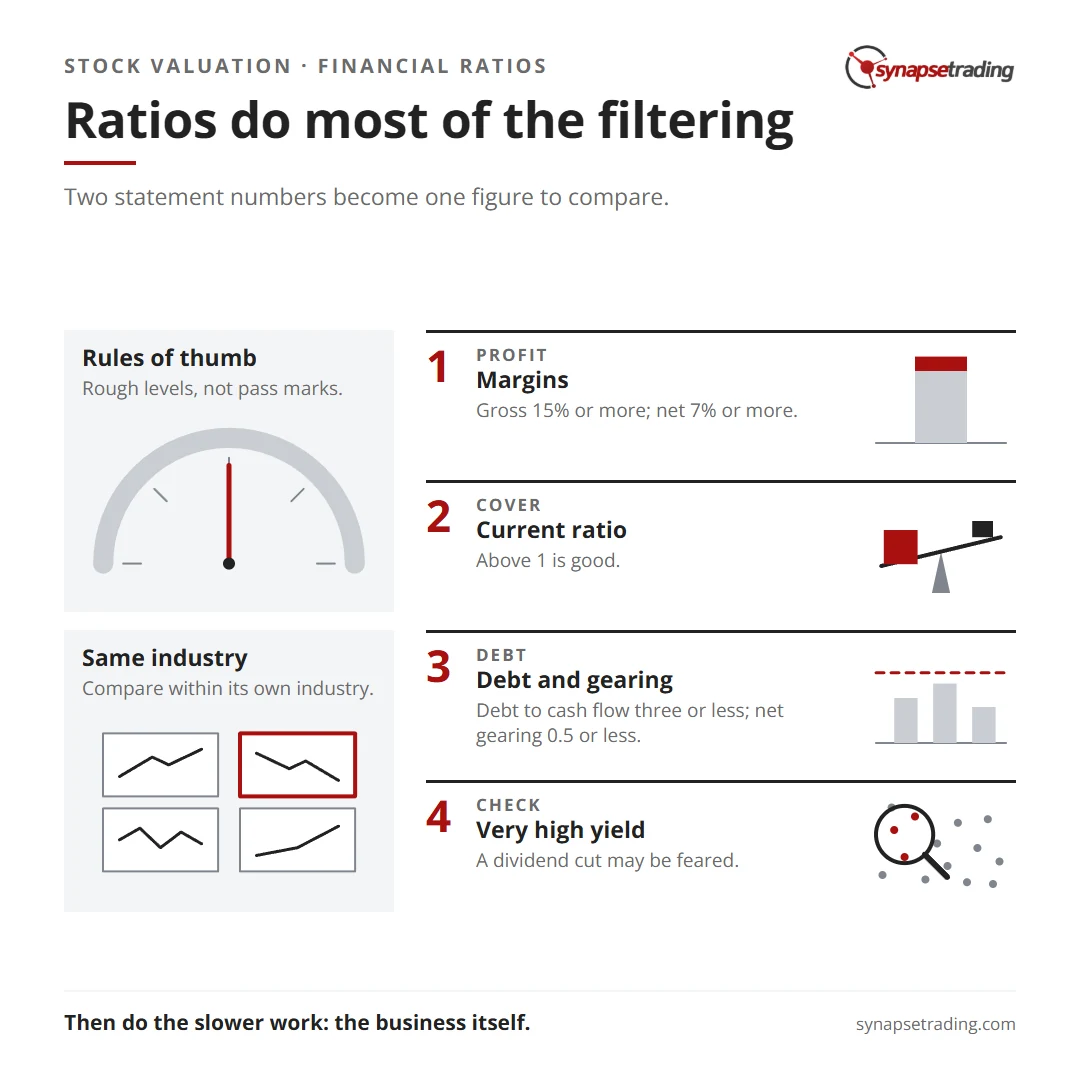
Do note that the levels below are rough rules of thumb rather than pass marks. A healthy margin for a supermarket would be a weak one for a software company, and banks and REITs are judged on different measures altogether. So compare a company with others in its own industry before you read too much into any single ratio.
The first is gross profit margin. This represents the proportion of money left over after subtracting the cost of goods sold. To calculate gross profit margin, take gross profit and divide by sales. The higher the margin, the more profitable a company is. Margins of 15% or more are considered good.
The second ratio is net profit margin. This represents the portion of money left after subtracting all expenses. To calculate net profit margin, divide net profit by sales. The higher the margin, the more profitable the company is. In general, look for margins of 7% or more.
The third ratio is return on equity or ROE. This measures how much profit a company makes from shareholder equity. To calculate ROE, take the net profit and divide it by equity. The higher the number, the more money the company makes for its shareholders. Look for an ROE of 15% or higher.
The fourth essential ratio is the current ratio. This measures a company’s current assets against its current liabilities. To calculate the current ratio, simply divide the current assets by the current liabilities. The higher the ratio, the more likely the company will be able to cover short term liabilities. A good current ratio is anything above 1.
The fifth ratio you should know is the debt to cash flow ratio. This measures the company’s debts against its operating cash flow. To calculate this, take the company’s total debt and divide it by operating cash flow. The lower the ratio, the better the company’s ability to finance their operations, any ratio less than or equal to three is considered good.
The sixth essential ratio is the net gearing ratio. This measures the company’s debts against its shareholder equity. To calculate this ratio, first take the total debt and subtract the company’s cash, then divide that number by the equity. The higher the ratio, the more debt and therefore risk the company has. Look for a net gearing ratio of 0.5 or less.
Finally, the seventh essential ratio is the dividend yield. This measures how much in dividends the company pays out compared to their stock price. To calculate the dividend yield, take the dividend per share and divide it by share price. The higher the yield, the more dividends shareholders receive. Look for companies with consistent yields between 4 and 7 percent. A yield far above that range deserves a second look, because the price may have fallen on fears that the dividend is about to be cut.
Run these 7 ratios and most weak companies drop out in a few minutes. If you want a rule that ranks stocks on just 2 numbers, Joel Greenblatt built one: the magic formula from The Little Book That Beats the Market. What is left still needs the slower work from part 1 of this series: the business itself, and the people running it.
The stock valuation series: 1. How to Find Undervalued Stocks for Investment · 2. How to Read Stock Financial Statements · 3. Shortcuts to Analyzing Financial Ratios for Stocks · Going deeper: Book Summary: The Intelligent Investor by Benjamin Graham
Want the daily routine? Get the free 15-Minute Swing Trader’s Checklist.
Educational content only, not personalised financial advice. Trading carries risk, including loss of capital. Past performance is not indicative of future results. Synapse Trading is not licensed or regulated by MAS.
Want the daily routine? Enter your email for the free 15-Minute Swing Trader's Checklist.
Free 5-page PDF, then occasional trading emails. Education only, not financial advice. Unsubscribe anytime. Kit stores your email in the US: see our privacy policy.
Want to learn the full method? The Trading Mastery Program teaches the 4 strategies I have traded since 2011. It suits beginners and experienced traders.
Rather follow the trades as they happen? Daily Trading Signals is our Telegram channel: my trade ideas with entry, stop and exit, and every trade is public.
Questions about this post? Ask in the free Telegram channel →
Educational content only, not personalised financial advice. Trading carries risk, including loss of capital. Past performance is not indicative of future results. Synapse Trading is not licensed or regulated by MAS.

