

Monthly Market Wrap (August 2025)
Want the daily routine? Get the free 15-Minute Swing Trader’s Checklist. Get it free →
If you only looked at where the S&P 500 started and finished August 2025, you would think it was a sleepy month. The index rose 1.91%, from 6,339.39 to 6,460.26. But the path in between was anything but sleepy. The month opened with a jobs report that wiped 258,000 jobs off the previous two months, and it closed with the Fed chair opening the door to a rate cut while the President tried to remove a Fed governor.
In this post, I’m going to walk through what moved markets in August: global stocks, the Fed and other central banks, tariffs and geopolitics, the earnings that stood out, commodities, bonds and currencies, and finally Bitcoin and Ethereum.
Global Stock Market Trends
So how does a month that starts with a 1.6% drop end at a record high?
On 1 August, the S&P 500 fell 1.60% to 6,238.01 after the July jobs report (more on that below). That turned out to be the lowest close of the month. By 28 August the index had closed at a record 6,501.86, above its previous record close of 6,389.77 from 28 July, before slipping back on the last trading day. August was its fourth monthly gain in a row.
The other US indices split. The Nasdaq Composite rose a smaller 1.58%, while the Dow Jones Industrial Average gained 3.20% and also closed at a record, 45,636.90, on 28 August.
The biggest winner was the Russell 2000, which tracks smaller US companies. It jumped 7.00%, from 2,211.65 to 2,366.42. Do note that even after that run, it still sat below its record close of 2,442.74 from November 2021.
Now, here is a detail that is easy to miss if you only watch the headline index. Technology was not the leader this month. The Technology Select Sector SPDR fund (XLK) finished August down 0.11%, while the health care fund (XLV) rose 5.37%, materials (XLB) rose 5.19% and consumer discretionary (XLY) rose 4.66%. Utilities (XLU) were the weakest, down 1.58%. UnitedHealth Group (UNH) alone rose 24.17% in August, and I will come back to that story in the earnings section.
Outside the US, the strongest moves were in Asia. Japan’s Nikkei 225 rose 4.01% and closed at a record 43,714.31 on 18 August, above its July 2024 record close of 42,224.02. China’s Shanghai Composite did even better, rising 7.97% to 3,857.93, and Hong Kong’s Hang Seng added 1.23%.
Europe was close to flat. The Euro Stoxx 50 and the UK’s FTSE 100 each rose 0.60%, while Germany’s DAX slipped 0.68% and France’s CAC 40 slipped 0.88%.
Macroeconomic and Central Bank Developments
United States. What happens when a jobs report rewrites the last two months?
That is what traders woke up to on 1 August. The Bureau of Labor Statistics reported that the US economy added 73,000 jobs in July. The bigger shock was the revisions. May was cut from 144,000 to 19,000, and June from 147,000 to 14,000, so together the two months lost 258,000 jobs from what was first reported. The unemployment rate edged up to 4.2%.
Inflation, meanwhile, refused to cool much. The consumer price index rose 2.7% over the 12 months to July, and core CPI, which strips out food and energy, rose 3.1%. The Fed’s preferred gauge, the PCE price index, came out on 29 August at 2.6% for July, with core PCE at 2.9%. Growth held up too. The second estimate of Q2 GDP, released on 28 August, showed the economy growing at an annualised 3.3%, revised up from the first estimate and a turnaround from a 0.5% contraction in Q1.
So you had a slowing job market sitting next to sticky inflation and decent growth. That is an awkward mix for a central bank.
At its 30 July meeting, the Federal Reserve held its target range at 4.25% to 4.50%. Two governors, Michelle Bowman and Christopher Waller, voted against the decision because they wanted a quarter-point cut.
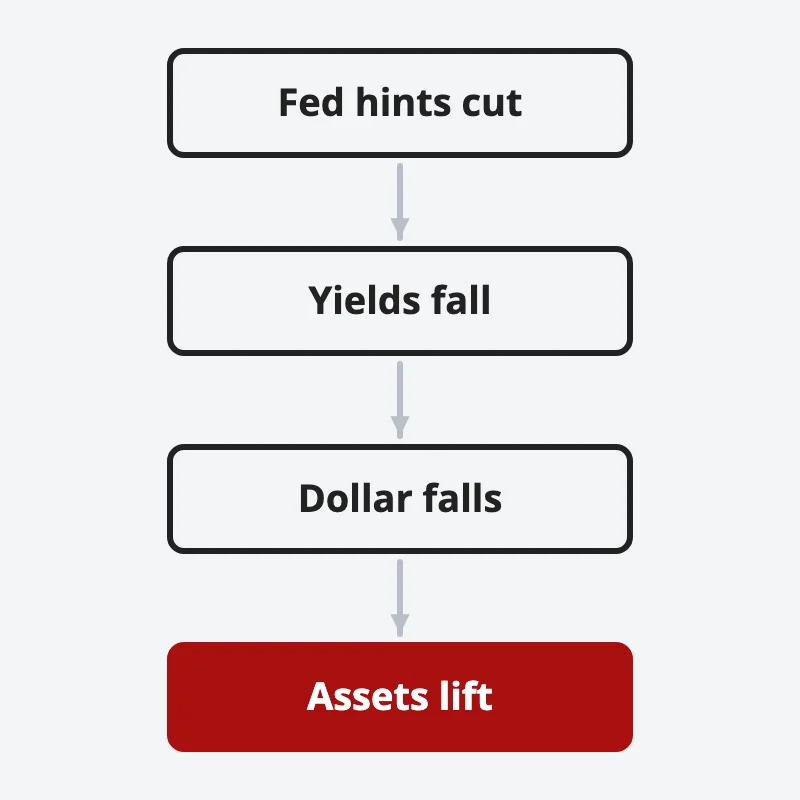
Then came Jackson Hole. On 22 August, Fed Chair Jerome Powell gave his speech, titled “Monetary Policy and the Fed’s Framework Review”, and the tone changed. He said “downside risks to employment are rising”, and that “the shifting balance of risks may warrant adjusting our policy stance.” He made no promise, but markets took it as a hint that a cut was coming. The S&P 500 rose 1.52% that day, and the 2-year Treasury yield fell from 3.79% to 3.68%.
Other central banks. The Bank of England cut its Bank Rate by a quarter point to 4% on 7 August. The vote was 5 to 4, so four of the nine members wanted to hold at 4.25%, which tells you how close that decision was. The European Central Bank had held its deposit rate at 2.00% at its 24 July meeting, a pause after seven cuts in a row. The Bank of Japan held its policy rate at 0.5% on 31 July and raised its core inflation forecast for fiscal 2025 to 2.7%. In China, the 1-year Loan Prime Rate stayed at 3.0% and the 5-year at 3.5% at the 20 August fixing, unchanged since May.
Trade War and Political Developments
Tariffs were back in the headlines from the first week. On 7 August, the new country-by-country “reciprocal” tariff rates from a 31 July executive order took effect, covering close to 70 countries.
India got the harshest treatment. A 25% tariff took effect on 7 August, and an executive order dated 6 August, tied to India’s purchases of Russian oil, added another 25% from 27 August. That took the total on most Indian goods to 50%.
China went the other way. On 11 August, the US extended its tariff truce with China by another 90 days, to 10 November. Under the truce, the US keeps a 30% tariff on Chinese imports and China keeps a 10% tariff on American goods.
The more unusual story was about the Fed itself. On 25 August, President Trump posted a letter removing Fed Governor Lisa Cook, citing allegations about her mortgage applications. Cook denied any wrongdoing, said there was no legal cause to remove her, and filed a lawsuit on 28 August. The Federal Reserve Act lets a president remove a governor only “for cause”, and the law does not define what counts as cause, so the question went to the courts. For markets, the worry was less about one governor and more about whether the Fed can set rates without political pressure.
On the war in Ukraine, the 15 August summit between President Trump and President Putin in Alaska ended without a deal. Less than two weeks later, on 28 August, a Russian missile and drone attack on Kyiv killed at least 25 people. Brent crude rose 1.3% that day, from $67.75 to $68.61, and still finished the month lower.
Corporate Earnings and Stock Market Movers
What does a stock do when a company reports strong numbers? In August, the answer was “it depends on what was already priced in.” Here are the moves that stood out.
1. Nvidia (NVDA). On 27 August, Nvidia reported revenue of $46.7 billion for the quarter ended 27 July, up 56% from a year ago and 6% from the previous quarter. Data center revenue was $41.1 billion, and adjusted earnings came to $1.05 per share. The company said there were no sales of its H20 chip to China-based customers in the quarter, and it guided to revenue of $54.0 billion, plus or minus 2%, for the next quarter. The stock fell 0.79% the next day to $180.17, and finished August down 2.07%.
2. Walmart (WMT). On 21 August, Walmart reported revenue of $177.4 billion, up 4.8%, with US comparable sales up 4.6% and global e-commerce sales up 25%. Adjusted earnings of $0.68 per share missed the $0.73 consensus. Walmart still raised its full-year guidance, to net sales growth of 3.75% to 4.75% and adjusted earnings of $2.52 to $2.62 per share. The stock fell 4.49% that day to $97.96.
3. Target (TGT). On 20 August, Target reported a 1.9% drop in comparable sales, with store sales down 3.2% and digital sales up 4.3%. Net sales were $25.2 billion, down 0.9%, and adjusted earnings fell to $2.05 per share from $2.57 a year earlier. Target kept its full-year outlook and named its chief operating officer, Michael Fiddelke, as the next CEO from 1 February 2026. The stock fell as much as 10.6% during the session and closed down 6.33% at $98.69.
4. MongoDB (MDB). On 26 August, the database software company reported revenue of $591.4 million, up 24%. Atlas, its cloud database, grew 29% and now makes up 74% of revenue. Adjusted earnings of $1.00 per share were well above the $0.66 consensus, and MongoDB raised its full-year revenue guidance to $2.34 billion to $2.36 billion, from $2.25 billion to $2.29 billion. The next day the stock jumped 37.96% to $295.70.
5. Snowflake (SNOW). On 27 August, Snowflake reported product revenue of $1.09 billion, up 32%, and adjusted earnings of $0.35 per share against a $0.27 consensus. It raised its full-year product revenue guidance to $4.40 billion. The stock rose 20.27% the next day to $241.00.
6. Applied Materials (AMAT). This one shows the other side. On 14 August, the chip equipment maker beat on the quarter, with revenue of $7.3 billion against $7.22 billion expected and adjusted earnings of $2.48 against $2.36. But it guided next-quarter revenue to a midpoint of $6.7 billion, below the roughly $7.33 billion analysts wanted, and its finance chief pointed to “digestion of capacity in China”. The stock fell 14.07% the next day to $161.76.
7. UnitedHealth Group (UNH). No earnings here, just a filing. On 14 August, Berkshire Hathaway’s quarterly 13F filing showed it held about 5.04 million UnitedHealth shares as of 30 June. The stock rose 11.98% the next day to $304.01, and ended August up 24.17%.
8. Intel (INTC). A week after SoftBank said it would invest $2 billion in Intel, the US government announced on 22 August that it would take a 9.9% stake, buying 433.3 million shares at $20.47 each. The roughly $8.9 billion came from CHIPS Act grants and Secure Enclave program money that had already been awarded. The stock closed up 5.53% at $24.80 that day and gained 22.98% over the month.
9. Apple (AAPL). On 6 August, Apple announced another $100 billion of US investment over four years, on top of the $500 billion it had pledged in February. The stock rose 5.09% that day to $213.25, and finished August up 11.84%.
Put those nine together and you can see how wide the reactions were. Two software companies rose 20% and 38% in a day, while a retailer that raised its guidance still fell 4.5%.
Commodities, Bonds, and Other Assets
Here is a pair of numbers that do not seem to fit together. Oil fell about 8% in August, yet the energy sector fund (XLE) rose 3.65%.
Oil. On 3 August, eight OPEC+ members agreed to raise output by 547,000 barrels per day in September. Brent crude fell from $73.43 at the end of July to $67.83 at the end of August, a drop of 7.6%, and touched $66.25 on 13 August. West Texas Intermediate, the US benchmark, fell 8.5%, from $70.36 to $64.36.
Gold and silver. Gold futures rose 6.77% in August, from $3,293.20 to $3,516.10 an ounce. That was a record closing high for the contract, above the $3,452.80 close from 13 June. Silver did even better, rising 9.98% to $40.20, its highest close since September 2011. Copper futures gained 4.34% to $4.52 a pound, while wheat futures slipped 1.0%.
Bonds. Treasury yields fell, and the short end fell the most. The 10-year yield went from 4.37% to 4.23%, while the 2-year yield dropped from 3.94% to 3.59%, a fall of 35 basis points (a basis point is 0.01%). That made the yield curve steeper, and the gap between the 10-year and 2-year yields widened from 0.43 to 0.64 percentage points, staying positive for the whole month. In credit, the spread on US high-yield bonds stayed tight, ending August at 2.82 percentage points above Treasuries.
Currencies. The US dollar index fell 2.26%, from 100.03 to 97.77. The euro rose 2.3% against the dollar to about $1.17, and the British pound rose 2.2% to about $1.35. The Japanese yen strengthened too, with the dollar going from 150.60 yen at the end of July to 146.90 at the end of August, which works out to a gain of about 2.5% for the yen. The Chinese yuan firmed about 1.0%, from 7.20 to 7.13 per dollar.
Hence, the common thread across these markets was lower US rates and a softer dollar.
Bitcoin and Ethereum
August was a month where the two largest cryptocurrencies went in opposite directions.
Bitcoin (BTC). Bitcoin hit a record intraday high of about $124,457 on 14 August, just above its July peak of about $123,092. It did not hold, and by 31 August it had fallen to about $108,237, down 6.5% for the month from about $115,758. On 29 August, the last US trading day of the month, it closed at about $108,411.
Ethereum (ETH). Ethereum had a far better month. It rose 18.75%, from about $3,697 to about $4,390. On 22 August, the day of Powell’s speech, it jumped 14.4% in a single day, from about $4,223 to about $4,831. Two days later it touched about $4,954, its first new all-time high since November 2021, when it peaked near $4,892. The spot Ether fund iShares Ethereum Trust (ETHA) rose 16.09% over the month.
So if you only followed Bitcoin, August felt like a pullback. If you followed Ethereum, it was a breakout to a record.
Concluding Thoughts
August 2025 came down to one shift. The month started with weak jobs data and a Fed on hold, and it ended with the Fed chair hinting at a cut, yields lower and the dollar weaker. US stocks finished near record highs, small caps rose 7%, and gold closed at a record.
But a few things were still unresolved at the end of the month. Inflation was still well above 2%, with core PCE at 2.9%. The new tariffs were only weeks old, and the China truce now runs to 10 November. And the Lisa Cook case had put the Fed’s independence in front of a judge.
What I will be watching next is simple: the Fed’s September decision, the next jobs and inflation reports, and how the Cook case moves through the courts.
How did you trade the Jackson Hole move? Did you notice the split between oil and energy stocks on your own charts? And were you watching Bitcoin or Ethereum this month? Let me know in the comments.
Want the daily routine? Enter your email for the free 15-Minute Swing Trader's Checklist.
Free 5-page PDF, then occasional trading emails. Education only, not financial advice. Unsubscribe anytime. Kit stores your email in the US: see our privacy policy.
Want to learn the full method? The Trading Mastery Program teaches the 4 strategies I have traded since 2011. It suits beginners and experienced traders.
Rather follow the trades as they happen? Daily Trading Signals is our Telegram channel: my trade ideas with entry, stop and exit, and every trade is public.
Questions about this post? Ask in the free Telegram channel →
Educational content only, not personalised financial advice. Trading carries risk, including loss of capital. Past performance is not indicative of future results. Synapse Trading is not licensed or regulated by MAS.

